. 2023 Dec 4;14(1):8018.
doi: 10.1038/s41467-023-43088-3.

Isochronic development of cortical synapses in primates and mice

Affiliations

Isochronic development of cortical synapses in primates and mice

Gregg Wildenberg et al. Nat Commun. .

Abstract

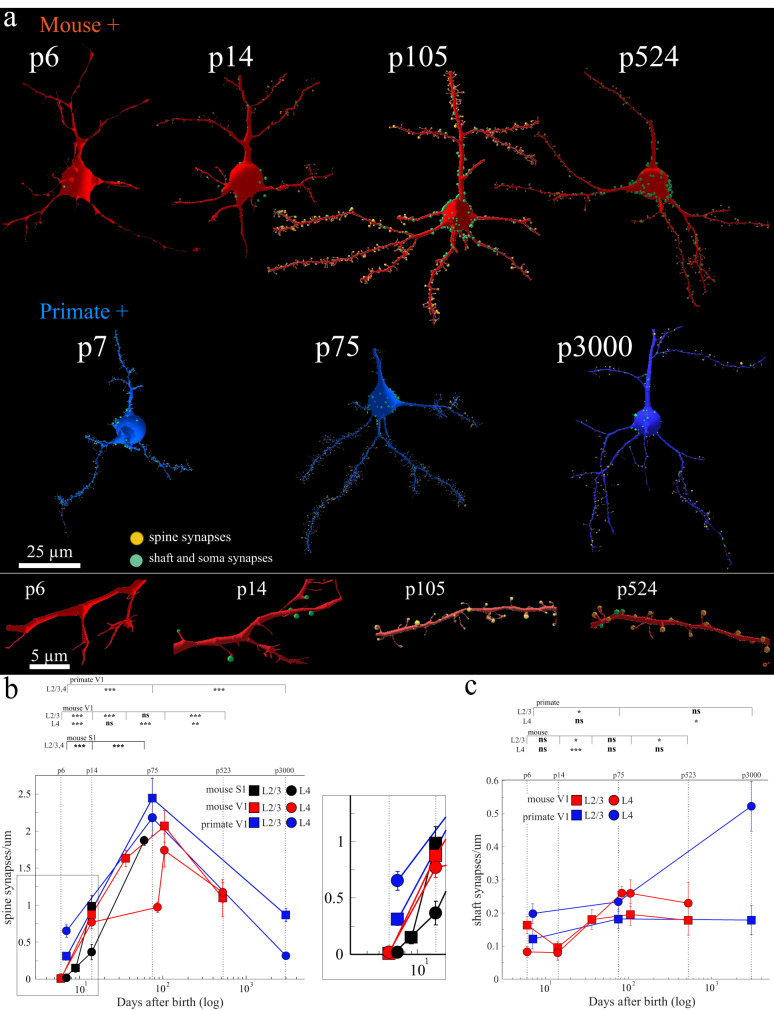
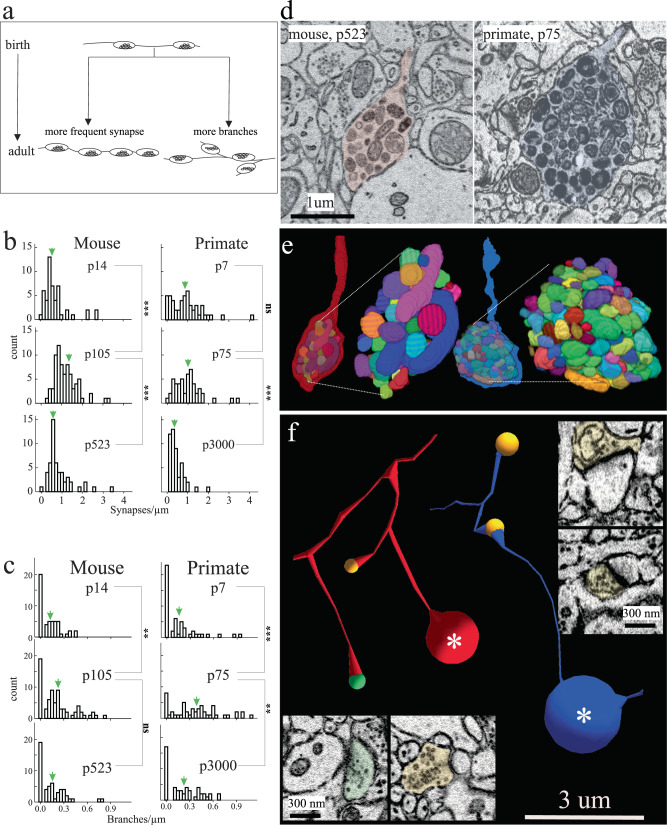
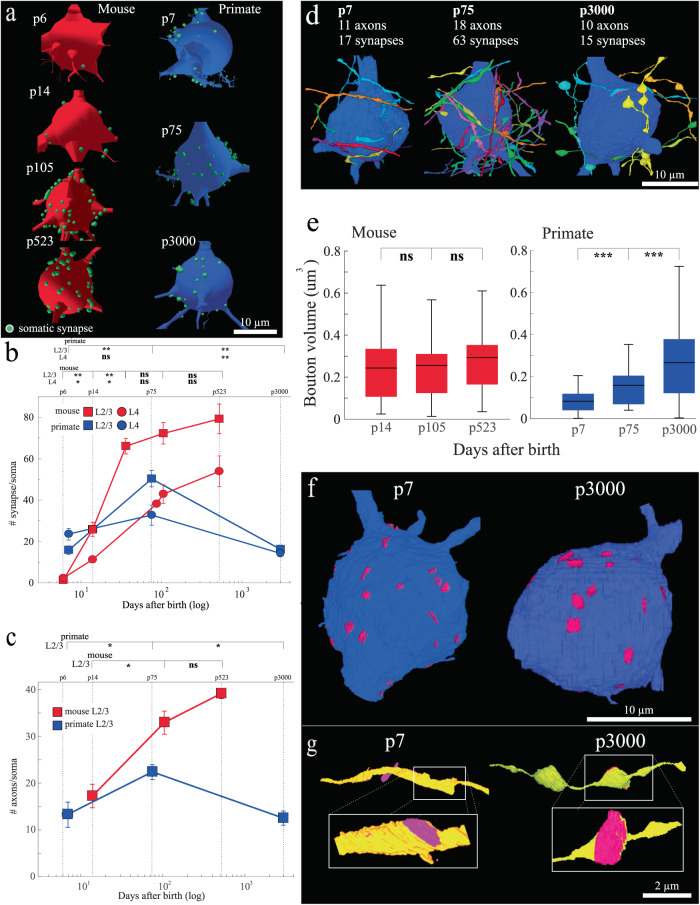
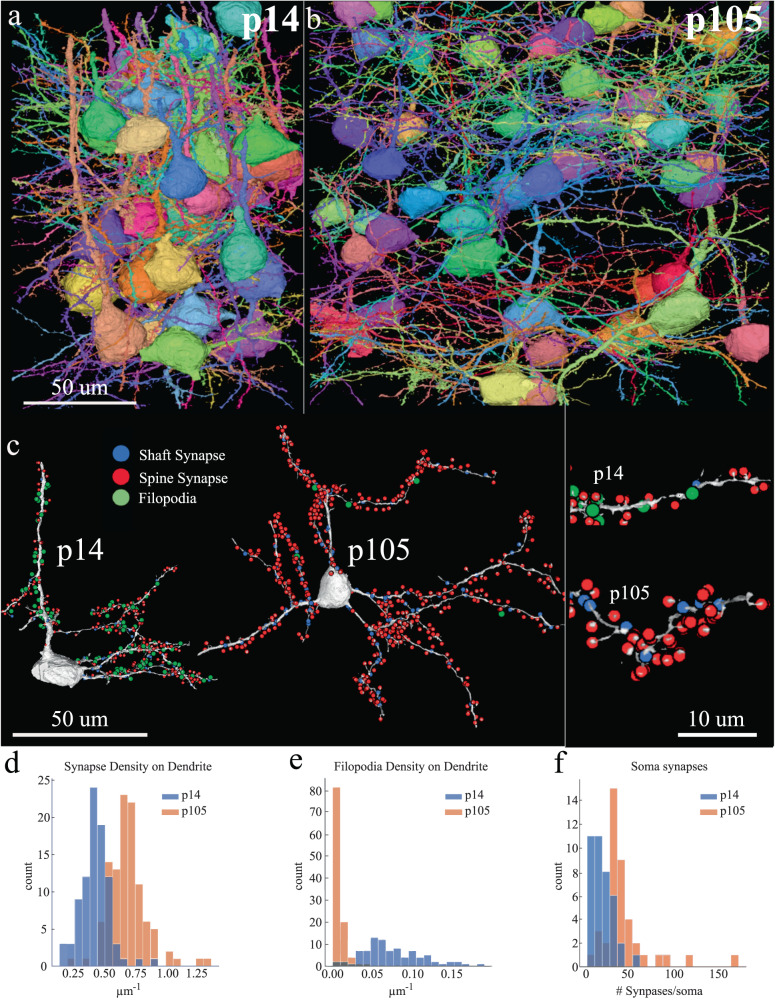
The neotenous, or delayed, development of primate neurons, particularly human ones, is thought to underlie primate-specific abilities like cognition. We tested whether synaptic development follows suit-would synapses, in absolute time, develop slower in longer-lived, highly cognitive species like non-human primates than in shorter-lived species with less human-like cognitive abilities, e.g., the mouse? Instead, we find that excitatory and inhibitory synapses in the male Mus musculus (mouse) and Rhesus macaque (primate) cortex form at similar rates, at similar times after birth. Primate excitatory and inhibitory synapses and mouse excitatory synapses also prune in such an isochronic fashion. Mouse inhibitory synapses are the lone exception, which are not pruned and instead continuously added throughout life. The monotony of synaptic development clocks across species with disparate lifespans, experiences, and cognitive abilities argues that such programs are likely orchestrated by genetic events rather than experience.


Conflict of interest statement

The authors declare no competing interests.

Figures

Fig. 1
Fig. 1. Isochronic development of excitatory synapses in primate and mouse cortex.
a Shown are representative reconstructions of V1 mouse (top, red) and primate (bottom, blue) excitatory (+) neurons at the noted postnatal (p) days. Excitatory spine synapses = orange dots, inhibitory shaft and somatic synapses = green dots. below: zoom-ins of mouse excitatory dendrites from ages p7, p14, p104, and p524, left to right. b Scatter plot of x: postnatal days after birth (log) and y: average spine synapse density in synapses/µm. Top line ∼ postnatal (p) days. Squares = L2/3, circles = L4, black = mouse S1, red = mouse V1, blue = primate V1. Right: close-up of earliest data points: p6-p14 mouse and p7 primate. c Scatter plot of x: postnatal days after birth (log) and y: average dendrite shaft synapses/µm. Top line ∼postnatal (p) days. Two-tailed Mann-Whitney U test, ns = P > 0.05, * = P < 0.05, ** = P < 0.01, *** = P < 0.001 shown for pairwise comparisons between adjacent ages in each plot. See Supplementary Table 1 for numerical summary and supplementary files for all pairwise p-values. Lines that connect datapoints in scatter plots (b, c) are for visualization purposes only and do not represent fitted curves. Scale bar = 25 µm (a, top), 5 µm (a, bottom). Mouse p36 L2/3 and p87 L4 results derived from reanalyzing publicly available dataset: https://www.microns-explorer.org/. Mouse S1 results derived from reanalyzing publicly available datasets: p9 and p14 and p60. n = 15–20, 10 µm dendrite fragments/dataset and 1 animal/dataset. Source data are provided as a Source Data file.
Fig. 2
Fig. 2. Excitatory axon development in mouse and primate.
a Cartoon depicting hypothetical models of excitatory axon development: left, axons increase their synapse frequency and/or right, axons make more branches. b, c Histograms of the number of synapses/µm and branches/µm, respectively, of excitatory axons at different ages in mouse (left) and primate (right) in V1 L2/3. Green arrows indicate the ∼mean. d Single 2D EM images and e 3D reconstructions of a representative terminal axon retraction bulbs in mouse V1, p523 (left) and primate V1, p75 (right). 3D reconstructions show individually colored mitochondria contained within the retraction bulb. f Skeleton reconstructions of mouse (red) and primate (blue) axons containing terminal retraction bulbs (asterisk) (from d) and spine (orange circle) or shaft (green circle) synapses. Insets: 2D EM images of spine and shaft synapses made by the primate (right) and mouse (bottom) axon containing a retraction bulb. Two-tailed Mann-Whitney U test, ns = P > 0.05, * = P < 0.05, ** = P < 0.01, *** = P < 0.001 shown for pairwise comparisons between adjacent ages in each plot. See Supplementary Table 2 for numerical summary and supplementary files for all pairwise p-values. Scale bar = 1 µm (d), 3 µm (f) and 300 nm (f, right and bottom insets). Source data are provided as a Source Data file.
Fig. 3
Fig. 3. Soma innervating inhibitory axons develop differently in mouse and primate.
a Representative reconstructions of mouse (left, red) and primate (right, blue) V1, L2/3 excitatory somata at the noted postnatal ages. Green dots mark the positions of all soma synapses on each neuron. b Scatter plot of x: postnatal age (log) and y: the total number of somatic synapses/soma. Blue lines = primate, red lines = mouse. Squares = L2/3, circles = L4. Top line ≈ postnatal (p) days. c Scatter plot of x: postnatal days (log) versus y: the total number of innervating axons/soma for primate (blue) and mouse (red) V1, L2/3 excitatory neurons. Top line ≈ postnatal (p) days. d Representative 3D reconstructions of excitatory soma and soma-innervating axons from primate V1 L2/3. Each reconstruction lists the postnatal age, total number of innervating axons, and total synapses found on the depicted soma. e Box plot of mouse (left, red) and primate (right, blue) V1, L2/3 soma synapse bouton volume. Black lines = mean, boxes show the interquartile range and lines/whiskers define the min/max value. f Representative 3D reconstruction of V1, L2/3 excitatory soma from p7 and p3000 primate marking PSD (pink) of each somatic synapse. g Close-up of 3D reconstruction of one soma-innervating axon from p7 and p3000 depicting the qualitative difference in PSD size. Two-tailed Mann-Whitney U test, ns = P > 0.05, * = P < 0.05, ** = P < 0.01, *** = P < 0.001 shown for pairwise comparisons between adjacent ages in each plot. See Supplementary Table 2 for numerical summary and supplementary files for all pairwise p-values. Lines that connect datapoints in scatter plots (b, c) are for visualization purposes only and do not represent fitted curves. Scale bar = 1 µm (e), 3 µm (g) and 300 nm (g insets). Source data are provided as a Source Data file.
Fig. 4
Fig. 4. Automatic segmentation of mouse V1 p14 and p105 excitatory neurons.
a, b Representative reconstructions of L4 excitatory neurons from mouse V1, p14, p105. Each neuron is uniquely colored for visual purposes. c Representative reconstruction of a single mouse V1 p14 and p105 excitatory neuron with the position of inhibitory shaft synapses (blue dots), excitatory spine synapses (red dots), and filopodia (green dots) detected using automatic segmentation. Right, zoom in of left images showing a dendrite from p14 (top) and p105 (bottom). df Histograms of mouse V1 p14 (blue) and p105 (orange) comparing distribution in the frequency of d excitatory spine synapses/µm, e filopodia/µm, and f total number of inhibitory synapses/soma. Two-tailed Mann-Whitney U test; p = 6.17e-26 (d), 4.43e-32 (e), and 2.65e-8 (f). Scale bar = 50 µm (ac, left), 10 µm (c, right). mean ± sem can be found in the Source data file. Total automatically segmented and manually proofread synapse counts for (df): mouse p14 = 6809, p105 = 13509. Source data are provided as a Source Data file.

Similar articles

Cited by

References

    1. Huttenlocher PR, Dabholkar AS. Regional differences in synaptogenesis in human cerebral cortex. J. Comp. Neurol. 1997;387:167–178. doi: 10.1002/(SICI)1096-9861(19971020)387:2<167::AID-CNE1>3.0.CO;2-Z. - DOI - PubMed
    1. Gould, S. J. Ontogeny and Phylogeny (Harvard University Press, 1977).
    1. Somel M, et al. Transcriptional neoteny in the human brain. Proc. Natl Acad. Sci. USA. 2009;106:5743–5748. doi: 10.1073/pnas.0900544106. - DOI - PMC - PubMed
    1. Stepien, B. K., Vaid, S. & Huttner, W. B. Length of the neurogenic period—a key determinant for the generation of upper-layer neurons during neocortex development and evolution. Front. Cell Dev. Biol.9, 676911 (2021). - PMC - PubMed
    1. Finlay BL, Darlington RB. Linked regularities in the development and evolution of mammalian brains. Science. 1995;268:1578–1584. doi: 10.1126/science.7777856. - DOI - PubMed

Publication types