. 2023 Dec 4;13(1):21335.
doi: 10.1038/s41598-023-48107-3.

Making sense of chemical space network shows signs of criticality

Affiliations

Making sense of chemical space network shows signs of criticality

Nicola Amoroso et al. Sci Rep. .

Abstract

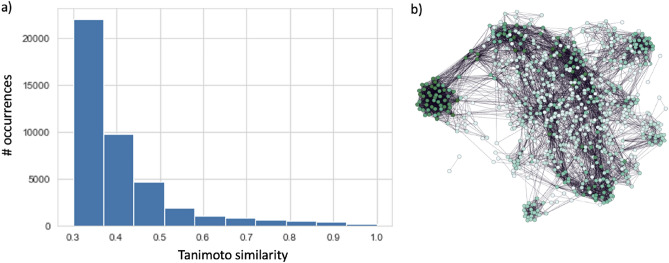
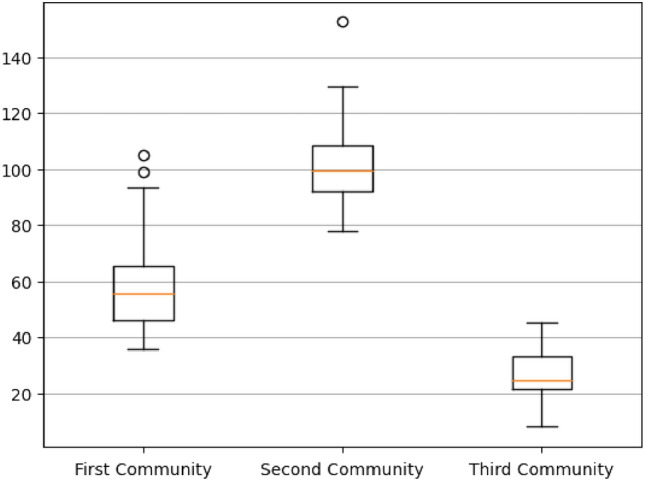
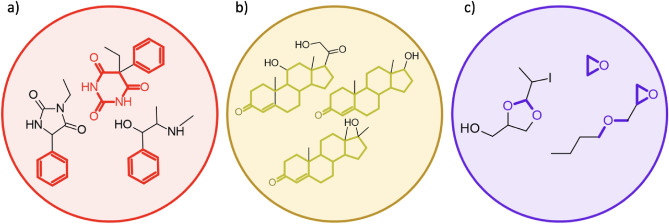
Chemical space modelling has great importance in unveiling and visualising latent information, which is critical in predictive toxicology related to drug discovery process. While the use of traditional molecular descriptors and fingerprints may suffer from the so-called curse of dimensionality, complex networks are devoid of the typical drawbacks of coordinate-based representations. Herein, we use chemical space networks (CSNs) to analyse the case of the developmental toxicity (Dev Tox), which remains a challenging endpoint for the difficulty of gathering enough reliable data despite very important for the protection of the maternal and child health. Our study proved that the Dev Tox CSN has a complex non-random organisation and can thus provide a wealth of meaningful information also for predictive purposes. At a phase transition, chemical similarities highlight well-established toxicophores, such as aryl derivatives, mostly neurotoxic hydantoins, barbiturates and amino alcohols, steroids, and volatile organic compounds ether-like chemicals, which are strongly suspected of the Dev Tox onset and can thus be employed as effective alerts for prioritising chemicals before testing.


Conflict of interest statement

The authors declare no competing interests.

Figures

Figure 1
Figure 1
Similarity distribution of Tanimoto values (a). Chemical space network (b).
Figure 2
Figure 2
Centrality metrics as a function of the Tanimoto similarity for both (a) CSN and (b) ER networks. Betweenness is represented in black diamonds, degree with blue crosses and eigenvector centrality with red triangles. Centrality measures are scaled in the [0,1] interval for ease of comparison.
Figure 3
Figure 3
Giant component phase transition. The percentage of nodes within the giant component (black crosses) and the normalised assortativity (blue points) are shown as functions of connection probability.
Figure 4
Figure 4
CSN at criticality: the largest 8 communities are outlined with different colours. The network nodes at criticality are basically scattered among several communities, the first 30 communities are shown here. The panel confirms that at criticality the fraction of isolated nodes is reasonable while the partition quality, in terms of modularity, reaches more than satisfactory levels.
Figure 5
Figure 5
The boxplot shows the variability range for the molecular refractivity within the top three populated communities.
Figure 6
Figure 6
The most representative chemical structures of the three top communities: (a) aryl derivatives mainly comprising barbiturates and amino alcohols; (b) cyclopentanoperhydrophenanthrene cores typical of the steroid lipid family; (c) small Volatile Organic Compounds (VOCs) ether-like chemicals.
Figure 7
Figure 7
Classification metrics for CSN predictive power as a function of the Tanimoto similarity. At the preferred Tanimoto similarity threshold of ~ 0.7, the model achieves a good overall accuracy (~ 80%) with great sensitivity (> 90%) but poor specificity (~ 25%).

References

    1. Maggiora GM, Bajorath J. Chemical space networks: A powerful new paradigm for the description of chemical space. J. Comput. Aided Mol. Des. 2014;28:795–802. doi: 10.1007/s10822-014-9760-0. - DOI - PubMed
    1. Vogt M, Stumpfe D, Maggiora GM, Bajorath J. Lessons learned from the design of chemical space networks and opportunities for new applications. J. Comput. Aided Mol. Des. 2016;30:191–208. doi: 10.1007/s10822-016-9906-3. - DOI - PubMed
    1. Scalfani VF, Patel VD, Fernandez AM. Visualizing chemical space networks with RDKit and NetworkX. J. Cheminform. 2022;14:87. doi: 10.1186/s13321-022-00664-x. - DOI - PMC - PubMed
    1. Recanatini M, Cabrelle C. Drug research meets network science: Where are we? J. Med. Chem. 2020;63:8653–8666. doi: 10.1021/acs.jmedchem.9b01989. - DOI - PMC - PubMed
    1. Kunimoto R, Bajorath J. Combining similarity searching and network analysis for the identification of active compounds. ACS Omega. 2018;3:3768–3777. doi: 10.1021/acsomega.8b00344. - DOI - PMC - PubMed