. 2024 Jan;43(5):363-377.
doi: 10.1038/s41388-023-02897-y. Epub 2023 Dec 4.

MYCN and SNRPD3 cooperate to maintain a balance of alternative splicing events that drives neuroblastoma progression

Affiliations

MYCN and SNRPD3 cooperate to maintain a balance of alternative splicing events that drives neuroblastoma progression

Alice Salib et al. Oncogene. 2024 Jan.

Abstract

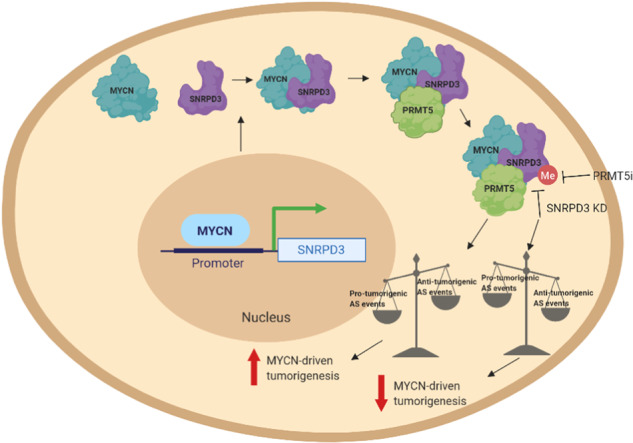
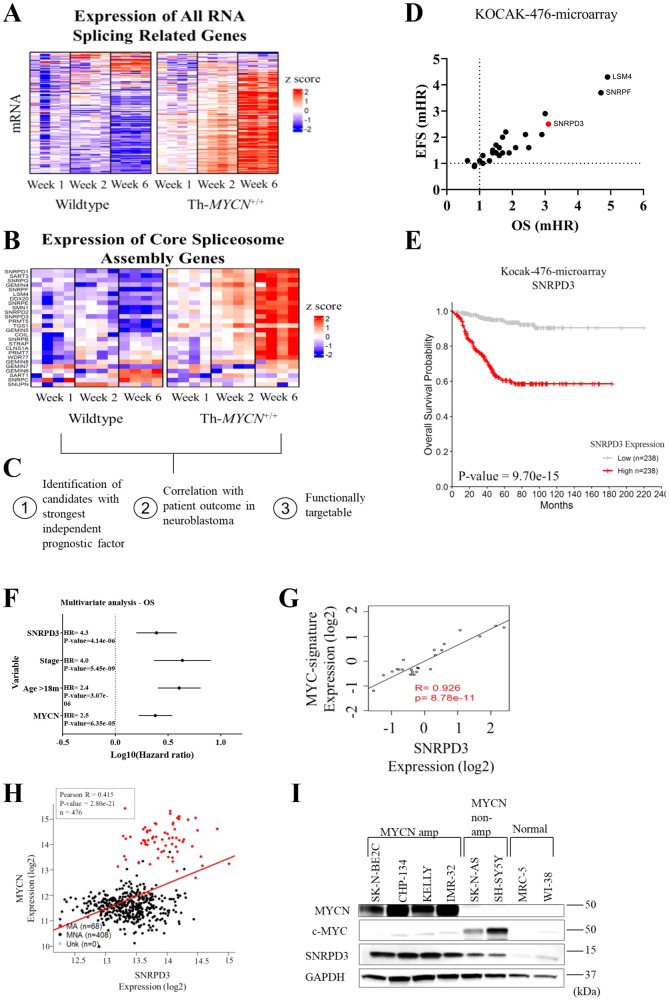
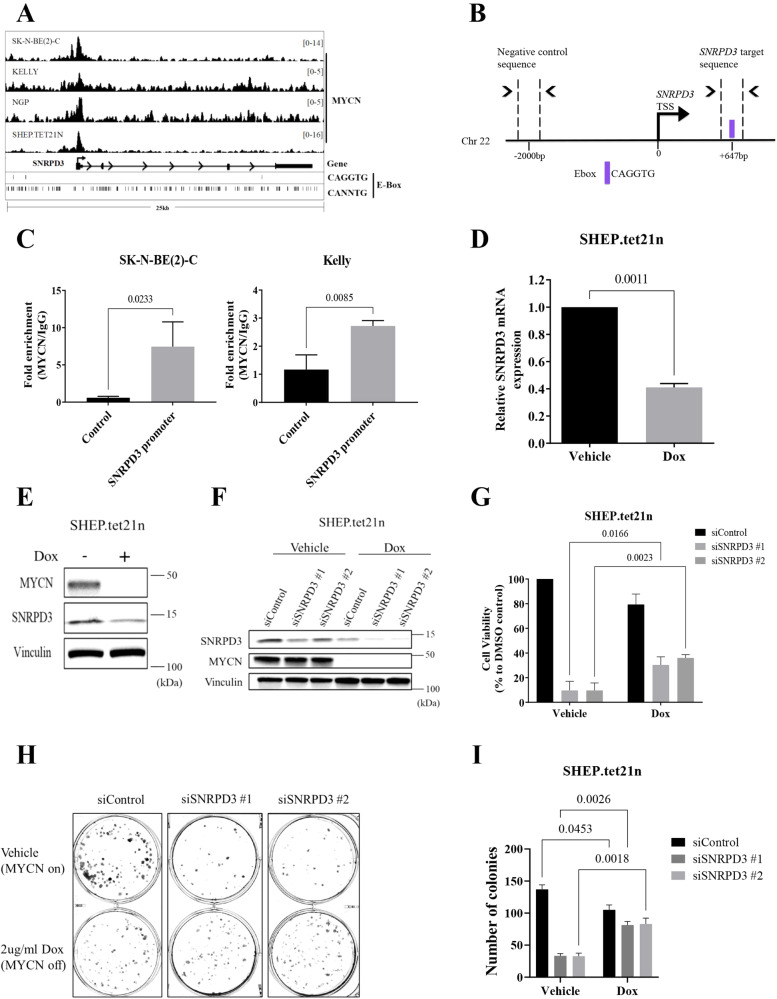
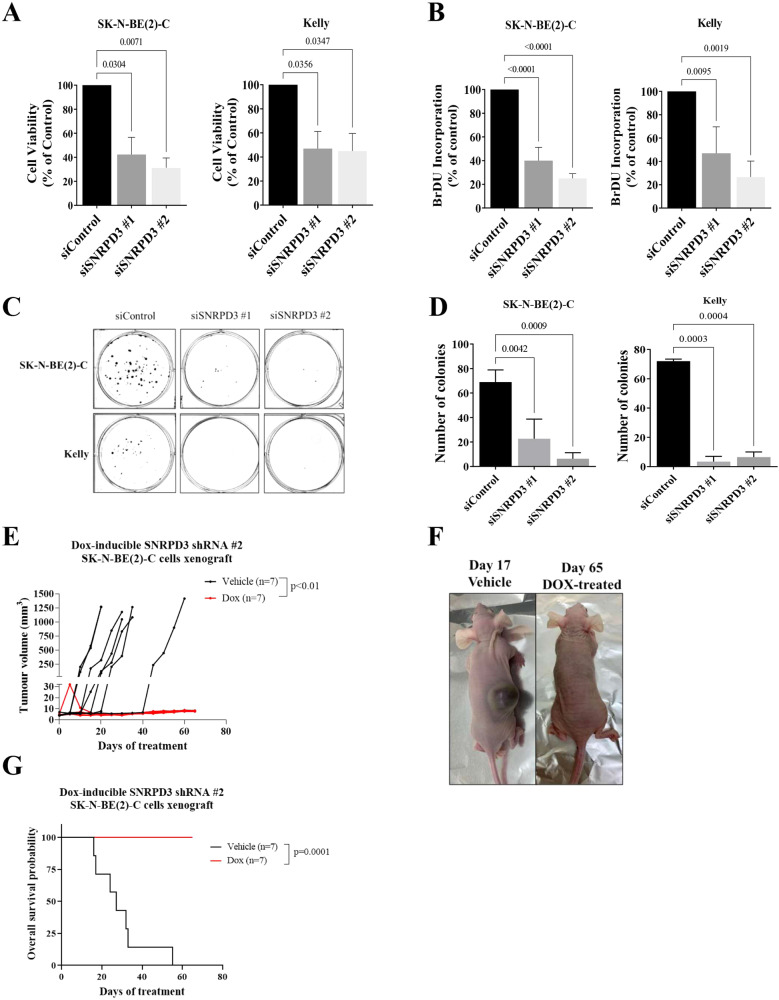
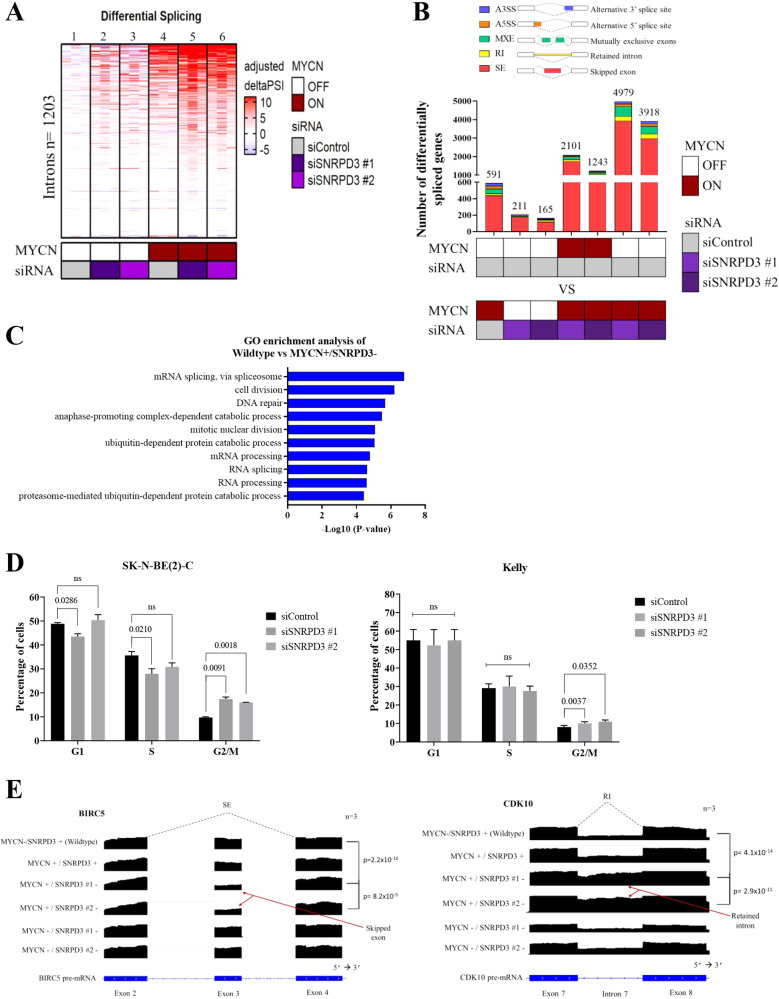
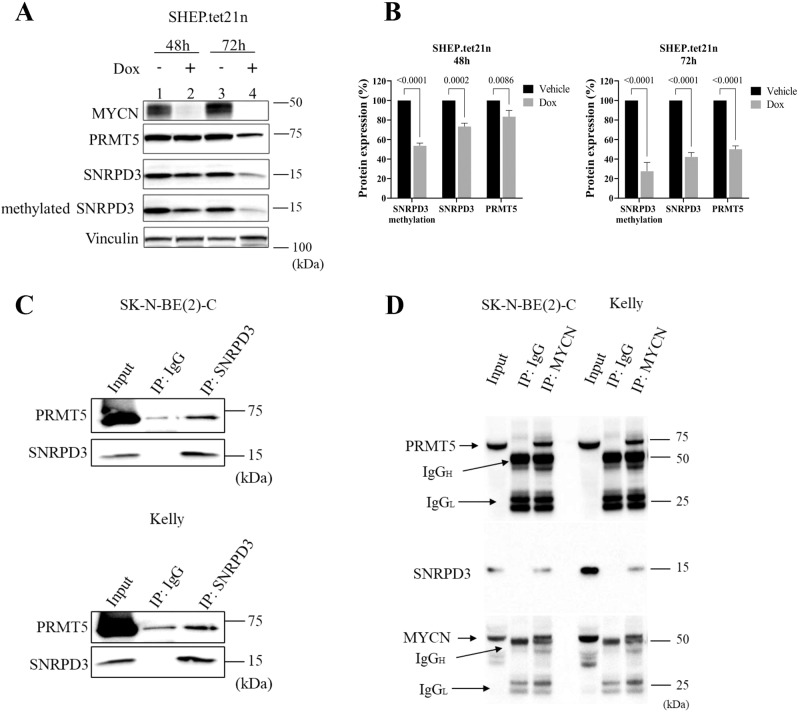
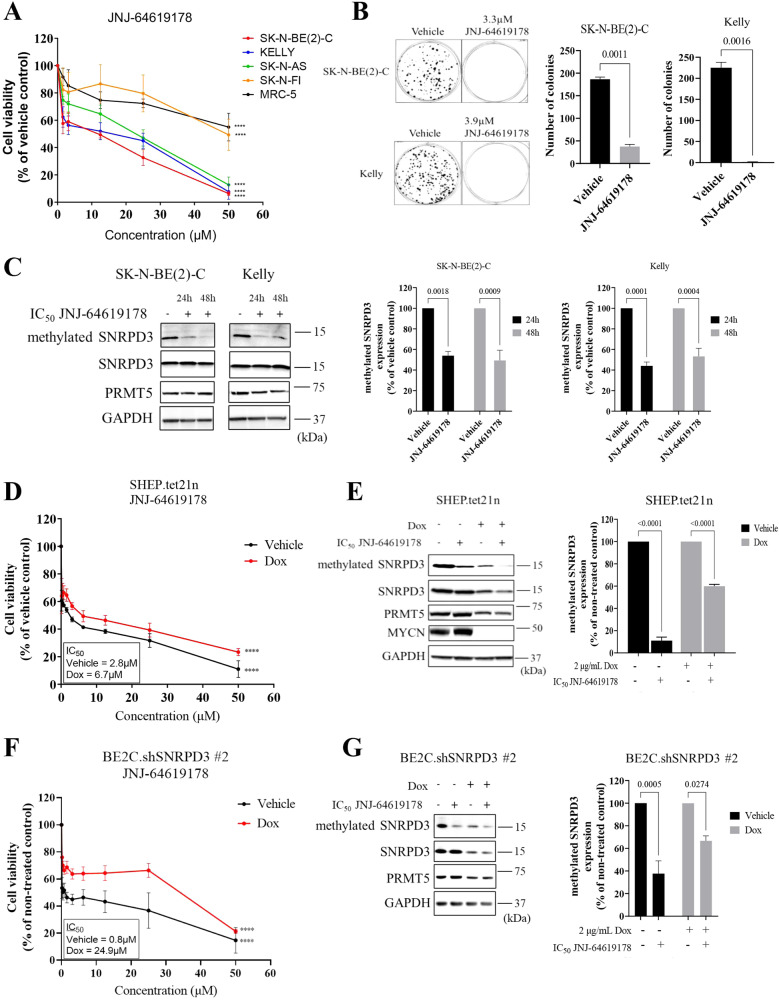
Many of the pro-tumorigenic functions of the oncogene MYCN are attributed to its regulation of global gene expression programs. Alternative splicing is another important regulator of gene expression and has been implicated in neuroblastoma development, however, the molecular mechanisms remain unknown. We found that MYCN up-regulated the expression of the core spliceosomal protein, SNRPD3, in models of neuroblastoma initiation and progression. High mRNA expression of SNRPD3 in human neuroblastoma tissues was a strong, independent prognostic factor for poor patient outcome. Repression of SNRPD3 expression correlated with loss of colony formation in vitro and reduced tumorigenicity in vivo. The effect of SNRPD3 on cell viability was in part dependent on MYCN as an oncogenic co-factor. RNA-sequencing revealed a global increase in the number of genes being differentially spliced when MYCN was overexpressed. Surprisingly, depletion of SNRPD3 in the presence of overexpressed MYCN further increased differential splicing, particularly of cell cycle regulators, such as BIRC5 and CDK10. MYCN directly bound SNRPD3, and the protein arginine methyltransferase, PRMT5, consequently increasing SNRPD3 methylation. Indeed, the PRMT5 inhibitor, JNJ-64619178, reduced cell viability and SNRPD3 methylation in neuroblastoma cells with high SNRPD3 and MYCN expression. Our findings demonstrate a functional relationship between MYCN and SNRPD3, which maintains the fidelity of MYCN-driven alternative splicing in the narrow range required for neuroblastoma cell growth. SNRPD3 methylation and its protein-protein interface with MYCN represent novel therapeutic targets. Hypothetical model for SNRPD3 as a co-factor for MYCN oncogenesis. SNRPD3 and MYCN participate in a regulatory loop to balance splicing fidelity in neuroblastoma cells. First MYCN transactivates SNRPD3 to lead to high-level expression. Second, SNRPD3 and MYCN form a protein complex involving PRMT5. Third, this leads to balanced alterative splicing (AS) activitiy that is favorable to neuroblastoma. Together this forms as a therapeutic vulnerability where SNRPD3 perturbation or PRMT5 inhibitors are selectively toxic to neuroblastoma by conditionally disturbing splicing activity.


Conflict of interest statement

The authors declare no competing interests.

Figures

None
Hypothetical model for SNRPD3 as a co-factor for MYCN oncogenesis. SNRPD3 and MYCN participate in a regulatory loop to balance splicing fidelity in neuroblastoma cells. First MYCN transactivates SNRPD3 to lead to high-level expression. Second, SNRPD3 and MYCN form a protein complex involving PRMT5. Third, this leads to balanced alterative splicing (AS) activitiy that is favorable to neuroblastoma. Together this forms as a therapeutic vulnerability where SNRPD3 perturbation or PRMT5 inhibitors are selectively toxic to neuroblastoma by conditionally disturbing splicing activity.
Fig. 1
Fig. 1. Some core snRNP assembly genes are up-regulated in neuroblastoma and are prognostic for patient outcomes.
A heat map of a mRNA microarray analysis on ganglia cells collected from transgenic Th-MYCN + /+ and wildtype mice at 1, 2, and 6 weeks of age assessing the expression of (A) all RNA splicing-related genes, or (B) the core spliceosome assembly genes. C All 26 core spliceosome assembly genes (as defined by the GO term, GO:0000387) were assessed based on the three given criteria to identify possible candidate genes. D Overall (OS) and event-free survival (EFS) multivariate CoxPH analysis using the Kocak (n = 476) neuroblastoma patient cohort was conducted on the core spliceosome assembly genes (as defined by the GO term, GO:0000387). The dot plot represents the median hazard ratios (mHR) from the CoxPH models for each gene regarding EFS and OS. E Kaplan–Meier OS curve obtained from Kocak neuroblastoma patient cohort (n = 476) dichotomised on median SNRPD3 expression. F OS multivariate CoxPH analysis on Kocak cohort (n = 649) with SNRPD3 gene expression against classic neuroblastoma prognostic factors, dots represent the median HR (hazard ratio) whilst lines represent the 95% confidence interval. G Scatter plot with a linear regression fit of mRNA expression levels from the Th-MYCN+/+ mouse tissues for MYC-signature vs SNRPD3 gene expression (6 weeks of age, microarray, log2). H Scatter plot with linear regression fit for the Kocak neuroblastoma patient cohort for MYCN vs SNRPD3 gene expression (mRNA microarray, log2 expression). I Western blot analysis for SNRPD3, cMYC and MYCN expression in a range of MYCN-amplified (SK-N-BE(2)-C, CHP-134, KELLY, IMR-32), MYCN non-amplified (SK-N-AS, SH-SY5Y), and normal lung fibroblasts (MRC-5, WI-38) cells. GAPDH is a protein loading control. Western blot is a representative image of n = 3 independent experiments.
Fig. 2
Fig. 2. MYCN regulates the expression of the SNRPD3 gene in neuroblastoma cells.
A ChIP-sequencing traces from publicly available databases [3] for MYCN binding the SNRPD3 gene in a panel of MYCN expressing neuroblastoma cells detailing MYCN binding motifs at canonical (CACGTG) and non-canonical (CANNTG) E-boxes B Schematic representation of the SNRPD3 target sequence (+647 bp from SNRPD3 TSS) and negative control target sequence (−2000 bp from SNRPD3 TSS) used for quantitative real time PCR (QPCR) following chromatin-immunoprecipitation (ChIP), detailing the MYCN peak summit and its distance from TSS. C ChIP-qPCR assay for the negative control region or the SNRPD3 promoter containing the MYCN binding site in SK-N-BE(2)-C and KELLY cells. Results represent n = 3 independent biological replicates, mean ± SEM. P-values were determined by two-tailed t test comparing control against SNRPD3 promoter. D SNRPD3 mRNA and E protein expression measured in SHEP.tet21n cells treated with doxycycline (Dox; MYCN off) or without Dox (Vehicle; MYCN on). Results represent n = 3 independent biological replicates, mean ± SEM, where P values were determined by two-tailed t test comparing vehicle against Dox. F A representative immunoblot of MYCN and SNRPD3 expression in SHEP.tet21n cells treated with either vehicle or Dox following SNRPD3 siRNA knockdown. G Cell viability was measured 72 h after SHEP.tet21n cells treated with either vehicle (DMSO) or Dox were transfected with control siRNA, or the two SNRPD3 siRNAs. Results represent n = 3 independent biological replicates, mean ± SEM, where the P value was determined through a two-way ANOVA, with Tukey’s multiple comparison tests. H SHEP.tet21n cells treated with either vehicle or Dox were transfected with control siRNA or the two SNRPD3 siRNAs for 10 days, followed by colony formation assays. Differences in colony formation were compared to siControl and I number of colonies quantified. Results represent n = 3 independent biological replicates, mean ± SEM, where the P value was determined through a two-way ANOVA, with Tukey’s multiple comparison tests.
Fig. 3
Fig. 3. SNRPD3 is required for the growth and proliferation of MYCN-amplified neuroblastoma cells.
SK-N-BE(2)-C and KELLY cells were transfected with siRNAs targeted against SNRPD3 or a control siRNA for 72 h, then subjected to (A) cell viability and (B) cell proliferation measurements. Differences in cell viability and proliferation were compared with siControl. C SK-N-BE(2)-C and KELLY cells were transfected with siRNAs targeting SNRPD3 or a control siRNA for 10 days (SK-N-BE(2)-C) or 14 days (KELLY), followed by colony formation assays. Differences in colony formation were compared to siControl and (D) the number of colonies were quantified. This is a representative image of three biologically independent experiments (n = 3), mean ± SEM, where the P value was determined through a one-way ANOVA, with Dunnett multiple comparison testing. SK-N-BE(2)-C cells expressing SNRPD3 shRNA (shSNRPD3) were xenografted into immunodeficient nude mice. Once tumours reached 4−5 mm, mice were divided into DOX (2 mg/mL doxycycline) or vehicle (water containing 5% sucrose) control (Vehicle) subgroups. E Tumour volume was measured (n = 7 mice per treatment group) from day 0 post-treatment until the tumour reached ≥1000 mm3 or a maximum holding time of 12 weeks. The effect of DOX on tumour progression was evaluated using a two-way ANOVA. F Representative photos of either vehicle- (day 17 post treatment) or DOX-treated (day 65 post treatment) mice. G Kaplan–Meier survival curves showed the probability of overall survival of the mice (n = 7 mice per treatment group). A log rank test was used to obtain p-value. All results represent n = 3 independent biological replicates, mean ± SEM, where the P value was determined through a one-way ANOVA, with Dunnett multiple comparison testing, unless stated otherwise.
Fig. 4
Fig. 4. SNRPD3 alters the splicing of cell cycle genes in a MYCN-dependant manner.
A Heat map showing leafcutter analysis of differential splicing from SHEP.tet21n cells, treated with (to repress MYCN) or without Dox (to induce MYCN), followed by depletion of SNRPD3 with two siRNAs or a control siRNA (siControl). Leafcutter calculated the delta PSI (percentage spliced in) of the n = 1203 introns that were found to be differentially spliced in at least 1 pair of samples using MYCN OFF/siControl condition (lane 1) as a reference. B The number of significant differentially spliced genes as determined by rMATS analysis in SHEP.tet21n cells treated with (MYCN off) or without (MYCN on) Dox and transfected with either control or SNRPD3 siRNA. Skipped exon (SE), Retained intron (RI), Mutually exclusive exon (MXE), Alternative 5’ splice site (A5SS), Alternative 3’ splice site (A3SS). C Gene ontology showing enriched pathways in SHEP.tet21n cells treated with Dox (to repress MYCN) and transfected with control siRNA (wildtype; MYCN-/SNRPD3 + ) compared to SHEP.tet21n cells treated without Dox (to induce MYCN) and transfected with SNRPD3 siRNA (MYCN + /SNRPD3-). D Flow cytometry analysis of cell cycle distribution in SK-N-BE(2)-C and KELLY cells transfected with SNRPD3 siRNAs for 72 h followed by propidium iodide (PI) treatment. P-values were determined by two-sided t test comparing control siRNA against siSNRPD3 #1 or siSNRPD3 #2. E RNA-seq coverage plots for BIRC5 and CDK10 and the corresponding alternative splicing event. Arrows point to which exon is skipped or which intron is retained. Skipped exon (SE), Retained intron (RI). All results represent n = 3 independent biological replicates.
Fig. 5
Fig. 5. MYCN, SNRPD3 and PRMT5 form a protein complex to enhance SNRPD3 methylation.
A Representative western blot of MYCN, PRMT5, SNRPD3 and SNRPD3 protein arginine methylation (methylated SNRPD3) expression in SHEP.tet21n cells following treatment with either vehicle or Dox at 48 and 72 h. B Densitometry analysis of SNRPD3 protein arginine methylation, PRMT5 and SNRPD3 protein expression in SHEP.tet21n cells following treatment with either vehicle or Dox at 48 and 72 h. C Representative western blot for endogenous PRMT5 and SNRPD3 after immunoprecipitation of SNRPD3 from SK-N-BE(2)-C and KELLY cells. Five percent of the cell lysate was loaded as input. D Representative western blot for endogenous SNRPD3, PRMT5 and MYCN after immunoprecipitation of MYCN from SK-N-BE(2)-C or KELLY cells. Five percent of the cell lysate was loaded as input. All results represent n = 3 independent biological replicates, mean ± SEM, where the P value was determined through a two-way ANOVA, with Tukey’s multiple comparison tests.
Fig. 6
Fig. 6. Chemical inhibition of PRMT5 has selective toxicity for neuroblastoma cells compared to normal myofibroblast cells.
A Cell viability measured 72 h after SK-N-BE(2)-C, KELLY, SH-SY5Y, SK-N-FI, and MRC-5 cells were treated with increasing concentrations (0–50 µM) of the PRMT5 inhibitor, JNJ-64619178. B SK-N-BE(2)-C and KELLY cells were treated with IC50 concentrations of JNJ-64619178 for 10 days (SK-N-BE(2)-C) or 14 days (KELLY), followed by colony formation assays. Quantification of colony forming assays was based on colony numbers. Differences in colony formation were compared to the vehicle control. All results represent n = 3 independent biological replicates, mean ± SEM, where the P value was determined through a one-way ANOVA, with Dunnett multiple comparison testing. C Representative western blot of SNRPD3 protein arginine methylation (methylated SNRPD3), SNRPD3, and PRMT5 expression following treatment with IC50 concentration of JNJ-64619178 in SK-N-BE(2)-C and KELLY cells for 24 and 48 h, followed by densitometry analysis, where difference in protein expression was compared to vehicle control. D Cell viability was measured 72 h after vehicle or Dox treated SHEP.tet21n cells were treated with increasing concentrations (0–50 µM) of JNJ-64619178. E Representative western blot of SNRPD3 protein arginine methylation, SNRPD3, PRMT5, and MYCN expression following treatment of vehicle or Dox treated SHEP.tet21n cells with IC50 concentrations of JNJ-64619178 for 24 h, followed by densitometric analysis of protein expression compared to vehicle control. F Cell viability was measured 72 h after vehicle or Dox treated BE(2)-C.shSNRPD3 #2 cells were treated with increasing concentrations (0–50 µM) of JNJ-64619178. G Representative western blot of SNRPD3 protein arginine methylation, SNRPD3, and PRMT5 expression following treatment of vehicle or Dox treated BE2C.shSNRPD3 #2 cells with IC50 concentrations of JNJ-64619178 for 24 h, followed by densitometry analysis of protein expression compared to vehicle control. Two-way ANOVA statistical test was performed for each concentration compared back to no drug control (at 0 μM) (****p < 0.0001). All results represent n = 3 independent biological replicates, mean ± SEM, where the P value was determined through a two-way ANOVA, with Tukey’s multiple comparison tests, unless stated otherwise.

References

    1. Pinto NR, Applebaum MA, Volchenboum SL, Matthay KK, London WB, Ambros PF, et al. Advances in risk classification and treatment strategies for neuroblastoma. J Clin Oncol. 2015;33:3008. doi: 10.1200/JCO.2014.59.4648. - DOI - PMC - PubMed
    1. Gustafson WC, Meyerowitz JG, Nekritz EA, Chen J, Benes C, Charron E, et al. Drugging MYCN through an allosteric transition in Aurora kinase A. Cancer cell. 2014;26:414–27. doi: 10.1016/j.ccr.2014.07.015. - DOI - PMC - PubMed
    1. Zeid R, Lawlor MA, Poon E, Reyes JM, Fulciniti M, Lopez MA, et al. Enhancer invasion shapes MYCN-dependent transcriptional amplification in neuroblastoma. Nat Genet. 2018;50:515–23. doi: 10.1038/s41588-018-0044-9. - DOI - PMC - PubMed
    1. Eilers M, Eisenman RN. Myc’s broad reach. Genes Dev. 2008;22:2755–66. doi: 10.1101/gad.1712408. - DOI - PMC - PubMed
    1. Huang M, Weiss WA. Neuroblastoma and MYCN. Cold Spring Harb Perspect Med. 2013;3:a014415. doi: 10.1101/cshperspect.a014415. - DOI - PMC - PubMed

Publication types

MeSH terms

Associated data