. 2023 Dec;30(12):1958-1969.
doi: 10.1038/s41594-023-01159-5. Epub 2023 Dec 4.

Rational optimization of a transcription factor activation domain inhibitor

Affiliations

Rational optimization of a transcription factor activation domain inhibitor

Shaon Basu et al. Nat Struct Mol Biol. 2023 Dec.

Abstract

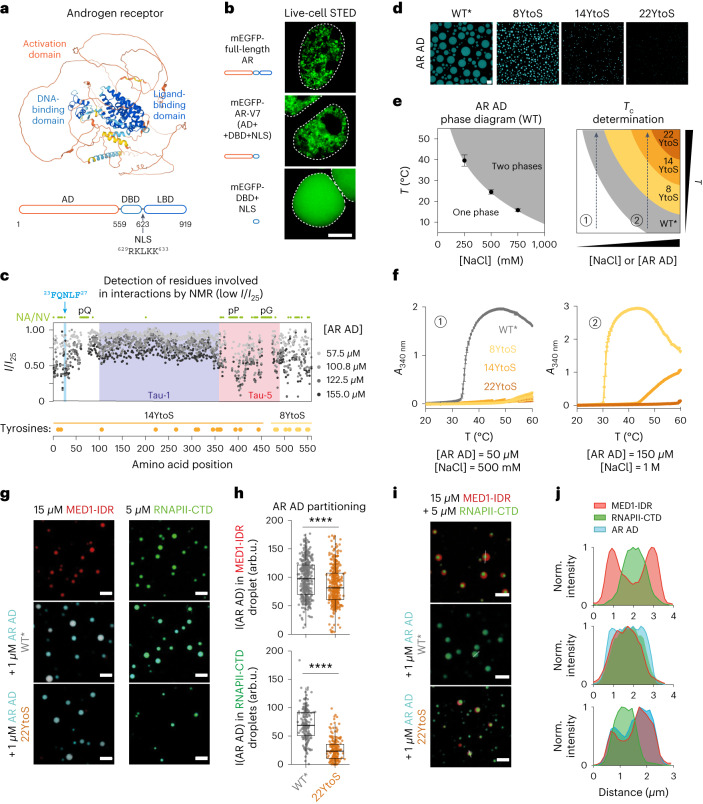
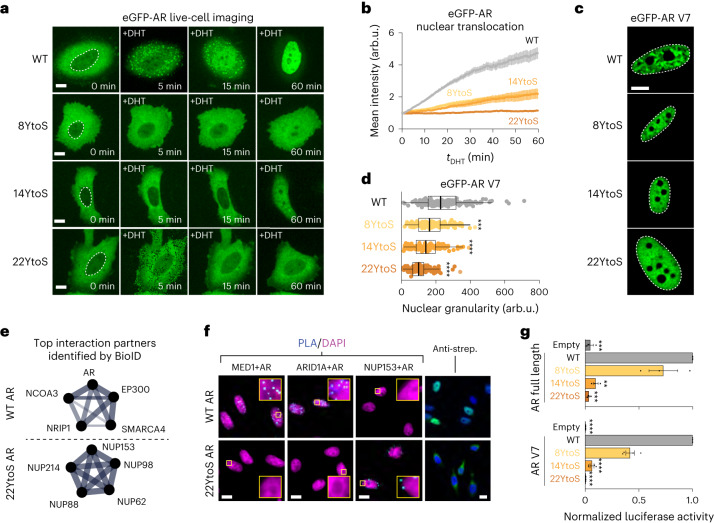
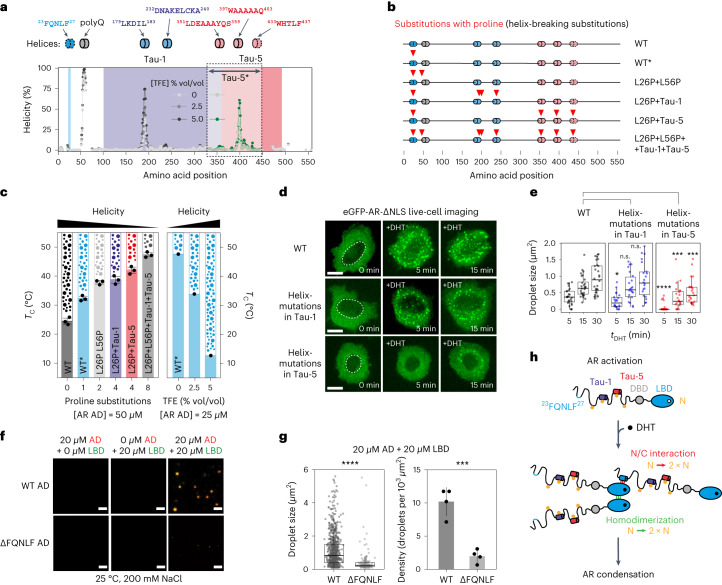
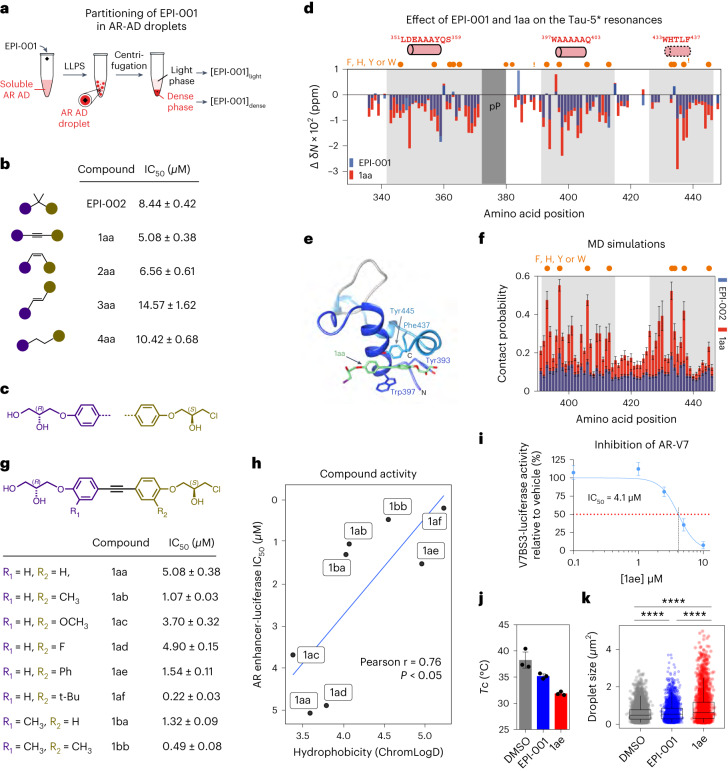
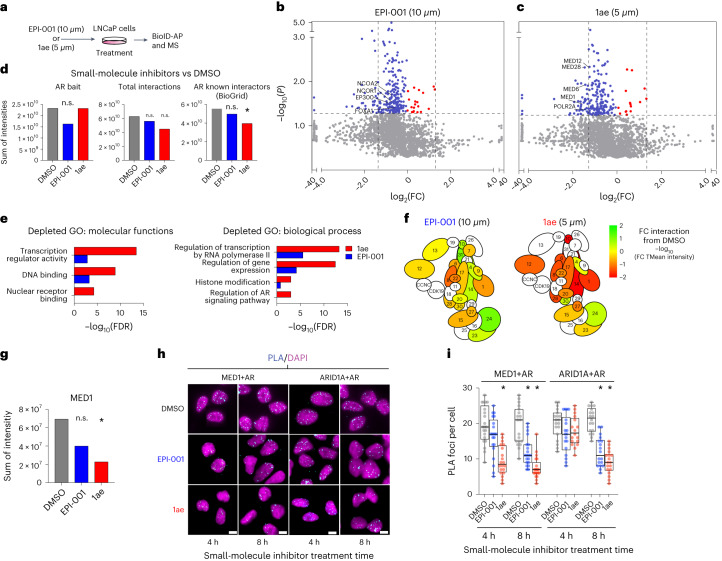
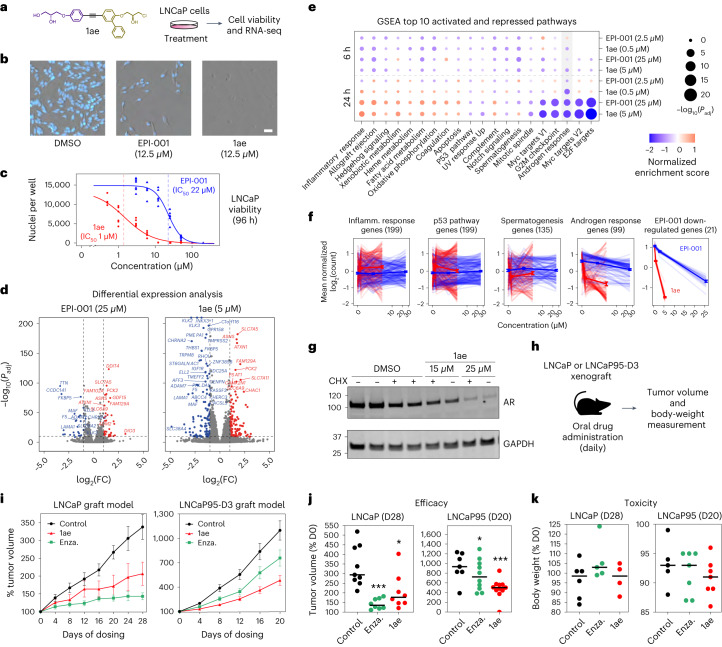
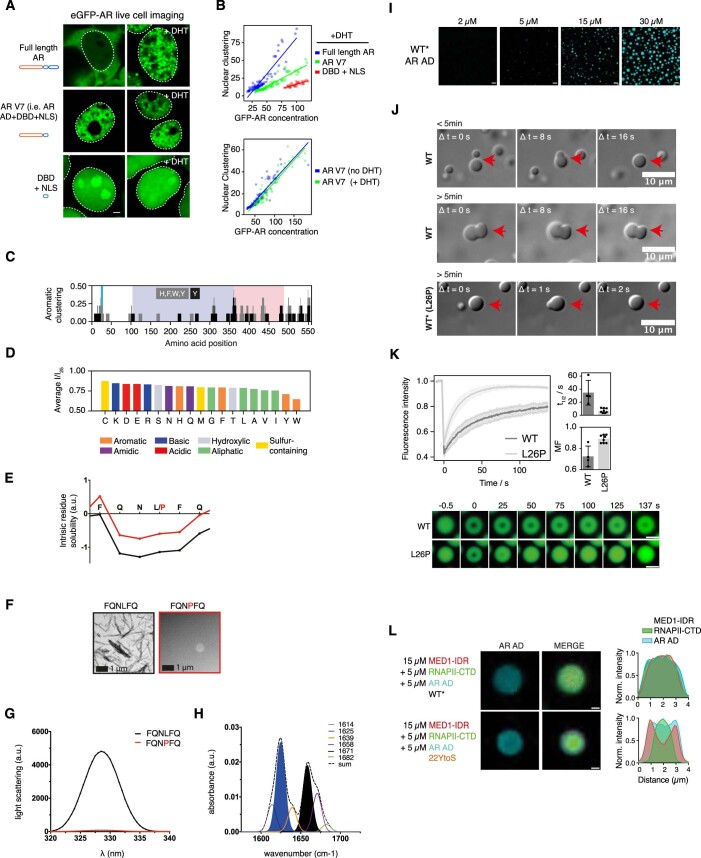
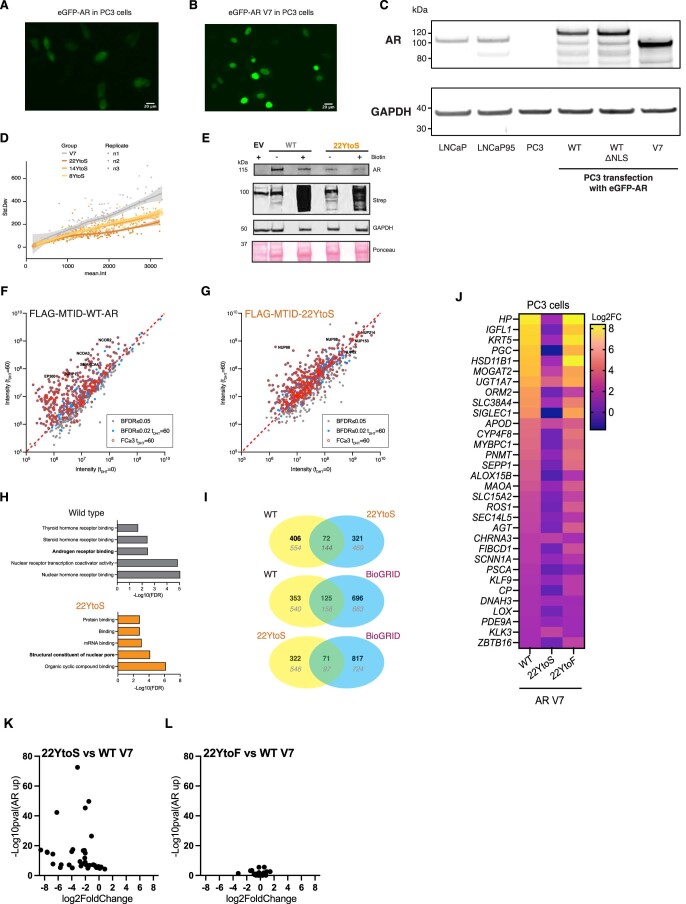
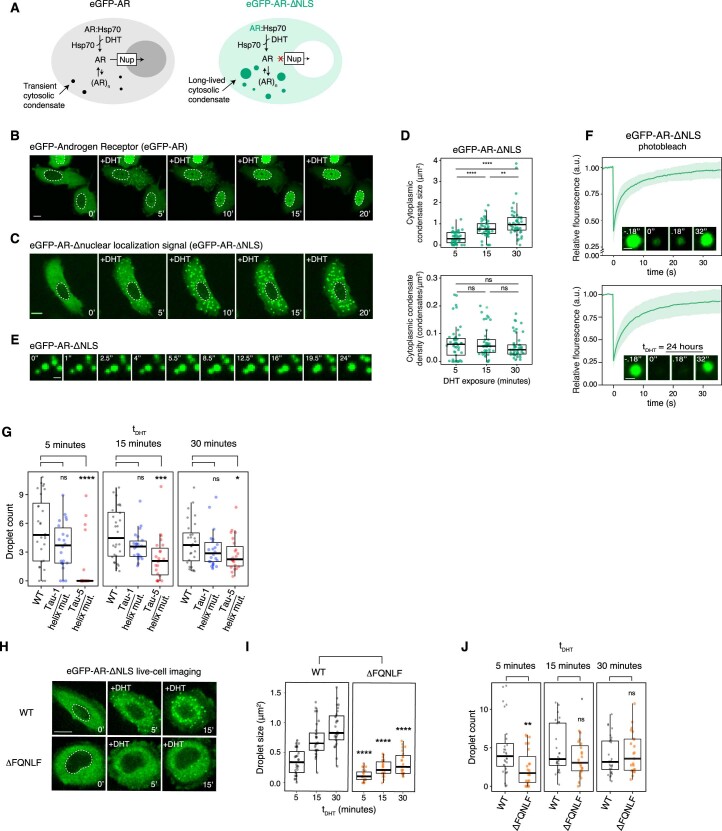
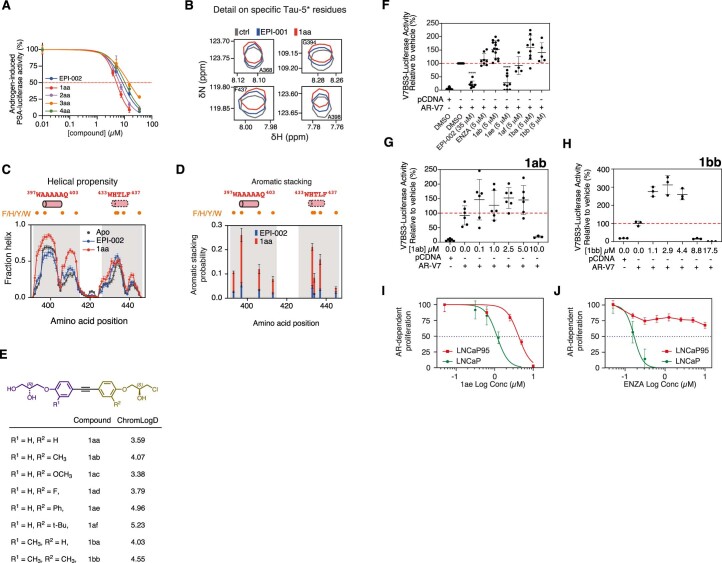
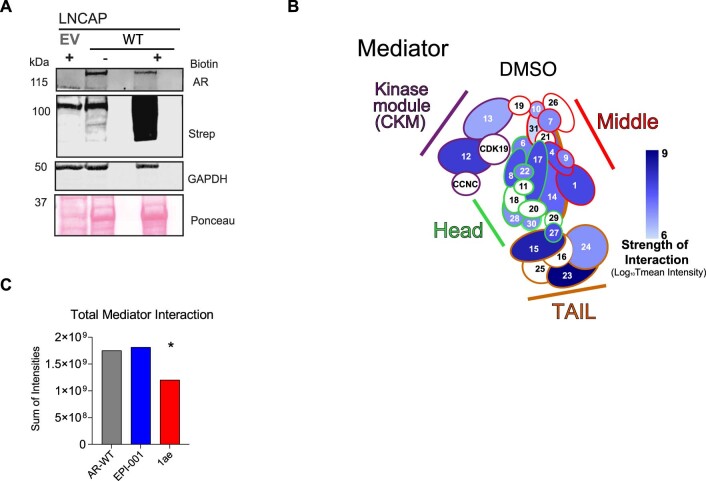
Transcription factors are among the most attractive therapeutic targets but are considered largely 'undruggable' in part due to the intrinsically disordered nature of their activation domains. Here we show that the aromatic character of the activation domain of the androgen receptor, a therapeutic target for castration-resistant prostate cancer, is key for its activity as transcription factor, allowing it to translocate to the nucleus and partition into transcriptional condensates upon activation by androgens. On the basis of our understanding of the interactions stabilizing such condensates and of the structure that the domain adopts upon condensation, we optimized the structure of a small-molecule inhibitor previously identified by phenotypic screening. The optimized compounds had more affinity for their target, inhibited androgen-receptor-dependent transcriptional programs, and had an antitumorigenic effect in models of castration-resistant prostate cancer in cells and in vivo. These results suggest that it is possible to rationally optimize, and potentially even to design, small molecules that target the activation domains of oncogenic transcription factors.


Conflict of interest statement

M.F.-V. is an employee of Dewpoint Therapeutics. M.P., M.L., L.Z., H.D. and M.B. are employees of Nuage Therapeutics. M.B., D.H. and X.S. are founders of Nuage Therapeutics. D.H. and X.S. are scientific advisors of Nuage Therapeutics. The remaining authors declare no competing interests.

Figures

Fig. 1
Fig. 1. AR phase separation is driven by tyrosine residues in the AD.
a, Predicted structure of AR, colored by structure-prediction confidence from high (blue) to low (yellow). The domains and the native NLS are highlighted. b, Live-cell STED imaging of representative (n > 3) HEK293T cells transfected with AR constructs tagged with mEGFP. Cells were imaged after treatment with 10 nM DHT for 4 h. Scale bar, 5 μm. The dashed line indicates the nuclear periphery. c, Intensity of AR AD NMR resonances at different concentrations, relative to the intensity at 25 μM. The positions of Tau-1, Tau-5 and 23FQNLF27 are highlighted. Green circles indicate residues that were not visible (NV) or not assigned (NA), including residues in polyglutamine (pQ), polyproline (pP) and polyglycine (pG) tracts. Yellow and orange circles represent the positions of tyrosine residues substituted by serines in 8YtoS and 14YtoS; all tyrosine residues were substituted in 22YtoS. d, Fluorescence microscopy images of 40 µM AR-AD droplets (WT* and mutants) at 1 M NaCl. Scale bar, 10 μm. e, Scheme of the phase diagram of the AR AD and of how Tc measurements at different solution conditions allow the phase separation capacity of the mutants to be ranked. f, Tc measurements of AR AD (WT* and the tyrosine to serine mutants), as mean ± s.d. of three independent samples, at two different solution conditions. g, Representative merged confocal images of 15 µM MED1-IDR and 5 µM RNAPII-CTD droplets at 20 mM NaCl or 50 mM NaCl, respectively, and 10% ficoll before and after addition of 1 µM AR AD (WT* or 22YtoS). Scale bars, 5 μm. h, Quantification of AR AD partitioning in MED1-IDR (top) and RNAPII-CTD droplets (bottom), by measuring AR AD fluorescence intensity (I(AR AD)). Boxes show the mean and the quartiles of all droplets, represented as colored dots from three replicated images. arb.u., arbitrary units. i, Representative (n > 3) merged confocal images of MED1-IDR and RNAPII-CTD droplets obtained in 125 mM NaCl and 10% ficoll with and without the addition of 1 µM AR AD (WT* or 22YtoS). Scale bar, 5 μm. j, Normalized intensity plot of cross-sections from the images shown in i. Source data
Fig. 2
Fig. 2. AR phase separation is associated with nuclear translocation and transactivation.
a, Fluorescence images from live-cell time-lapse videos of PC3 cells expressing eGFP-AR or the indicated mutants. Scale bar, 10 μm. b, Quantification of eGFP-AR relative nuclear localization for the cells in a, as a function of time elapsed since the addition of 1 nM DHT (tDHT). Error bars represent the s.d. of n ≥ 15 cells per time point. c, Representative images (n > 3) of live PC3 nuclei expressing eGFP-AR-V7 WT or a Tyr to Ser mutant. Scale bar, 5 μm. d, Quantification of the nuclear granularity for the cells in c; each dot represents one nucleus, boxes show the mean of the quartiles of all cells and P values were calculated using a Dunnett’s multiple-comparison test against the WT (n ≥ 150 cells per condition). e, Selected Gene Ontology (GO) molecular function networks enriched in the top 75 most abundant hits (Bayesian false discovery rate (BFDR) ≤ 0.02, fold change (FC) ≥ 3) for the indicated bait. Two protein–protein interaction networks are shown: androgen receptor binding (for WT) and structural constituent of the nuclear pore (for 22YtoS). The line thickness corresponds to the strength of published data supporting the interaction, generated from STRING (string-db.org). Additional GO results are provided in Extended Data Fig. 3h and Supplementary Data Table 1. f, Representative results of PLAs in DHT-treated PC3 cells using the indicated antibodies are shown in cyan, with DAPI staining in magenta (n > 3). Streptavidin (strep.) labeling is shown in green, with DAPI in blue (far right) in DHT-treated PC3 cells. The boxes correspond to magnified regions of the images, that illustrate the differences in interactions between WT AR and 22YtoS. Scale bars, 10 μm. g, Transcriptional activity (average ± s.e.m.) of AR and Tyr to Ser mutants, assessed using a luciferase reporter assay for AR (tDHT = 1 h, top) or AR-V7 (bottom) in HEK293 cells. Empty stands for empty vector, and P were calculated using a Dunnett’s multiple-comparison test against the WT (n = 3, top; n = 4, bottom). Source data
Fig. 3
Fig. 3. Short transient helices enhance AR phase separation.
a, Annotation of short helical motifs in the AR AD. The plots show the helical propensity of the WT* AD, measured by NMR in the absence or presence of 2.5% or 5% TFE. Tau-1 and Tau-5 are highlighted. A discontinuous contour indicates motifs that fold when bound to globular binding partners. Helicity values were derived from the main-chain chemical shifts by using δ2D (ref. ). Green values are from an equivalent experiment carried out with the Tau-5* construct (ref. ), which was done because the most informative resonances are invisible in AR AD owing to their involvement in transient long-range interactions. b, The mutants that were used to investigate the effect of reduced helical propensity on phase separation. The color code is the same as that in a. c, Tc measurements of purified AR AD proteins containing proline substitutions (mean ± s.d., n = 3 independent samples), or in the presence of TFE. The solid shading represents the one-phase regime, and droplets represent the two-phase regime. d, Representative (n > 3) live-cell fluorescence microscopy images of DHT-treated PC3 cells expressing the indicated eGFP-AR-ΔNLS mutants. Scale bar, 10 μm. e, Distributions of droplet size for eGFP-AR-ΔNLS and mutants in PC3 cells as a function of tDHT. Each dot corresponds to the mean droplet size in a single cell (n > 20 cells), boxes shown the mean and the quartiles of all cells and P values were calculated using a Mann–Whitney U test. n.s., not significant. f, Representative (n > 3) fluorescence microscopy images of purified AR AD (WT and ΔFQNLF), the LBD and an equimolar mixture of the two proteins in vitro. In the images, the red (AR AD) and green (LBD) channels are merged; 200 mM NaCl and 20 μM protein were used. Approximately 1% of the total amount of protein is labeled. Scale bars, 5 μm. g, Distributions of the size of droplets (n = 750 droplets for WT and n = 150 for ΔFQNLF) from the samples in f, where boxes show the mean and quartiles of all droplets, and average density of droplets in the cells (n = 4 independent samples). h, Scheme illustrating how the N/C interaction and LBD homodimerization each double the valency (N) of the freely diffusing AR species, thus increasing AR phase separation propensity. Source data
Fig. 4
Fig. 4. Optimization of the structure of EPI-001.
a, Experimental set-up for the measurement of the partition coefficient of EPI-001 in condensed AR AD. LLPS, liquid–liquid phase separation. b,c, Chemical structures of EPI-002 and compounds, with a modified linker between the two aromatic rings of EPI-002. b, Schematic of the structures and the corresponding IC50 measured in androgen-induced PSA-luciferase assay. Purple and brown circles correspond to chemical groups depicted in c, in which hydrogens are at the R1 and R2 positions. d, Changes in 15N chemical shift (δN) in the NMR spectra of Tau-5* (60 μM) as a function of amino acid positions, caused by addition of 1 molar equivalent of EPI-001 (blue) or 1aa (red). Orange circles indicate aromatic amino acids positions in the sequence of Tau-5*. R1-3 (ref. ) and polyP regions are highlighted in light and dark gray, respectively. Samples contained 200 mM NaCl and 2% DMSO-d6. e, Illustrated molecular dynamics (MD) snapshot of the AR AD interacting with 1aa. Helices are shown in dark and light blue; the loop between them is gray. 1aa is shown in green, and chlorine in purple. f, Per-residue contact probabilities observed in REST2 MD simulations between Tau-5 residues 391–446 and the compounds EPI-002 (blue) or 1aa (red). Contacts are defined as occurring in frames in which any non-hydrogen ligand atom is within 6.0 Å of a non-hydrogen protein atom. Orange circles represent the positions of aromatic residues. Values are presented as mean ± statistical errors from block averaging. g, Compounds developed from 1aa, and their corresponding potency in the androgen-induced PSA-luciferase assay. h, Correlation between the activity of the compounds in the PSA-luciferase assay and their hydrophobicity in terms of LogD determined by chromatography (ChromLogD). i, Dose-dependent inhibition of AR-V7 transcriptional activity by 1ae. j,k, Effect of 1 molar equivalent EPI-001 and 1ae on the Tc of AR AD (average ± s.d., n = 3 independent samples) (j) and on the distribution of droplet sizes (n > 4,000 droplets for DMSO, n > 2,500 for EPI-001 and n > 2,000 for 1ae), where boxes show the mean and the quartiles of all droplets (k). Source data
Fig. 5
Fig. 5. 1ae decreases interactions between AR and the transcription machinery.
a, Schematic of the method for small-molecule treatment of cells and the BioID experiment. b, BioID–MS of LNCaP MTID-AR-WT cells treated with EPI-001 (10 μM, 1 h), followed by treatment with DHT and biotin (2 h). Intensity data were obtained from SAINTq analysis. Shown is the log2(FC) of the intensity of the interaction in inhibitor-treated versus DMSO-treated cells. Decreased interactors in inhibitor-treated cells relative to DMSO-treated cells are shown in blue; P < 0.05. The dashed lines mark where log2(FC) < −1.5. Increased interactors in inhibitor-treated cells relative to DMSO-treated cells are shown in red; P < 0.05. The dashed lines mark where log2(FC) > 1.5. Proteins of interest are annotated (n = 3). c, As in b, BioID–MS of LNCaP MTID-AR-WT cells. Cells were treated for 1 h with 1ae (5 μM) and then for 2 h with DHT and biotin (n = 3). d, (Total mean) TMean intensities of peptides identified by MS (n = 3) from SAINTq data of individual proteins (bait), total interactors (all) or collated known AR interactors sourced from BioGrid (https://thebiogrid.org/) were compared between LNCaP MTID-AR-WT cells treated with DMSO and those treated with small-molecule inhibitors. e, GO search terms of key biological processes and molecular functions in SAINTq intensity data from b and c (BFDR < 0.02, depleted = log2(FC) < −1.5), obtained from the LNCaP MTID-AR-WT cells treated with small-molecule inhibitors versus DMSO. Full categories are available in Supplementary Data Table 2. f, BioID–MS of the LNCaP MTID-AR-WT interaction with Mediator complex in cells treated with small-molecule inhibitors versus DMSO. SAINTq data, color indicates strength of interaction change from logFC10 TMean of intensity. g, The TMean intensity of interactions with the MED1 subunit of Mediator was compared between LNCaP MTID-AR-WT cells treated with DMSO or small-molecule inhibitors. SAINTq data were used. Statistical significance was determined by Student’s t-test against the control group. h, Results from a PLA in LNCaP MTID-AR-WT cells, using the indicated antibodies shown in cyan with DAPI staining shown in magenta. Cells were treated with small-molecule inhibitors or DMSO and DHT at the indicated times. Scale bars, 10 μm. i, Distributions of PLA foci per cell, each dot corresponds to a cell and boxes shown the mean and quartiles of all cells (n > 20 cells). Source data
Fig. 6
Fig. 6. Compound 1ae inhibits AR-dependent transcription and tumor growth.
a, Structure of 1ae, and a schematic of the experiment used to investigate its effect on LNCaP cells. b, Representative (n > 3) images of LNCaP cells (stained with Hoechst) after 96 h of treatment. Scale bar, 50 μm. c, Dose–response curve (log-logistic fit) of viable LNCaP nuclei, with IC50 values calculated from the dose–response curve (n = 6). d, Volcano plots of differentially expressed genes in LNCaP cells treated with EPI-001 or 1ae for 24 h at a concentration near the IC50 versus cells treated with DMSO (fold change cutoffs: 2×, 0.5×). (Supplementary Data Table 3). e, Gene set enrichment analysis of the top 10 enriched and top 10 depleted msigdb hallmark signature pathways in LNCaP cells treated with EPI-001 or 1ae versus those treated with DMSO. Circle size represents the significance of the normalized enrichment score (log(Padj)), and the color gradient represents normalized enrichment score of the indicated pathway analyzed with GSEA. The hallmark androgen-response pathway is highlighted in gray (n = 3). f, The log transformation of mean normalized counts of the indicated gene sets in LNCaP cells treated with EPI-001 or 1ae. Light lines represent individual genes, dark lines represent average of all genes and the shaded areas represent the standard error (n = 3). g, Representative (n = 3) western blot of endogenous AR in LNCaP cells pretreated with cycloheximide (CHX) for 3 h, which were then treated with 1ae for 21 h. GAPDH was used as the loading control (bottom). h, Schematic of the LNCaP and LNCaP95-D3 xenografting procedure in the CRPC model. i, Tumor volume in mice with LNCaP (left) or LNCaP95-D3 (right) xenografts. Values are presented as the mean percentage relative to the volume measured at the first day of treatment with the error bars representing the s.e.m. of n ≥ 8 (LNCaP) or n ≥ 7 (LNCaP95-D3) tumors per treatment group. Enza., enzalutamide. j, Tumor volume on day 28 or 20 of the experiments, presented as the percentage relative to the volume measured at the first day of treatment. k, Body weight of animals on day 28 or 20 of the xenograft experiments, presented as percentages relative to the body weight measurement on the first day of treatment. Horizontal bars in j and k represent the median. Source data
Extended Data Fig. 1
Extended Data Fig. 1. Characterization of AR condensates in cells using high resolution microscopy.
a) (left) Live-cell stimulated emission depletion (STED) imaging of a HeLa cell nucleus expressing AR-eGFP, treated with 1 nM DHT for 4 h (right) τ-STED imaging of endogenous AR in fixed human prostate adenocarcinoma (LNCaP) cells. Large scale bars: 5 μm. Scale bar in τ-STED inset: 300 nm. Dashed line indicates the nuclear periphery. b) (top) Quantification of τ-STED intensity signal and (bottom) diameter of endogenous AR clusters in LNCaP cells (1750 AR clusters detected across 7 LNCaP nuclei imaged with same fluorescence time gating). L.o.d indicates the limit of detection. Densitymax diameter (bin with highest density of AR clusters in the distribution of all detected AR clusters): 123 nm, median diameter: 178 nm. c) Quantification pipeline used to analyze STED image composites, showing segmentation of cells and detection of clusters using rolling ball background subtraction adjusted to 8 x the resolving capacity of the image (48 nm pixel-1 for TauSTED imaging of LNCaP cells). d) Representative (n > 3) STED (top row) and FLIM STED images showing AR clusters in LNCaP nuclei before and after τ-STED deconvolution (middle and bottom row). Left column shows LNCaP nuclear counterstain using Spy555-DNA stain. Scale bar: 5 μm. Right panels show zoom-ins corresponding to intra-nuclear regions indicated by white boxes on panels in the central column. Scale bar: 500 nm. Source data
Extended Data Fig. 2
Extended Data Fig. 2. AR phase separation is driven by tyrosine residues in the AD.
a) Live-cell confocal imaging of constructs in HEK293T cells after treatment with vehicle or 10 nM DHT for 4 h. Scale bar: 3 µm. Dashed lines indicate nuclear periphery. b) Quantification of data in panel A. Y-axis indicates s.d. and x-axis indicates mean intensity of pixels in the corresponding nucleus. Each dot represents measurements from an individual cell, and lines represent standard regression fits to the corresponding data spread (n = 2). c) Distribution of aromatic and tyrosine residues, clustered using a 9 residue window, where the shaded areas correspond to those represented in Fig. 1c. d) Average intensity of the resonances at different concentrations, relative to their intensity at 25 μM, grouped by residue type. e) Solubility predicted by CamSol for peptides FQNLFQ (black line) and FQNPFQ (red line). f) Representative (n > 3) TEM micrographs of peptides FQNLFQ and FQNPFQ after an overnight incubation. g) Synchronous light scattering of peptides FQNLFQ (black line) and FQNPFQ (red line) after an overnight incubation. h) FT-IR absorbance spectrum in the amide I region (dashed line) of the aggregates formed by the FQNLFQ peptide. The blue shaded area indicates the contribution of the intermolecular β-sheet signal. i) Fluorescence microscopy images of AR AD (WT*) droplets in 20 mM sodium phosphate, 1 mM TCEP pH 7.4 with 150 mM NaCl and 10% ficoll. Scale bar: 10 µm. j) DIC images showing fusion events of 50 μM AR AD WT or WT* samples at 500 mM NaCl at times before and/or after 5 min from sample preparation. k) Fluorescence intensity recovery curves shown as average and s.d. (n = 3 independent samples) and quantification of the recovery half-time and mobile fraction (average ± s.d., n = 4 and n = 8 droplets for WT and L26P (WT*) respectively) and representative confocal microscopy images. l) (Left) Droplets formed by the indicated proteins and signals of the AR AD channel and merged channel. AR AD proteins were used concentrations 5 times higher than in Fig. 1i. Scale bar: 1 µm. (Right) the representative droplet’s cross-section intensity profile. Source data
Extended Data Fig. 3
Extended Data Fig. 3. Tyrosine to serine mutations decrease AR granularity, translocation and alter its interactome.
a, b) Representative (n > 3) images of PC3 cells expressing eGFP-AR (A) and eGFP-AR V7 (B). c) Expression levels of transfected PC3 cells with eGFP-AR constructs and endogenous levels of AR in LNCaP and LNCaP95 cells. GAPDH was used as loading control. d) Quantification of the granularity (s.d.) as a function of the mean nuclear intensity. e) Western blot of FLAG-MTID-AR or FLAG-MTID-Y22toS proteins in PC3 cells. f, g) Scatter plot of the protein intensities at tDHT = 0 and 60 min for PC3 cells expressing FLAG-MTID-WT-AR (F) and FLAG-MTID-22YtoS (G) following SAINTq analysis. Proteins with a BFDR ≤ 0.05 are shown (gray circle) and those with a BFDR ≤ 0.02 and/or FC ≥ 3in tDHT = 60 min are highlighted in blue and red. h) Enriched gene ontology molecular function (GO-MF) categories in FLAG-MTID-WT-AR and FLAG-MTID-22YtoS samples (tDHT = 60 min). The 75 most abundant proteins, with a cutoff of BFDR ≤ 0.02 and FC ≥ 3, were analyzed using STRING and GO categories. The -log10(FDR) for selected categories are shown: those highlighted in Fig. 2e are in bold (Supplementary Data Table 1. i) Venn diagrams showing proteins identified in WT and 22YtoS (top), WT and AR interactions reported in BioGRID and Y22toS and AR interactions reported in BioGRID. Number of proteins identified (tDHT = 0 and 60 min) with a BFDR ≤ 0.02 and a FC ≥ 3 in bold and numbers of proteins identified with a BFDR ≤ 0.05 in gray (Supplementary Data Table 1). j) Gene expression in AR-V7 mutants: heatmap of log2 fold changes (log2FC) compared to the empty vector transduced control PC3 line (Supplementary Data Table 5). Selected genes shown are a composite of several GSEA ‘AR up’ genesets (Broad Institute) upregulated by AR V7 in PC3 cells. K, L) Scatter plots of the selected genes comparing 22YtoS (k) or 22YtoF (l) to WT AR V7 according to a one-tailed t-test comparing calculated NES to the permuted null distribution, with Pvalue adjustment using Benjamini-Hochberg procedure. Source data
Extended Data Fig. 4
Extended Data Fig. 4. Transactivating units and motifs with helical propensity in AR AD contribute to condensation of AR in vitro and in cells.
a) Schematic model describing the nuclear translocation pathway of eGFP-AR and cytoplasmic retention of eGFP-AR-ΔNLS upon exposure to ligand (DHT). b, c) Time-lapse fluorescence microscopy of eGFP-AR (A) and eGFP-AR-ΔNLS (B) condensates upon treatment with 1 nM dihydrotestosterone (DHT) in transiently transfected PC3 cells. Scale bar: 10 µm. Dashed line indicates the nuclear periphery. d) Distributions of average condensate size and density. Each dot corresponds to the mean values measured in an individual cell (n = 45 cells). Pvalues are from Mann-Whitney U tests. n.s.: not significant. e) Snapshots at the indicated time points highlighting a fusion event of eGFP-AR-ΔNLS condensates in the cytoplasm of a PC3 cell. Scale bar: 1 µm. f) Fluorescence recovery after photobleaching (FRAP) analysis of cytoplasmic eGFP-AR-ΔNLS condensates in PC3 cells 1 hour and 24 h after addition of 1 nM DHT (tDHT ≈ 1 h). Average relative fluorescence intensity curve of the eGFP-AR-ΔNLS cytoplasmic condensates as a function of time is shown. Error bars represent s.d. of n = 34 condensates per time point. Within the box, representative images of condensates before and after photobleaching are shown. Scale bar: 1 µm. g) Effect of the mutations introduced in Tau-1 and Tau-5 on the density of the cytosolic condensates formed by eGFP-AR-ΔNLS as a function of tDHT in PC3 cells. Each dot corresponds to a cell (n > 20 cells). Pvalues are from a Mann-Whitney U test. h) Effect of deleting the region of sequence of the AD containing the 23FQNLQ27 motif on the cytosolic condensates formed by eGFP-AR-ΔNLS upon addition of DHT. Scale bar: 10 μm. The dashed line indicates nuclear periphery. i, j) Effect of deleting the region of sequence of the AD containing the 23FQNLQ27 motif on the distribution of average droplet size (I) and droplet density (J) of the cytosolic condenstates formed by eGFP-AR-ΔNLS as a function of tDHT, where each dot corresponds to a cell (n > 20 cells). Pvalues are from Mann-Whitney U tests. Source data
Extended Data Fig. 5
Extended Data Fig. 5. Characterisation of small molecules with enhanced potency.
a) Inhibition (average ± s.e.m., n = 3) of the androgen-induced full-length AR transcriptional activity by compounds shown in Fig. 4a. b) Selected regions of Tau-5* 1H,15 N BEST-TROSY spectra in the absence (gray) and presence of 1 mol equivalent of EPI-001 (blue) and 1aa (red). c) Helical propensities of Tau-5R2_R3 in its apo form (black) and in bound conformations obtained from simulations run in the presence of EPI-002 (blue) and 1aa (red) with an indication of the positions of helical motifs and aromatic residues in the sequence. The data was obtained from the 300 K REST2 MD simulations. Values are presented as averages ± statistical errors from block averaging. d) Populations of aromatic stacking contacts between aromatic side chains of Tau-5R2_R3 and aromatic rings of EPI-002 (blue) and 1aa (red) with an indication of the positions of helical motifs and aromatic residues. The data was obtained from the 300 K REST2 MD simulations. Values are presented as averages ± statistical errors from block averaging. e) ChromLogD values of compounds developed from 1aa scaffold reporting their hydrophobicity (n = 3). f) Comparison of EPI-002 (35 µM) and enzalutamide (ENZA, 5 µM) with the most potent compounds (5 µM) to block AR-V7 transcriptional activity (average ± s.e.m., n = 3). g, h) Lack of a dose-dependent inhibition of AR-V7 transcriptional activity for 1ab (g) and 1bb (g). LNCaP cells that ectopically expressed AR-V7 were co-transfected with a V7BS3-luciferase reporter gene construct and incubated with the indicated concentrations of the compounds (average ±s.e.m., n = 3). i, j) 1ae blocked the proliferation of both LNCaP cells in response to androgen and AR-V-driven proliferation of LNCaP95 cells whereas Enzalutamide (ENZA) blocked androgen-induced proliferation driven by full-length AR in LNCaP cells but had poor potency against AR-V-driven proliferation of LNCaP95 (LN95) cells (average ± s.e.m., n = 3). Source data
Extended Data Fig. 6
Extended Data Fig. 6. Small molecule inhibitors alter AR proteomic interactions with Mediator.
a) Representative (n = 2) western blot showing expression of FLAG-MTID-AR or FLAG-MTID-Y22toS proteins in LNCaP cells with antibodies for AR. Biotin-dependent labeling is shown with Streptavidin antibodies (Strep) and GAPDH and Ponceau staining are shown as loading controls. EV indicates the empty vector expressing FLAG-MTID. b) BioID MS of LNCaP MTID-AR-WT interaction with Mediator complex. Colour indicates strength of interaction from FLAG, LogFC10 Tmean of intensity. c) TMean SAINTq intensity of total mediator interactions were compared across LNCaP MTID-AR-WT with DMSO or treated cells with small molecule inhibitors. Source data
Extended Data Fig. 7
Extended Data Fig. 7. 1ae inhibits AR dependent oncogenic pathways in models of CRPC.
a) qRT-PCR of PSA and FKBP5 transcript targets using two primer pairs for each locus. Values indicate 2-∆∆Ct (Log fold change in target signal versus β-Glucuronidase housekeeping gene signal normalized to values from corresponding DMSO control sample, average ± s.e.m., n = 3). b) Principal component analysis of LNCaP cells treated with EPI-001 or 1ae (n = 3). c) Sequential walk of the GSEA running enrichment score of hallmark androgen response pathway genes in LNCaP cells treated with EPI-001 or 1ae, versus DMSO, for 24 h. Top 5 downregulated genes for EPI-001 and 1ae treatment contributing to the leading edge indicated in top right, and adjusted Pvalue of GSEA statistic indicated in bottom left (n = 3) according to a one tailed t-test comparing calculated NES to the permuted null distribution, with Pvalue adjustment using Benjamini-Hochberg procedure. d) Line plots of mean normalized, log transformed read counts of significantly depleted gene sets in LNCaP cells treated with EPI-001 or 1ae versus DMSO at 24 h (shown in Fig. 6e), as a function of concentration. Light lines represent individual genes, dark lines represent average of all genes, and bars represent s.d. (n = 3). e) GSEA analysis of RNA-seq experiment showing most significantly activated and suppressed pathways for EPI-001 and 1ae treatment, vs DMSO, at 24 h, ranked by the adjusted Pvalue (padj). Gene pathways split by ‘activated’ or ‘suppressed’ based on GSEA enrichment in the gene list ranked by log2FC vs DMSO, in order of gene ratio (detected genes/all genes in pathway) of the analyzed pathway. Circles scale to the count of detected genes from the pathway, and color scales to padj from the pathway (n = 3), according to a one tailed t-test comparing calculated NES to the permuted null distribution, with Pvalue adjustment using Benjamini-Hochberg procedure. f) Quantification of AR signal, versus DMSO control, normalized to GAPDH signal from western blots of LNCaP cells treated with CHX for 3 h, then 1ae at indicated concentrations for 21 h (n = 3, except 5 and 10 μM where n = 2). Source data
Extended Data Fig. 8
Extended Data Fig. 8. 1ae has on-target activity in LNCaP and LNCaP95 xenografts.
Real-time PCR of AR, KLK2, KLK3, FKBP5, NKX3.1, and ALAS1 transcript normalized to SDHA harvested from LNCaP tumors (a), and AR, AR-V7, CCNA2, UBE2C, B4GALT1 and ALAS1 transcript normalized to SDHA harvested from LNCaP95-D3 tumors (b). Both enzalutamide and 1ae show on target activity and do not affect expression of housekeeping gene ALAS1 in LNCaP xenografts. Conversely only 1ae is capable of repressing AR-V7 induced genes, or de-repressing AR-V7 repressed gene B4GALT1. Error bars represent s.e.m. of n = 3 samples per treatment arm. Source data

References

    1. Darnell JE., Jr. Transcription factors as targets for cancer therapy. Nat. Rev. Cancer. 2002;2:740–749. doi: 10.1038/nrc906. - DOI - PubMed
    1. Bradner JE, Hnisz D, Young RA. Transcriptional addiction in cancer. Cell. 2017;168:629–643. doi: 10.1016/j.cell.2016.12.013. - DOI - PMC - PubMed
    1. Lawrence MS, et al. Discovery and saturation analysis of cancer genes across 21 tumour types. Nature. 2014;505:495–501. doi: 10.1038/nature12912. - DOI - PMC - PubMed
    1. Hanahan D, Weinberg RA. Hallmarks of cancer: the next generation. Cell. 2011;144:646–674. doi: 10.1016/j.cell.2011.02.013. - DOI - PubMed
    1. Bushweller JH. Targeting transcription factors in cancer—from undruggable to reality. Nat. Rev. Cancer. 2019;19:611–624. doi: 10.1038/s41568-019-0196-7. - DOI - PMC - PubMed

MeSH terms