. 2024 Jan;27(1):63-77.
doi: 10.1038/s41593-023-01497-z. Epub 2023 Dec 4.

Meningeal interleukin-17-producing T cells mediate cognitive impairment in a mouse model of salt-sensitive hypertension

Affiliations

Meningeal interleukin-17-producing T cells mediate cognitive impairment in a mouse model of salt-sensitive hypertension

Monica M Santisteban et al. Nat Neurosci. 2024 Jan.

Abstract

Hypertension (HTN), a disease afflicting over one billion individuals worldwide, is a leading cause of cognitive impairment, the mechanisms of which remain poorly understood. In the present study, in a mouse model of HTN, we find that the neurovascular and cognitive dysfunction depends on interleukin (IL)-17, a cytokine elevated in individuals with HTN. However, neither circulating IL-17 nor brain angiotensin signaling can account for the dysfunction. Rather, IL-17 produced by T cells in the dura mater is the mediator released in the cerebrospinal fluid and activating IL-17 receptors on border-associated macrophages (BAMs). Accordingly, depleting BAMs, deleting IL-17 receptor A in brain macrophages or suppressing meningeal T cells rescues cognitive function without attenuating blood pressure elevation, circulating IL-17 or brain angiotensin signaling. Our data unveil a critical role of meningeal T cells and macrophage IL-17 signaling in the neurovascular and cognitive dysfunction in a mouse model of HTN.


Conflict of interest statement

Competing interests

C.I. is on the scientific advisory board of Broadview Ventures. All other authors declare no competing interests.

Figures

Extended Data Fig. 1 |
Extended Data Fig. 1 |. Physiological parameters at 21 days of DOCA-salt HTN.
(A-B) Tissue sodium (A) and potassium (B) content was assessed by inductively coupled plasma – atomic emission spectrometry (ICP-AES),. Intergroup differences analyzed by unpaired two-tailed t-test for each organ, n = 6–10 mice/group as shown. (C-D) BBB permeability (D) assessed by brain extravasation of 3 kDa FITC-dextran (C) quantified by spectrophotometry in brain homogenates revealed no impairment during DOCA-salt hypertension (n = 5–8). (E-F) DOCA-salt HTN does not impair resting CBF assessed quantitatively by arterial spin label (ASL)-MRI (control (E) n = 10 mice, DOCA (F) n = 9 mice) at 21 days of treatment in the hippocampus (Hipp), cortex (Ctx), amygdala (Amyg), caudate putamen (CP), thalamus (Thal), or hypothalamus (Hypoth). Intergroup differences analyzed by two-way ANOVA with Tukey’s multiple comparisons test. (G) IL17-GFP+ neutrophils were not changed by DOCA-salt in peripheral blood mononuclear cells (PBMC) or in the dura. n = 4/group.
Extended Data Fig. 2 |
Extended Data Fig. 2 |. Systolic blood pressure measured by tail-cuff plethysmography.
Systolic blood pressure (SBP) was assessed twice per week in all control and DOCA-salt mice of the following groups: (A) wild-type (WT, n = 10 mice) and IL17-deficient (IL17KO, n = 6 mice) mice, (B) WTBR1 (n = 5 mice/group) and IL17RA brain endothelial cell knockout (IL17RAbECKO, n = 6 mice/group), (C) mice treated with vehicle (PBS) or clodronate (CLO)-containing liposomes (n = 10 mice/group), (D and E) bone marrow chimeras (n = 5 mice/group), and (F) i.c.v. saline or losartan (n = 6 mice/group). Intergroup differences analyzed by two-way repeated measures ANOVA with Tukey’s multiple comparisons test.
Extended Data Fig. 3 |
Extended Data Fig. 3 |. Cerebral endothelial cell specific Cre delivery with AAV-BR1-iCre.
(A) AAV-BR1-iCre delivery in Ai14-ROSAtdTomato reporter mice demonstrates (B) widespread TdTomato (TdTM) expression in cerebral vessels. Scale bar: 500μm. (C) Specifically, we observed a 90–95% endothelial viral transduction in vessels less than 20μm (n = 5 mice, 110 vessels per mouse). (D) Representative images of TdTM expression in CD31+ endothelial cells. Scale bar: 150μm. (E) Quantification of genomic IL-17RA deletion in EC and MG (n = 4 mice/group). Intergroup differences analyzed by two-way ANOVA with Tukey’s multiple-comparison test.
Extended Data Fig. 4 |
Extended Data Fig. 4 |. Brain macrophages depletion with clodronate and ROS measurement.
(A) i.c.v. clodronate depletes brain macrophages for 21 days, and (B) initially depletes dura macrophages, but they are fully restored within 21 days. n = 3–7 mice/group as shown. Intergroup differences analyzed by one-way ANOVA with Tukey’s multiple-comparison test. (C) DOCA-salt does not increase BAM ROS IL17RA−/−→WT chimeras (control n = 3 mice, DOCA n = 4 mice), or (D) in WT mice treated with FTY720 (n = 4 mice/group). Intergroup differences analyzed by two-way ANOVA with Tukey’s multiple comparisons test.
Extended Data Fig. 5 |
Extended Data Fig. 5 |. Novel Mrc1CreERT2/+ mouse.
(A) Schematic of CNS macrophage compartments. (B) Illustration of the experimental procedure for intracerebroventricular (i.c.v.) FITC-Dextran injection and analysis of adult Mrc1+/+ or Mrc1CreERT2/+. (C-E) Immunofluorescence images reveals FITC-Dextran (green) (c) in BAMs (CD206 + , red) in perivascular macrophages (pvMΦ) and pial MΦ (D) and dural MΦ (E) compartments in the cortex of adult Mrc1+/+ or Mrc1CreERT2/+ mice. CD31+ blood vessels shown in cyan. Scale bars: 20 μm. (F) Quantification of pvMΦ, pial MΦ and dural MΦ in Mrc1+/+ (n = 4 mice) or Mrc1CreERT2/+ (n = 6 mice for of pvMΦ and pial MΦ, n = 5 mice for dural MΦ). Data shown as mean ± SEM; intergroup differences analyzed by two-way ANOVA with Bonferroni’s multiple comparison test. (G) CD206 surface expression levels on individual FITC-Dextran cells (pvMΦ Mrc1+/+ n = 586 cells, Mrc1CreERT2/+ n = 676 cells; pial Mrc1+/+ n = 235 cells, Mrc1CreERT2/+ n = 340 cells; dural Mrc1+/+ n = 1780 cells, Mrc1CreERT2/+ n = 1871 cells. Mrc1+/+ n = 4 mice, Mrc1CreERT2/+ n = 6 mice for of pvMΦ and pial MΦ, n = 5 mice for dural MΦ; 10 images per mouse per compartment, all cells within each image were analyzed). Intergroup differences analyzed by unpaired two-tailed Mann Whitney test; lines in violin plot indicate median and quartiles.
Extended Data Fig. 6 |
Extended Data Fig. 6 |. Novel Mrc1CreERT2/+ mouse.
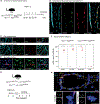
(A) Experimental procedure for tamoxifen administration (TAM) and analysis of adult Mrc1+/+R26tdTM/+ or Mrc1CreERT2/+R26tdTM/+ mice. (B-D) Immunofluorescence images reveal tdTM+ (red) in CD206+ BAM (green) in perivascular macrophages (pvMΦ) (B), pial MΦ (c), and dural MΦ (D). CD31+ blood vessels shown in cyan. Scale bars: 20 μm. (E) TdTM expression was no observed in microglia (IBA1+, green) of adult Mrc1CreERT2/+R2 6tdTM/+ mice. Scale bars: 20 μm. (F) Quantification of recombination efficacy in pvMΦ, pial MΦ, and dural MΦ, as well as microglia in Mrc1+/+R26tdTM/+ and Mrc1 CreERT2/+R26tdTM/+ mice. Data shown as mean ± SEM; Mrc1+/+R26tdTM/+ n = 5 mice per compartment except n = 3 mice for dura; and Mrc1CreERT2/+R26tdTM/+ n = 6 mice for pvMΦ and pial, and n = 5 mice for dural and microglia. (G) Experimental procedure for tamoxifen administration and analysis of Mrc1CreERT2/+ x IL17RAflox/flox mice. (H) Representative image of cerebral blood vessel stained for CD31 (yellow, IHC), Mrc1 (cyan, RNAscope) and IL17RA (magenta, RNAscope). Blood vessel shows one IL17RA- BAM and one IL17RA + BAM. This identification strategy was used for quantification of IL17RA deletion in Mrc1CreERT2/+ x IL17RAflox/flox mice. Scale bars: 10 μm.
Extended Data Fig. 7 |
Extended Data Fig. 7 |. Total numbers of cells obtained by flow cytometry in dura.
Total numbers of cells obtained by flow cytometry from control (n = 14 mice) and DOCA (n = 17 mice) dura samples. (A) Total CD4 cells. (B) Total Th17 cells. (C) Total γδT cells. (D)Total γδT17 cells.
Extended Data Fig. 8 |
Extended Data Fig. 8 |. Markers of neuroinflammation in neocortex and hippocampus.
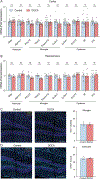
(A-B) Selected inflammatory gene expression assessed by qPCR was not altered in cortex (A) (control n = 15 mice; DOCA n = 12 mice) or hippocampus (B) of DOCA-salt mice (control n = 10 mice; DOCA n = 8 mice). Intergroup differences analyzed by two-way ANOVA with Tukey’s multiple comparison test. (C) Iba1+ microglia and (D) GFAP+ astrocyte area was not altered in the hippocampus of DOCA-salt (control n = 3 mice, DOCA n = 4 mice). Intergroup differences analyzed by unpaired two-tailed t-test. Scale bars: 150 μm.
Extended Data Fig. 9 |
Extended Data Fig. 9 |. Brain Agtr1a and renal Ren1 mRNA expression.
Brain Agtr1a and renal Ren1 mRNA expression in (A) IL-17KO (brain n = 6 mice/group, kidney n = 5 mice/group) and (B) vehicle and FTY720-treated control and DOCA-salt mice (n = 4–8 mice/group as shown). Intergroup differences analyzed by unpaired two-tailed t-test (A) or two-way ANOVA with Tukey’s multiple comparison test (B).
Extended Data Fig. 10 |
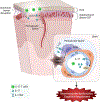
Extended Data Fig. 10 |. Summary diagram.
Summary of the mechanisms by which DOCA-salt hypertension alters neurovascular and cognitive function in mice. These effects are mediated by concurring actions of IL17 acting on IL17RA on different cells types on both sides of the BBB. In the circulation, IL-17 produced by T-cells acts on cerebral endothelial IL-17RA to reduce NO production leading to suppression of endothelial vasoactivity without affecting the increase in CBF induced by neural activity. In the brain, IL-17 produced by dura T-cells acts on IL-17RA on BAM to induce vascular oxidative stress and suppression of functional hyperemia with minimal effects on endothelial function.
Fig. 1 |
Fig. 1 |. DOCA-salt HTN induces neurovascular and cognitive impairment.
a, SBP, assessed by tail-cuff plethysmography, is elevated in DOCA-salt HTN over 28 days of treatment (HTN, P < 0.0001; time, P < 0.0001; interaction, P < 0.0001; n = 15 mice per group). b, Schematic of methods used to assess neurovascular function (created with BioRender.com). c,d, DOCA attenuates the increase in CBF induced by 60-s stimulation (c) of the facial whiskers (functional hyperemia), beginning at 10 d of DOCA (d) (HTN, P < 0.0001; time, P = 0.001; interaction, P < 0.0001; n = 4–7 mice per group as shown). e, Endothelial vasodilatation was attenuated by DOCA beginning at 10 d (HTN, P < 0.0001; time, P < 0.0001; interaction, P < 0.0001; n = 4–7 mice group as shown). f, No difference observed in smooth muscle reactivity (HTN, P = 0.9702; time, P = 0.1981; interaction, P = 0.6479; n = 4–7 mice per group as shown). gi, DOCA-induced cognitive impairment assessed by percentage time exploring a novel object (HTN, P < 0.0001; time, P < 0.0001; interaction, P = 0.0012; n = 5–11 mice per group as shown) (g), time in TQ during the Barnes maze probe trial (HTN, P < 0.0001; time, P = 0.6531; interaction, P = 0.7123; n = 13 mice per group) (h) and nest building assessed on the Deacon score scale (HTN, P = 0.0125; time, P = 0.0069; interaction, P = 0093; n = 10–20 mice per group as shown) (i). Representative images of a single mouse from each group are shown for novel object recognition, the Barnes maze probe trial and nest building. All intergroup differences are analyzed by two-way ANOVA and Bonferroni’s multiplecomparison test. Data are shown as mean ± s.e.m.
Fig. 2 |
Fig. 2 |. The neurovascular and cognitive impairment induced by DOCA is mediated by IL-17.
a, Serum IL-17 elevated in DOCA HTN starting at 10 d (P < 0.0001; one-way ANOVA and Bonferroni’s multiple-comparison test; n = 5–18 mice per group as shown). b, Then, 21 d of DOCA-salt increasing Il17a mRNA (unpaired, two-tailed Student’s t-test, n = 11 mice per group). c, Representative images of IL-17-GFP cells in the small intestine of control and DOCA-salt. Scale bar, 300um. d, 21 d of DOCA-salt also increases IL-17-GFP cells in the small intestine (unpaired, two-tailed Student’s t-test, n = 5 and 6 mice per group). eg, Cells identified by flow cytometry as TH17 cells (f) and γδT17c cells (g) in the lamina propria (LP) (e) not intraepithelial lymphocytes (unpaired, two-tailed Student’s t-test, n = 6 mice per group). h,i, TH17 cells (h) and γδT17 cells (i) also expanded in peripheral blood mononuclear cells (PBMCs) and spleen (SP), but not in the bone marrow or lymph nodes (LNs) (unpaired, two-tailed Student’s t-test per organ, n = 7 and 8 mice per group). jn, IL-17-deficient mice (KO) (j) not exhibiting an attenuation in functional hyperemia (HTN, P < 0.0001; genotype, P = 0.0024; interaction, P = 0.0002; two-way ANOVA and Bonferroni’s multiple-comparison test; n = 6–8 mice per group as shown) (k), endothelial vasodilatation (HTN, P < 0.0001; genotype, P = 0.0079; interaction, P = 0.0004; two-way ANOVA and Bonferroni’s multiple-comparison test; n = 6–8) (l) and no deficits observed in either novel object recognition (HTN, P < 0.0001; genotype, P = 0.2603; interaction, P = 0.0003; two-way ANOVA and Bonferroni’s multiple-comparison test; n = 9–11 mice per group as shown) (m) or Barnes maze tests (HTN, P = 0.0010; genotype, P = 0.0076; interaction, P = 0.0114; two-way ANOVA and Bonferroni’s multiple-comparison test; n = 9–11 mice per group as shown) (n). Data are shown as mean ± s.e.m. Schematics were created with BioRender.com.
Fig. 3 |
Fig. 3 |. IL-17 impairs endothelial vasodilatation by downregulating NO bioavailability via endothelial IL-17 receptors.
ac, IL-17RA brain endothelial cell KO (IL-17RAbECKO) mice (a) protected from impairment in endothelial vasodilatation (HTN, P = 0.0007; genotype, P = 0.0067; interaction, P = 0.0223; two-way ANOVA and Bonferroni’s multiple-comparison test; n = 7–8 mice per group as shown) (b) but not impairment in functional hyperemia induced by DOCA (HTN, P < 0.0001; genotype, P = 0.9446; interaction, P = 0.0161; two-way ANOVA and Bonferroni’s multiple-comparison test; n = 7–8 mice per group as shown) (c). d, Resting and ACh-induced endothelial NO production attenuated in DOCA cerebral microvascular preparations (P < 0.0001, repeated measured one-way ANOVA and Tukey’s multiple-comparison test; n = 8 mice per group). Veh, Vehicle. Scale bar, 50 μm. e,f, eNOS inhibitory phosphorylation increased by DOCA in WT mice (unpaired, two-tailed Student’s t-test) (e), an effect suppressed in IL-17RAbECKO mice (HTN, P = 0.0185; genotype, P = 0.0037; interaction, P = 0.0266; two-way ANOVA and Bonferroni’s multiple-comparison test; n = 5–7 mice per group as shown) (f). g,h, IL-17RAbECKO displayed cognitive improvement only in novel object recognition (HTN, P < 0.0001; genotype, P = 0.0061; interaction, P = 0.0338; two-way ANOVA and Tukey’s multiplecomparison test; n = 6–12 mice per group as shown) (g), not the Barnes maze test (HTN, P = 0.0001; genotype, P = 0.8102; interaction, P = 0.6488; two-way ANOVA and Tukey’s multiple-comparison test; n = 10–13 mice per group as shown) (h). Data are shown as mean ± s.e.m. Schematics created with BioRender.com.
Fig. 4 |
Fig. 4 |. IL-17 impairs functional hyperemia via enhanced ROS production mediated by IL-17RA in BAMs.
a,b, BAMs, including perivascular and leptomeningeal macrophages (a), depleted by 80% 21 d after delivery i.c.v. of liposome-encapsulated clodronate (CLO) depletion (b) (HTN, P = 0.3156; liposomes, P < 0.0001; interaction, P = 0.7305; two-way ANOVA and Tukey’s multiple-comparison test; n = 5 mice per group). c, Representative images of CD206 BAMs in PBS and CLO treated mice. Scale bar, 150 μm. dg, BAM depletion normalized functional hyperemia (HTN, P < 0.0001; liposomes, P = 0.0050; interaction, P = 0.0004; two-way ANOVA and Tukey’s multiple-comparison test; n = 9–10 mice per group as shown) (d) and partially improved endothelial vasodilation (HTN, P < 0.0001, liposomes, P = 0.0100, interaction, P = 0.0112, two-way ANOVA and Tukey’s multiple-comparison test; n = 9–10 mice per group as shown) (e) while also improving cognitive function assessed by novel object recognition (HTN, P < 0.0001; liposomes, P < 0.0001; interaction, P < 0.0001; two-way ANOVA and Bonferroni’s multiple-comparison test; n = 10 mice per group as shown) (f) and the Barnes maze test (HTN, P = 0.1240; liposomes, P = 0.0648; interaction, P = 0.0062, two-way ANOVA and Bonferroni’s multiple-comparison test; n = 10–12 mice per group as shown) (g). h, Neocortical application of the ROS scavenger MnTBAP rescuing the impairment of functional hyperemia in DOCA-salt HTN (P = 0.0090; treatment, P = 0.3418; interaction, P = 0.0005, two-way repeated measures ANOVA with Bonferroni’s multiple-comparison test; n = 5 mice per group). ik, The increased ROS production in BAMs (i) induced by DOCA-salt (HTN, P = 0.0033; cell type, P < 0.0001, interaction, P < 0.0001; two-way repeated measures ANOVA with Bonferroni’s multiple-comparison test; n = 6–7 mice per group as shown) (j) prevented in IL-17RA-deficient mice (HTN, P = 0.0006; genotype, P < 0.0001; interaction, P = 0.0002; two-way ANOVA with Bonferroni’s multiple-comparison test; n = 6–8 mice per group as shown) (k). MG, microglia. EC, endothelial cells. l, Recombinant IL-17 increased ROS production in BAMs (paired, two-tailed Student’s t-test per ROS indicator; n = 5–8 biological replicates). mq, Deletion of either IL-17RA or Nox2 from BAM in BM chimeras (m) preventing the impairment of functional hyperemia in full (HTN, P = 0.0030; BAM genotype, P = 0.0003; interaction, P < 0.0001; two-way ANOVA with Tukey’s multiple-comparison test; n = 6–8 mice per group as shown) (n), improved endothelial vasodilation (HTN, P < 0.0001; BAM genotype, P = 0.1898; interaction, P = 0.0248; two-way ANOVA with Tukey’s multiple-comparison test; n = 6–8 mice per group as shown) (o), as well as cognitive function (novel object (p): HTN, P = 0.0392, BAM genotype, P < 0.0001; interaction, P = 0.0004 or the Barnes maze test (q): HTN, P = 0.2287; BAM genotype, P = 0.0362; interaction, P = 0.0040; two-way ANOVA with Tukey’s multiple-comparison test; n = 7–12 mice per group as shown). Data are shown as mean ± s.e.m. Schematics created with BioRender.com.
Fig. 5 |
Fig. 5 |. IL-17RA deletion in BAMs improves functional hyperemia and cognitive function in DOCA-salt.
a, CreERT2 cassette introduced into the endogenous Mrc1 locus. b, Mrc1CreERT2 mice crossed with the Ai14 TdTomato reporter mice. c, TdTM expression in BAMs (experiment repeated three times). Scale bar, 50 μm. d, Mrc1CreERT2 mice crossed with IL-17RAflox/flox to generate BAMIL17RA−/−. e, IL-17RA expression reduced by 78.9% in BAMIL17RA−/− compared with BAMWT mice (n = 3 mice per group; 50 BAMs per mouse; interaction IL-17RA expression × genotype, P < 0.0001, two-way repeated measures ANOVA with Bonferroni’s multiple-comparison test). f, BP under control and DOCA-salt conditions not altered in BAMWT or BAMIL17RA−/− mice (n = 5–7 mice per group; experimental group, P < 0.0001; time, P = 0.0050; interaction, P = 0.0018; two-way repeated measures ANOVA with Tukey’s multiple-comparison test). g,h, IL-17RA deletion in BAMs restoring functional hyperemia (HTN, P = 0.0048; genotype, P = 0.0080; interaction, P = 0.0499; two-way ANOVA with Bonferroni’s multiple-comparison test; n = 4–5 mice per group as shown) (g) without improving endothelial vasodilatation (HTN, P < 0.001; genotype, P = 0.8120; interaction, P = 0.4368; two-way ANOVA with Tukey’s multiple-comparison test; n = 4–5 mice per group as shown) (h). i,j, Rescued cognitive function after 21 d of DOCA-salt (novel object (i): HTN, P = 0.2638; genotype, P = 0.0460; interaction, P = 0.0100); Barnes maze test (j): HTN, P = 0.0427; genotype, P = 0.5297; interaction, P = 0.0365; two-way ANOVA with Tukey’s multiple-comparison test; n = 5–7 mice per group as shown). Data are shown as mean ± s.e.m.
Fig. 6 |
Fig. 6 |. Salt-sensitive hypertension increases IL-17-producing T cells located in the dura mater.
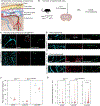
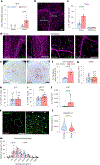
a, Il17a mRNA not observed in the brain, but detected in dura mater of control mice and markedly increased by DOCA-salt (unpaired, two-tailed Student’s t-test; n = 6). b, Dura whole mount stained with CD31 (magenta). Scale bar, 1 mm. c, DOCA-salt treatment leading to a significant increase in IL-17–GFP+ cells surrounding the venous sinuses (HTN, P = 0.0017; sinus, P < 0.0001; interaction, P = 0.0034; two-way repeated measures ANOVA with Bonferroni’s multiple-comparison test; n = 6 mice per group). d, Representative images of control and DOCA sinus and nonsinus regions. Scale bar, 200 μm. Analysis is shown in c. e,f, Dural isolated cells secreting IL-17 (e), a response increased in DOCA-salt mice (unpaired, two-tailed Student’s t-test with Welch’s correction; n = 5 mice per group) (f). Scale bar, 1 mm. g, DOCA-salt not changing the total number of CD45 immune cells isolated from dura (unpaired, two-tailed Student’s t-test; control n = 14, DOCA n = 17 mice per group as shown). h,i, DOCA-salt increasing the percentage of γδT17 cells but no difference in TH17 cells (unpaired, two-tailed Student’s t-test; control (h) n = 14, DOCA (i) n = 17 mice per group as shown). j, IL-17 detection increased in the CSF after 21 d of DOCA-salt (two-tailed Mann–Whitney U-test, control n = 12, DOCA n = 13 mice). k, Arachnoid barrier integrity was assessed by the arachnoid barrier tight junction marker claudin-11. Arrowheads indicate discontinuous tight junctions, # indicates reduced arachnoid domain size and thin arrows indicate altered tight junction morphology. Scale bar, 50 μm. l,m, Arachnoid barrier domain size (Kolmogrov–Smirnov test; control n = 663 domains, DOCA n = 616 domains (5 mice, 10 images per mouse, all domains per image quantified) (l), lines in violin plot indicate median and quartiles) and distribution was altered by DOCA-salt (HTN, P = 0.9880; domain size bin, P < 0.0001; interaction, P < 0.0001; two-way ANOVA with Bonferroni’s multiple-comparison test) (m). Data are shown as mean ± s.e.m.
Fig. 7 |
Fig. 7 |. Cognitive impairment in salt-sensitive HTN is driven by meningeal IL-17-producing T cells.
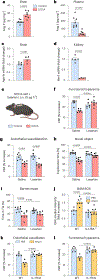
a,b, FTY720 administered from day 7 to day 21 (a) of DOCA-salt not affecting the increase in SBP (b) (treatment, P < 0.0001; time, P < 0.0001; interaction, P = 0.0105; two-way repeated measures ANOVA with Tukey’s multiple-comparison test; n = 5–7 mice per group). c,d, FTY720 reducing circulating CD4 T cells (HTN, P = 0.0705; treatment, P < 0.0001; interaction, P = 0.0737; two-way ANOVA with Tukey’s multiple-comparison test; n = 4–7 mice per group as shown) (c), without affecting the elevation in serum IL-17 in DOCA-salt (HTN, P < 0.0001; treatment, P = 0.7200; interaction, P = 0.6622; two-way ANOVA with Tukey’s multiple-comparison test; n = 9–11 mice per group as shown) (d). eg, FTY720 reducing IL-17–GFP cells (e) in the dura, including both TH17 cells (HTN, P = 0.8358; treatment, P < 0.0001; interaction, P = 0.7848; two-way ANOVA with Bonferroni’s multiple-comparison test; n = 7–10 mice per group as shown) (f) and γδT17 cells (HTN, P = 0.4044; treatment, P = 0.0001; interaction, P = 0.7150; two-way ANOVA with Bonferroni’s multiple-comparison test; n = 7–10 mice per group as shown) (g). hk, FTY720 did not improve endothelial vasodilation (HTN, P < 0.0001; treatment, P = 0.4839; interaction, P = 0.9293; two-way ANOVA with Bonferroni’s multiple-comparison test; vehicle n = 5, FTY720 n = 6 mice per group) (h), but completely restored functional hyperemia (HTN, P < 0.0001; treatment, P = 0.0004; interaction, P < 0.0001; two-way ANOVA with Bonferroni’s multiple-comparison test; vehicle, n = 5, FTY720, n = 6 mice) (i), as well as improved cognitive function (novel object (j): HTN, P = 0.0007; treatment, P = 0.0037; interaction, P = 0.0023; Barnes maze test (k): HTN, P = 0.0023; treatment, P = 0.0045; interaction, P = 0.1695; two-way ANOVA with Tukey’s multiple-comparison test; n = 8–12 mice per group as shown). l, Anti-TCRγδ antibody delivered i.c.v. from day 7 to day 21 of DOCA-salt. m, Anti-TCRγδ antibody treatment reducing γδT cells in the dura (two-tailed, unpaired Student’s t-test, n = 8–11 mice per group as shown). n, Anti-TCRgd antibody not altering the BP response to DOCA-salt (HTN, P < 0.0001; time, P < 0.0001; interaction, P = 0.0016; two-way repeated measures ANOVA with Tukey’s multiple-comparison test; n = 5–6 mice per group). or, Dural γδT cell depletion did not restore endothelial vasodilatation (HTN, P = 0.0001; treatment, P = 0.6673; interaction, P = 0.7281; two-way ANOVA with Tukey’s multiple-comparison test; n = 4–5 mice per group as shown) (o), but was associated with improved functional hyperemia (HTN, P = 0.0082; treatment, P = 0.3407; interaction, P = 0.0365; two-way ANOVA with Tukey’s multiple-comparison test; n = 4–5 mice per group as shown) (p) and cognitive function (novel object (q): HTN, P = 0.0012; treatment, P = 0.0323; interaction, P = 0.0004; Barnes maze (r): HTN, P = 0.0040; treatment, P = 0.0229; interaction, P = 0.3002; two-way ANOVA with Tukey’s multiple-comparison test; n = 6–8 mice per group as shown). Data are shown as mean ± s.e.m. Schematics created with BioRender.com.
Fig. 8 |
Fig. 8 |. The contribution of Ang II to the cerebrovascular dysfunction in DOCA-salt depends on IL-17 signaling.
a,b, DOCA-salt treatment elevating Ang II levels in brain (a) and reducing it in the circulation (b) (unpaired, two-tailed Student’s t-test; n = 7–8 mice per group as shown). c,d, DOCA-salt upregulating brain Agtr1a (c) and downregulating kidney renin (d) (unpaired, two-tailed Student’s t-test; n = 4–5 mice per group as shown). eg, Central AT1R blockade with chronic losartan i.c.v. (e) restoring functional hyperemia (HTN, P = 0.0088; treatment, P = 0.0148; interaction, P < 0.0001; two-way ANOVA with Bonferroni’s multiple-comparison test; n = 6–8 mice per group as shown) (f), but not improving endothelium-dependent vasodilatation (HTN, P < 0.0001; treatment, P = 0.9604; interaction, P = 0.2642; two-way ANOVA with Bonferroni’s multiple-comparison test; n = 6–8 mice per group as shown) (g). h,i, Central AT1R blockade improving novel object recognition (HTN, P < 0.0001; treatment, P = 0.0005; interaction, P < 0.0001; two-way ANOVA with Bonferroni’s multiple-comparison test; n = 8–10 mice per group as shown) (h), but not improving Barnes maze test (HTN, P = 0.0002; treatment, P = 0.6968; interaction, P = 0.2113; two-way ANOVA with Tukey’s multiple-comparison test; n = 7–8 mice per group as shown) (i). j, Ang II stimulation increasing ROS production in WT but not IL-17RA−/− BAMs (genotype, P = 0.0015; treatment, P = 0.0050; interaction, P = 0.0087; two-way ANOVA with Tukey’s multiple-comparison test; n = 5–7 biological replicates per group as shown). k,l, Neocortical application of Ang II impairing endothelial vasodilation (genotype, P = 0.0029; treatment, P = 0.0003; interaction, P = 0.0004; two-way repeated measures ANOVA with Bonferroni’s multiple-comparison test; n = 5 mice per group) (k) and inducing neurovascular dysfunction (genotype, P = 0.0374; treatment, P = 0.0003; interaction, P = 0.0005; two-way repeated measures ANOVA with Bonferroni’s multiple-comparison test; n = 5 mice per group) (l) in WT but not IL-17KO mice. Data are shown as mean ± s.e.m. Schematics created with BioRender.com.

References

    1. Levine DA, Springer MV & Brodtmann A Blood pressure and vascular cognitive impairment. Stroke 53, 1104–1113 (2022). - PMC - PubMed
    1. Muntner P et al. Blood pressure control among us adults, 2009 to 2012 through 2017 to 2020. Hypertension 79, 1971–1980 (2022). - PMC - PubMed
    1. Carey RM, Sakhuja S, Calhoun DA, Whelton PK & Muntner P Prevalence of apparent treatment-resistant hypertension in the United States. Hypertension 73, 424–431 (2019). - PMC - PubMed
    1. Williamson JD et al. Effect of intensive vs standard blood pressure control on probable dementia: a randomized clinical trial. JAMA 321, 553–561 (2019). - PMC - PubMed
    1. Webb AJS & Werring DJ New insights into cerebrovascular pathophysiology and hypertension. Stroke 53, 1054–1064 (2022). - PMC - PubMed