. 2024 Jan;56(1):37-50.
doi: 10.1038/s41588-023-01600-x. Epub 2023 Dec 4.

Perturbational phenotyping of human blood cells reveals genetically determined latent traits associated with subsets of common diseases

Affiliations

Perturbational phenotyping of human blood cells reveals genetically determined latent traits associated with subsets of common diseases

Max Homilius et al. Nat Genet. 2024 Jan.

Abstract

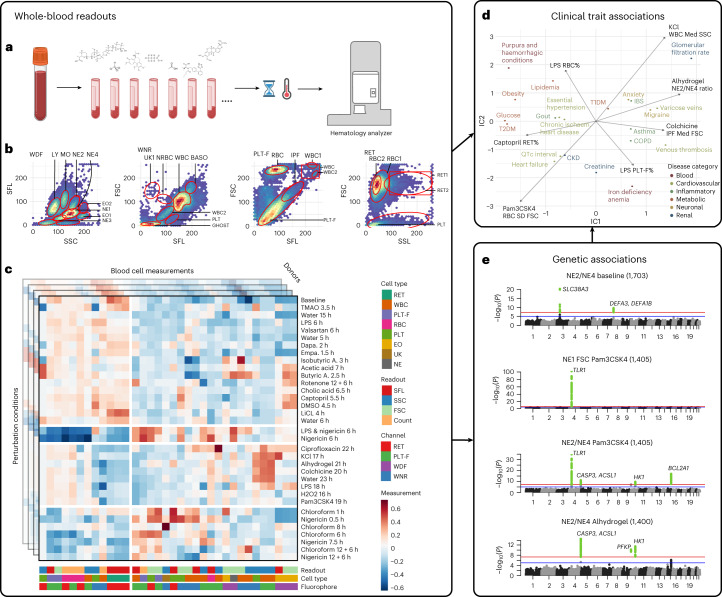
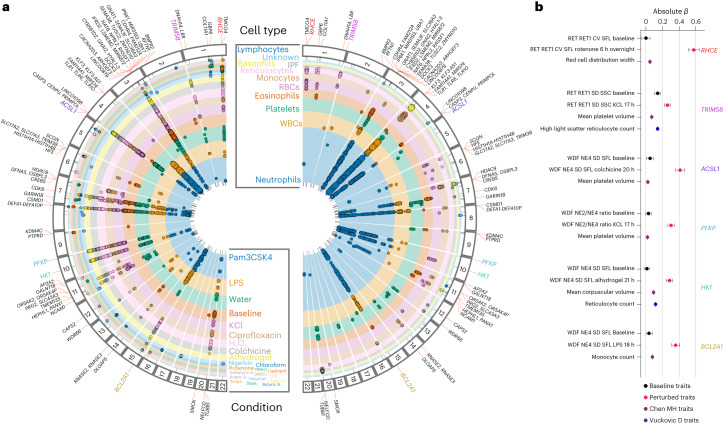
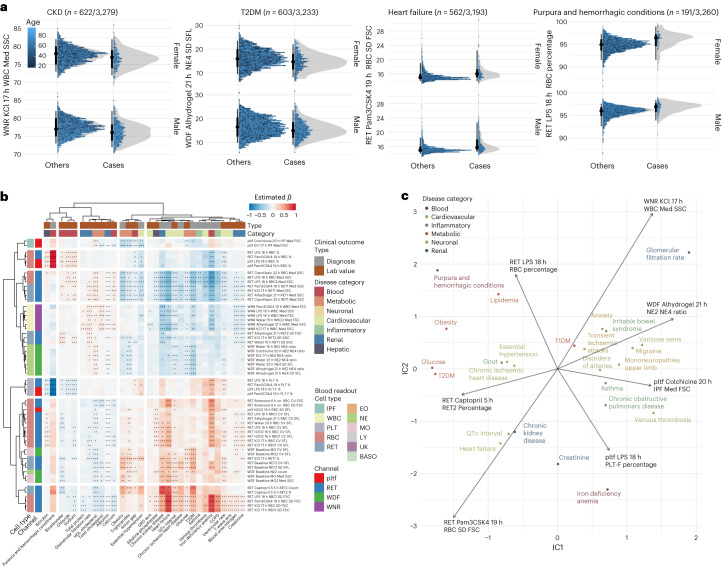
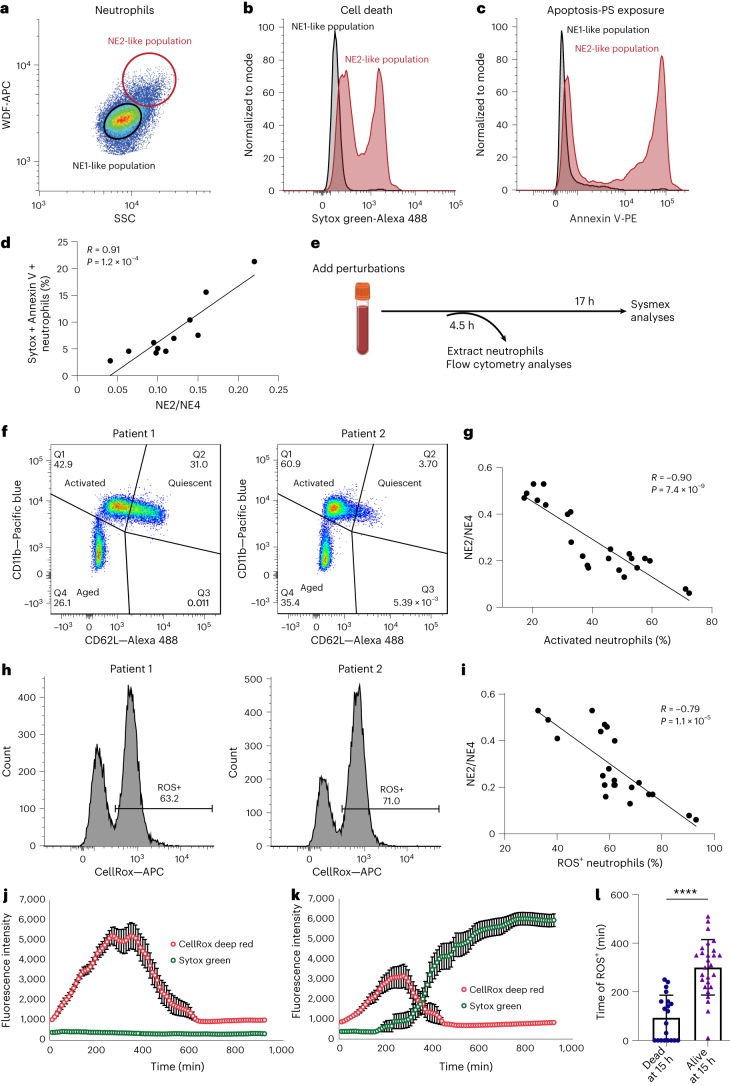
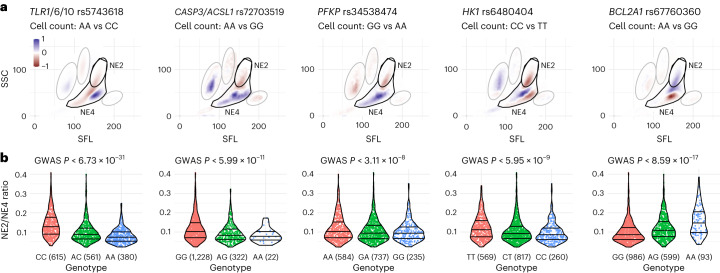
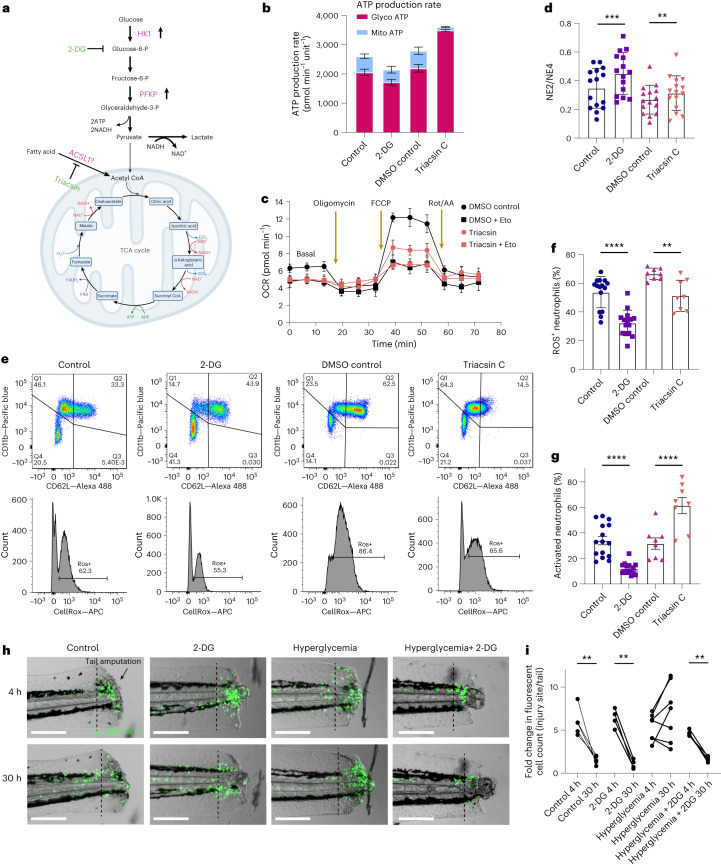
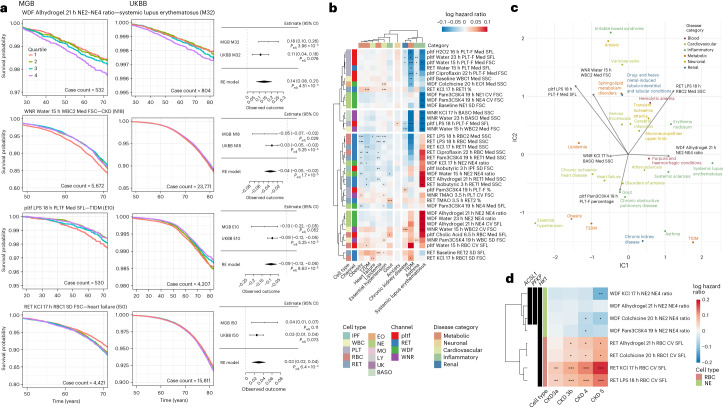
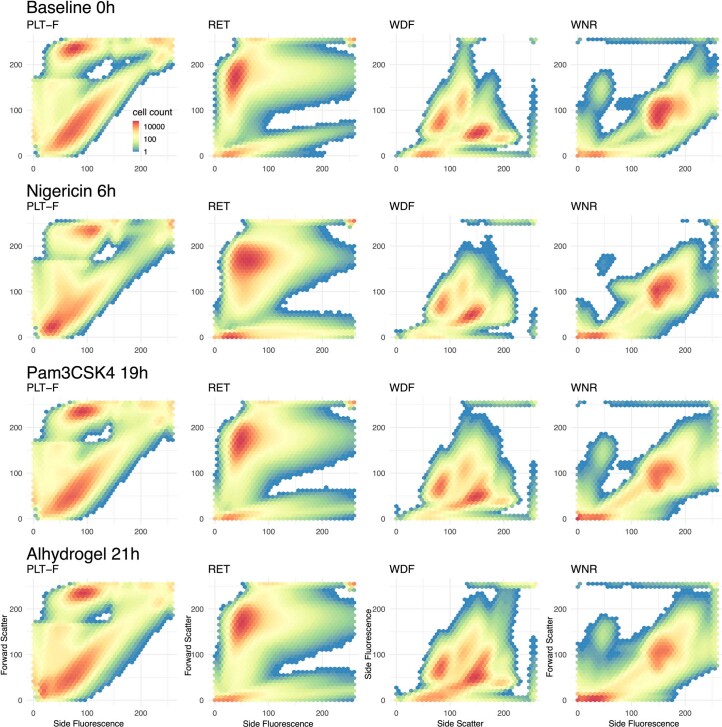
Although genome-wide association studies (GWAS) have successfully linked genetic risk loci to various disorders, identifying underlying cellular biological mechanisms remains challenging due to the complex nature of common diseases. We established a framework using human peripheral blood cells, physical, chemical and pharmacological perturbations, and flow cytometry-based functional readouts to reveal latent cellular processes and performed GWAS based on these evoked traits in up to 2,600 individuals. We identified 119 genomic loci implicating 96 genes associated with these cellular responses and discovered associations between evoked blood phenotypes and subsets of common diseases. We found a population of pro-inflammatory anti-apoptotic neutrophils prevalent in individuals with specific subsets of cardiometabolic disease. Multigenic models based on this trait predicted the risk of developing chronic kidney disease in type 2 diabetes patients. By expanding the phenotypic space for human genetic studies, we could identify variants associated with large effect response differences, stratify patients and efficiently characterize the underlying biology.


Conflict of interest statement

R.C.D. was supported by grants from the National Institutes of Health and the American Heart Association (One Brave Idea, Apple Heart and Movement Study) and is a cofounder of Atman Health. C.A.M. is supported by grants from the National Institutes of Health and the American Heart Association (One Brave Idea, Apple Heart and Movement Study); is a consultant for Bayer, Biosymetrics, Clarify Health, Dewpoint Therapeutics, Dinaqor, Dr. Evidence, Foresite Labs, Insmed, Pfizer and Purpose Life Sciences; and is a cofounder of Atman Health. R.C.D., M.H., C.A.M., S.V. and W.Z. are co-inventors on patents related to this work, and C.A.M., R.C.D., M.H. and W.Z. hold equity in Tanaist. All other authors report no competing interests.

Figures

Fig. 1
Fig. 1. Chemical perturbations expand the phenotypic space of quantitative blood profiles, and blood cell responses are associated with clinical phenotypes and genetic variants.
a, Recruitment setting and application of a standard hematological analyzer for CBC together with perturbation agents to systematically measure cellular responses in whole-blood samples across a clinical cohort. b, Data-driven gating strategy for four Sysmex channels, including WDF, WNR, PLT-F, and RET channels. Gates were defined according to known and new cellular states in response to perturbation conditions. c, Cell gates were used to derive high-dimensional quantitative readouts for 278 blood cell parameters across 37 environmental conditions including inflammatory stimuli (LPS and Pam3CSK4), heat or approved and experimental compounds (dapagliflozin, empagliflozin and captopril). Each perturbation condition was measured for up to 3,300 individuals (see Supplementary Table 1 for a description of conditions and Extended Data Fig. 3 for a projection of blood-response readouts). d, Blood parameters and response to perturbation conditions were associated with clinical phenotypes such as ICD10 diagnostic codes and lab measurements. e, The perturbation screening setting yielded many genetic associations that were specific to blood cell types and environmental stimuli. By comparing similar conditions in the same cohort, detailed comparisons between perturbation conditions and specific associated blood parameters were possible. LPS, lipopolysaccharide; QTc, corrected QT interval.
Fig. 2
Fig. 2. Whole-blood perturbational profiling yields a wide range of genetic associations for specific conditions and cell types.
a, Genome-wide significant associations with P < 5 × 10−8 colored by perturbation condition (left) and cell type (right). Two-sided P values are based on t tests in linear regression models and are not adjusted for multiple testing. Circle size is proportional to −log10(P value). Nearby genes are annotated based on proximity. For clarity, only a subset of readouts is shown for loci with many significant associations (see Table 1 for an overview of traits, cell types, candidate genes and previously reported blood-trait associations and Supplementary Data 1 for a full listing of associations). b, Comparison of β coefficients for six of the most significant variants across multiple traits and genes. For these readouts, perturbation conditions led to large effect size changes that were not observed at baseline. For our study, the variants shown are rs644592 (RHCE, n = 943), rs3811444 (TRIM58, n = 1,410), rs12513029 (ACSL1, n = 1,296), rs34538474 (PFKP, n = 1,339), rs6480404 (HK1, n = 1,378) and rs67760360 (BCL2A1, n = 1,424). For the studies in refs. ,, which included over 400,000 individuals, the variants shown are the reported variants with the lowest P value for each gene. Data are presented as absolute estimated β coefficient ±s.e.m.
Fig. 3
Fig. 3. Blood readouts under perturbation conditions are associated with clinical traits.
a, Distribution of raw blood readouts with associated clinical diagnoses. Each point shows readout for one study participant, stratified by sex and disease status, with color indicating age at blood draw. The gray area illustrates the normalized density of readouts for each subgroup. b, Pairwise association between quantile-transformed blood readouts and clinical lab values or diagnostic codes. Association effect sizes were estimated using linear and logistic regression models for quantitative lab measurements and binary traits, respectively. Positive associations are shown in red; negative associations are shown in blue. Only associations for a subset of blood traits are shown (see Supplementary Fig. 2 for all blood traits that have significant genetic associations). P values were adjusted for FDR to account for multiple testing across 327 perturbational blood readouts and 50 clinical outcomes, including 20 lab values and 30 diagnoses. Points indicate significant associations with adjusted P value thresholds as follows: one point signifies 0.001, two points signify 0.001 and three points signify 0.0001 (see Supplementary Table 4 for clinical trait definitions using diagnostic codes and Supplementary Data 2 for all association results with FDR < 0.1). c, ICA of the t score matrix of associations between blood readouts and clinical endpoints. Shown is a subset of diagnoses and lab values projected onto the first two independent components together with mixing matrix loadings of selected blood readouts. FDR, false discovery rate; ICA, independent component analysis; T2DM, type 2 diabetes mellitus; T1DM, type 1 diabetes mellitus.
Fig. 4
Fig. 4. NE2/NE4 measures neutrophil death and anti-correlates with neutrophil pro-inflammatory responses.
a, Flow cytometry analysis of isolated neutrophils stained with the Sysmex WDF dye (WDF-APC). NE2-like population is defined as the cells showing elevated SSC and WDF dye intensity. NE1-like population is defined as the main neutrophil population with lower SSC and WDF dye intensity. b, Distribution of Sytox-green intensity comparing the NE1- and NE2-like populations. c, Distribution of intensities of PE-conjugated Annexin V, comparing NE1- and NE2-like populations. d, Relationship between Sysmex NE2/NE4 readout and the percentage of Sytox-green and Annexin V-positive neutrophils from blood samples incubated at 39 °C for 17 h. Each data point represents one donor (n = 11). e, Schematics of experimental workflow for comparing neutrophil activation and ROS content at the 4.5 h time point and Sysmex readout at the 17 h time point for the same blood sample. The illustration was created with BioRender. f, Flow cytometry analysis of isolated neutrophils stained with Alexa 488 conjugated CD62L and Pacific blue conjugated CD11b from two representative patient samples. g, Relationship between the percentage of activated neutrophils at 4.5 h and the Sysmex NE2/NE4 readout at 17 h for the same donors. Each data point indicates one donor (n = 24). h, Histogram of the intensity of CellROX deep red of isolated neutrophils from two representative patient samples. i, Relationship between the percentage of ROS-positive neutrophils at 4.5 h and the Sysmex NE2/NE4 readout at 17 h for the same donors. Each data point represents a donor (n = 24). j,k, Time-dependent transient of CellROX deep red (ROS) and Sytox green (cell death) of neutrophils that survived till 15 h (j) (n = 27) and died before 15 h (k) (n = 20). Error bars indicate s.e.m. l, Time of neutrophils become ROS-positive comparing cells that survived till 15 h (n = 27) and died before 15 h (n = 20). Error bars indicate s.d. Unpaired two-sided t test was used to calculate P value. P = 1.7 × 10−8. Each data point indicates an individual neutrophil. In d, g and i, R indicates Pearson correlation coefficient. Two-sided P values are shown.
Fig. 5
Fig. 5. A neutrophil population that emerges in response to inflammatory stimuli and long heat exposure is linked to multiple genetic variants.
a, Comparison of flow cytometry measurements in the WDF channel between homozygotes for multiple loci (TLR1, CASP3/ACSL1, PFKP, HK1 and BCL2A1) in response to Pam3CSK4 19 h perturbation. Color gradient shows the difference in cell count distribution between homozygotes for the major and minor alleles. Cell count distributions were calculated by normalizing counts to the total cells measured for each group of homozygotes. b, Comparison of NE2/NE4 ratios among individuals with different genotypes at the indicated loci. Two-sided P values are based on t tests in linear regression models and are not adjusted for multiple testing. Genotype counts are shown in parentheses, with totals ranging from 1,556 to 1,678 donors for each locus. Violin plots show a smoothed distribution of all donors (points) and markings inside the violin at the 25th, 50th and 75th percentiles.
Fig. 6
Fig. 6. HK1, PFKP and ACSL1 regulate neutrophils’ metabolic profile and inflammatory responses.
a, Schematics showing the regulatory function of HK1, PFKP and ACSL1 in neutrophil metabolic pathways. The lead SNPs identified are associated with upregulated expression of HK1 and PFKP and unknown directionality for ACSL1 (OpenTargets Genetics database). The illustration was created with BioRender.com. b, Seahorse analysis of isolated neutrophils showing ATP produced from the mitochondria and the anaerobic glycolysis pathways in conditions of water control, 2-DG, DMSO control and triacsin C. Five replicates were performed for the same donor. Error bars shown indicate s.e.m. of measurements from four donors’ blood samples. c, Seahorse analysis long-chain FAO rate in neutrophils treated with triacsin C and DMSO control. Five replicates were performed for the same donor. Error bars shown indicate s.e.m. of measurements from four donors’ blood samples. d, Sysmex NE2/NE4 readout of blood treated with 2-DG, compared to water as control, and triacsin C, compared to DMSO as control. Measurements were performed after 17 h incubation at 39 °C. Each data point represents a donor (n = 15). Error bars indicate s.d. e, Flow analysis of isolated neutrophils stained with Alexa 488 conjugated CD62L, Pacific blue conjugated CD11b and CellROX. Shown are representative dot plot and histogram from one representative sample, comparing water control, 2-DG, DMSO control and triacsin C conditions. f,g, Percentage of ROS-positive (f) and activated (g) neutrophils at 4.5 h post-treatment of water control, 2-DG, DMSO control and triacsin C. Each data point represents a donor (n = 16 for control and 2-DG, n = 8 for DMSO control and triacsin C). Error bars indicate s.d. h, Visualization of neutrophils in Tg (mpo:GFP) zebrafish at 4 h and 30 h post tail transection, comparing control, 2-DG, hyperglycemia and 2-DG under hyperglycemia conditions. Images show four representative zebrafish. Scale bars indicate 200 µm. i, Quantification of GFP+ cells at the tail transection site at 4 h and 30 h under control (n = 5), 2-DG (n = 4), hyperglycemia (n = 7) and 2-DG under hyperglycemia (n = 5) conditions. Each data point indicates an individual zebrafish. Paired two-sided t test was used to test statistical significance shown in d, f, g and i. **P < 0.01, ***P < 0.001 and ****P < 0.0001.
Fig. 7
Fig. 7. PGSs calculated from perturbation-based blood responses are associated with differences in time to onset of diseases.
a, Survival curves and meta-analysis for diagnoses stratified by blood-response PGSs in MGB Biobank and UKBB. Time to first diagnostic code or diagnosis date in medical problem list was modeled using sex, first two genetic principal components and scaled blood-response scores in MGB and UKBB using Cox PH models with delayed entry. Meta-analysis panels show estimated log HR and 95% CI. Two-sided P values for MGB and UKBB were obtained from Cox PH models, and from z scores in a random-effect model for the meta-analyses. All P values are corrected for multiple testing using FDR. b, Hazard ratio estimates derived from time-to-event models for various clinical outcomes, using PGS of blood readouts under perturbation conditions. These estimates were based on a meta-analysis of data from the MGB Biobank and UKBB. Time to first diagnostic code or diagnosis date in medical problem list was modeled using sex, first two genetic principal components and scaled blood-response scores using Cox PH models with delayed entry. A meta-analysis was conducted to derive two-sided P values, using z scores in random-effect models that combined data from both cohorts. Points indicate significant associations after multiple testing correction using FDR across all tested diseases and blood traits (30 clinical outcomes and 327 blood readouts) with adjusted P value thresholds as follows: one solid square signifies 0.05, two solid squares signify 0.01 and three solid squares signify 0.001 (see Supplementary Fig. 3 for an overview of all PGS-disease associations). c, ICA of the association score matrix between blood readout PGSs and clinical endpoints. A subset of diagnoses and lab values projected onto the first two components together with mixing matrix loadings of selected blood readouts is shown. d, Hazard ratio estimates for the progression to different CKD stages in individuals with prediabetes and diabetes using PGS of blood traits that had significant associations with ACSL1, PFKP or HK1 in the MGB Biobank. Cox PH models were applied to analyze time until the initial diagnosis of each CKD stage, using two-sided tests for statistical evaluation. Points indicate significant associations after multiple testing correction using FDR with adjusted P value thresholds as follows: one solid square signifies 0.05, two solid squares signify 0.01 and three solid squares signify 0.001.
Extended Data Fig. 1
Extended Data Fig. 1. Blood cell distributions under baseline and perturbation conditions.
Distribution of blood cytometry readouts under baseline and three perturbation conditions. Aggregate counts for each bin were calculated across all samples for each condition and normalized to the number of cells measured in each channel. Each channel records three dimensions (forward scatter, side scatter and side fluorescence). Plots show the two dimensions used for gating cell types in each channel.
Extended Data Fig. 2
Extended Data Fig. 2. Blood cell distribution and gates in WDF Channel for technical replicates from the same blood draw and measurements from the same individuals over time.
a, Examples of blood cell distributions in the WDF channel for three technical replicates of four randomly selected donors under baseline and Pam3CSK4 19 h conditions. Replicates were performed on samples collected from the same blood draw. b, Examples of blood cell distributions in the WDF channel for three longitudinal replicates of four randomly selected donors under baseline and Pam3CSK4 19 h conditions. Replicates were performed on the same donor from samples collected at different time points that are months apart. c, Examples of three blood traits calculated from our flow cytometry gates (NE2/NE4 ratio, RBC1 Med SSC, and PLT-F CV SFL) under baseline and Pam3CSK4 19 h conditions for data collected over the course of four months. The black dots shown indicate all study participants. The time-dependent trajectories of four donors (same individuals as shown in b) were plotted in colors. Boxplots for daily measurements represent the interquartile range (IQR) between the first and third quartiles as the box, the median as the line inside the box, and the whiskers extend from the box to the largest and smallest values within 1.5× IQR, with any points outside of this range shown as individual outliers.
Extended Data Fig. 3
Extended Data Fig. 3. Blood readouts with significant genetic associations form clusters based on cell type, readout, perturbation condition and associated genetic loci.
Distance correlations between all pairs of blood trait readouts with significant genetic associations were projected into a 2-dimensional embedding using UMAP. Each trait is assigned a color by the cell type, the type of readout, associated candidate genes at the GWAS locus and the perturbation condition.
Extended Data Fig. 4
Extended Data Fig. 4. Neutrophil response to TLR1/TLR2 ligand Pam3CSK4.
a, NE2/NE4 ratio from Sysmex readout at 17 h in blood incubated with Pam3CSK4, compared to control. n = 15 donors’ blood samples were examined. Error bars indicate s.d. b, Dose-dependent effect of Pam3CSK4 on NE2/NE4 ratio at 17 h post incubation. n = 9 donors’ blood samples were tested. c, Flow cytometry analysis of isolated neutrophils stained with Alexa 488 conjugated CD62L and Pacific blue conjugated CD11b under untreated and Pam3 conditions. d, Histogram of CellRox in neutrophils isolated from blood with or without Pam3CSK4 treatment. e, Percentage of neutrophil activation under control (n = 15 donors’ blood samples) or Pam3CSK4 conditions (n = 14 donors’ blood samples). Error bars indicate s.d. f, Percentage of ROS+ neutrophils under control (n = 15 donors’ blood samples) and Pam3CSK4 (n = 14 donors’ blood samples) conditions. Error bars indicate s.d. g, Time of neutrophils stay ROS positive under control (n = 20 neutrophils from 3 donors) and Pam3CSK4 (n = 27 neutrophils from 3 donors) conditions. Error bars indicate s.d. h, Seahorse analysis of isolated neutrophils showing ATP produced from the mitochondria and the anaerobic glycolysis pathways in conditions of control and PAM3CSK4 treated. Five replicates were performed for the same donor. Error bars shown indicate s.e.m. of measurements from four donors’ blood samples. Paired two-sided t-test was used to determine statistical significance in a, e, and f. Unpaired two-sided t-test was used in g. **P < 0.01, and ****P < 0.0001.
Extended Data Fig. 5
Extended Data Fig. 5. CRISPR-Cas9 knockdown of hk1, pfkpa/pfkpb, and acsl1a/acsl1b in zebrafish promotes neutrophil clearance after tail injury in hyperglycemia.
a-d, Quantification of GFP+ cells at the tail transection site at 4 h and 24 h under control, and hyperglycemia conditions for control Tracer RNA injected (a, control n = 12, hyperglycemia n = 15), hk1 (b, control n = 7, hyperglycemia n = 12), pfkpa/pfkpb (c, control n = 8, hyperglycemia n = 9), and acsl1a/acsl1b (d, control n = 9, hyperglycemia n = 8) gRNA injected zebrafish. Each data point indicates an individual zebrafish. Paired two-sided non-parametric test (Wilcoxon test) was used to determine P values. *P < 0.05, **P < 0.01, and ***P < 0.001.
Extended Data Fig. 6
Extended Data Fig. 6. Genetic associations for selected traits across different ancestry groups.
Forest plots of ancestry-specific associations for selected lead SNPs. Each plot shows estimated log HR and 95% CI across distinct ancestry groups after harmonizing the effect allele. Genotype counts are shown in parentheses. Asterisks next to each ancestry group denote levels of significance reached: *P < 0.05, **P < 0.01, ***P < 0.001. The size of the squares represents the weight of each study in the meta-analysis. The diamond at the bottom of each forest plot represents the combined effect size and its confidence interval from the multi-ancestry meta-analysis. The SNPs shown are rs644592 (RHCE), rs67760360 (BCL2A1), rs6480404 (HK1) and rs5743618 (TLR1).

References

    1. Martínez-Jiménez F, et al. A compendium of mutational cancer driver genes. Nat. Rev. Cancer. 2020;20:555–572. - PubMed
    1. Green RH, et al. Asthma exacerbations and sputum eosinophil counts: a randomised controlled trial. Lancet. 2002;360:1715–1721. - PubMed
    1. Gertz MA, Dispenzieri A. Systemic amyloidosis recognition, prognosis, and therapy. JAMA. 2020;324:79–89. - PubMed
    1. Burton PR, et al. Genome-wide association study of 14,000 cases of seven common diseases and 3,000 shared controls. Nature. 2007;447:661–678. - PMC - PubMed
    1. Visscher PM, et al. 10 Years of GWAS discovery: biology, function, and translation. Am. J. Hum. Genet. 2017;101:5–22. - PMC - PubMed