. 2024 Jan;56(1):60-73.
doi: 10.1038/s41588-023-01592-8. Epub 2023 Dec 4.

The role of APOBEC3B in lung tumor evolution and targeted cancer therapy resistance

Deborah R Caswell #  1 Philippe Gui #  2 Manasi K Mayekar #  2 Emily K Law  3 Oriol Pich  4 Chris Bailey  4 Jesse Boumelha  5 D Lucas Kerr  2 Collin M Blakely  2 Tadashi Manabe  2 Carlos Martinez-Ruiz  6   7 Bjorn Bakker  4 Juan De Dios Palomino Villcas  8 Natalie I Vokes  9   10 Michelle Dietzen  4   6   7 Mihaela Angelova  4 Beatrice Gini  2 Whitney Tamaki  2 Paul Allegakoen  2 Wei Wu  2 Timothy J Humpton  11   12   13 William Hill  4 Mona Tomaschko  5 Wei-Ting Lu  4 Franziska Haderk  2 Maise Al Bakir  4 Ai Nagano  4 Francisco Gimeno-Valiente  7 Sophie de Carné Trécesson  5 Roberto Vendramin  4 Vittorio Barbè  4 Miriam Mugabo  7 Clare E Weeden  4 Andrew Rowan  4 Caroline E McCoach  14 Bruna Almeida  15   16 Mary Green  17 Carlos Gomez  2 Shigeki Nanjo  2 Dora Barbosa  2 Chris Moore  5 Joanna Przewrocka  4 James R M Black  4   6   7 Eva Grönroos  4 Alejandro Suarez-Bonnet  17   18 Simon L Priestnall  17   18 Caroline Zverev  19 Scott Lighterness  19 James Cormack  19 Victor Olivas  2 Lauren Cech  2 Trisha Andrews  2 Brandon Rule  20 Yuwei Jiao  21 Xinzhu Zhang  21 Paul Ashford  22 Cameron Durfee  23 Subramanian Venkatesan  4 Nuri Alpay Temiz  24   25 Lisa Tan  2 Lindsay K Larson  3 Prokopios P Argyris  3   26   27 William L Brown  3 Elizabeth A Yu  2   28 Julia K Rotow  29 Udayan Guha  30   31 Nitin Roper  32 Johnny Yu  33 Rachel I Vogel  34 Nicholas J Thomas  2 Antonio Marra  35 Pier Selenica  36 Helena Yu  37   38 Samuel F Bakhoum  39   40 Su Kit Chew  4 Jorge S Reis-Filho  37 Mariam Jamal-Hanjani  7   41   42 Karen H Vousden  11 Nicholas McGranahan  6   7 Eliezer M Van Allen  43 Nnennaya Kanu  7 Reuben S Harris  23   44 Julian Downward  5 Trever G Bivona  45   46 Charles Swanton  4   7
Affiliations

The role of APOBEC3B in lung tumor evolution and targeted cancer therapy resistance

Deborah R Caswell et al. Nat Genet. 2024 Jan.

Abstract

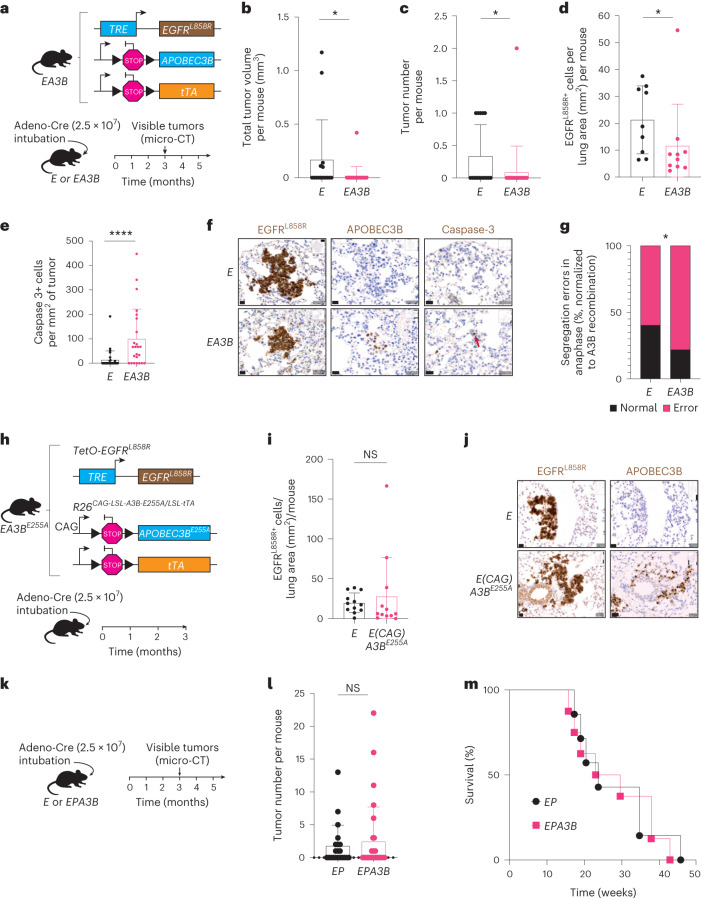
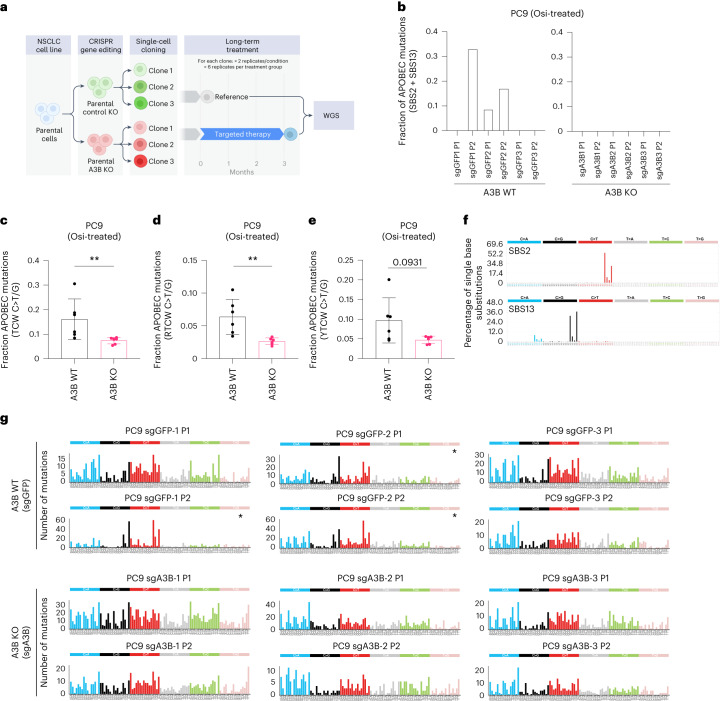
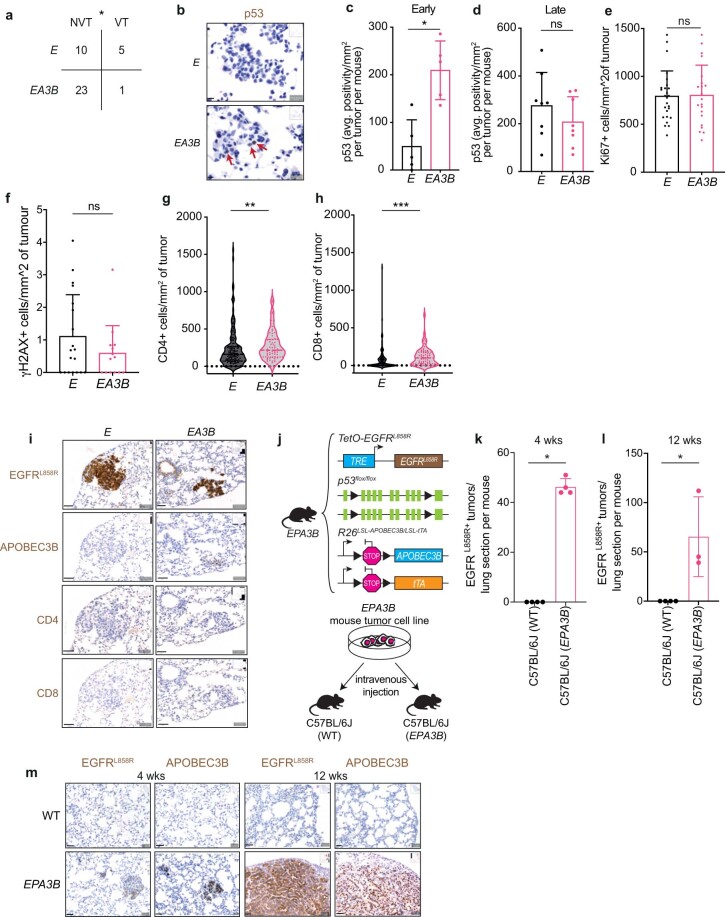
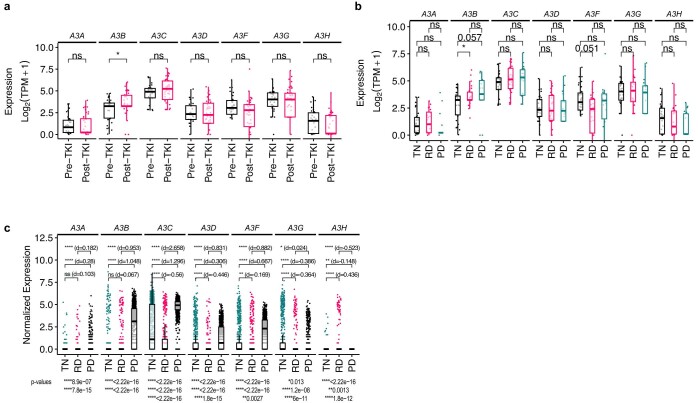
In this study, the impact of the apolipoprotein B mRNA-editing catalytic subunit-like (APOBEC) enzyme APOBEC3B (A3B) on epidermal growth factor receptor (EGFR)-driven lung cancer was assessed. A3B expression in EGFR mutant (EGFRmut) non-small-cell lung cancer (NSCLC) mouse models constrained tumorigenesis, while A3B expression in tumors treated with EGFR-targeted cancer therapy was associated with treatment resistance. Analyses of human NSCLC models treated with EGFR-targeted therapy showed upregulation of A3B and revealed therapy-induced activation of nuclear factor kappa B (NF-κB) as an inducer of A3B expression. Significantly reduced viability was observed with A3B deficiency, and A3B was required for the enrichment of APOBEC mutation signatures, in targeted therapy-treated human NSCLC preclinical models. Upregulation of A3B was confirmed in patients with NSCLC treated with EGFR-targeted therapy. This study uncovers the multifaceted roles of A3B in NSCLC and identifies A3B as a potential target for more durable responses to targeted cancer therapy.


Conflict of interest statement

T.G.B. is an advisor to Novartis, AstraZeneca, Revolution Medicines, Array/Pfizer, Springworks, Strategia, Relay, Jazz, Rain, Engine, Granule Therapeutics and EcoR1 and receives research funding from Novartis and Revolution Medicines, Kinnate, Verastem and Strategia. N.I.V. served on an advisory board for Sanofi Genzyme. C.S. acknowledges grants from AstraZeneca, Boehringer-Ingelheim, Bristol Myers Squibb, Pfizer, Roche-Ventana, Invitae (previously Archer Dx—collaboration in minimal RD sequencing technologies), Ono Pharmaceutical, and Personalis. He is the chief investigator for the AZ MeRmaiD 1 and 2 clinical trials and is the Steering Committee Chair. He is also co-chief investigator of the NHS Galleri trial funded by GRAIL and a paid member of GRAIL’s Scientific Advisory Board (SAB). He receives consultant fees from Achilles Therapeutics (also an SAB member), Bicycle Therapeutics (also an SAB member), Genentech, Medicxi, China Innovation Center of Roche (CICoR) formerly Roche Innovation Center—Shanghai, Metabomed (until July 2022), Relay Therapeutics and the Sarah Cannon Research Institute. C.S. has received honoraria from Amgen, AstraZeneca, Bristol Myers Squibb, GlaxoSmithKline, Illumina, MSD, Novartis, Pfizer and Roche-Ventana; has previously held stock options in Apogen Biotechnologies and GRAIL; currently has stock options in Epic Bioscience and Bicycle Therapeutics and has stock options and is a cofounder of Achilles Therapeutics. C.S. declares a patent application (PCT/US2017/028013) for methods to lung cancer; targeting neoantigens (PCT/EP2016/059401); identifying patent response to immune checkpoint blockade (PCT/EP2016/071471), determining HLA LOH (PCT/GB2018/052004); predicting survival rates of patients with cancer (PCT/GB2020/050221), identifying patients who respond to cancer treatment (PCT/GB2018/051912); methods for lung cancer detection (US20190106751A1). He is an inventor on a European patent application (PCT/GB2017/053289) relating to assay technology to detect tumor recurrence. This patent has been licensed to a commercial entity, and under their terms of employment, C.S. is due a revenue share of any revenue generated from such license(s). E.M.V.A. is a consultant for Tango Therapeutics, Genome Medical, Invitae, Enara Bio, Janssen, Manifold Bio, Monte Rosa; receives research funding from Novartis, BMS; has equity in Tango Therapeutics, Genome Medical, Syapse, Enara Bio, Manifold Bio, Microsoft and Monte Rosa; has received travel reimbursement from Roche/Genentech and own institutional patents filed on chromatin mutations and immunotherapy response, and methods for clinical interpretation. C.E.M. is on the advisory board of Genentech; receives honoraria from Novartis, Guardant, Research and receives funding from Novartis, Revolution Medicines. C.M.B. is a consultant for Amgen, Foundation Medicine, Blueprint Medicines and Revolution Medicines; receives research funding from Novartis, AstraZeneca and Takeda and receives institutional research funding from Mirati, Spectrum, MedImmune and Roche. J.S.R.-F. reports receiving personal/consultancy fees from Goldman Sachs, Bain Capital, REPARE Therapeutics, Saga Diagnostics and Paige.AI, membership of the SAB of VolitionRx, REPARE Therapeutics and Paige.AI, membership of the Board of Directors (BOD) of Grupo Oncoclinicas, and ad hoc SAB of Astrazeneca, Merck, Daiichi Sankyo, Roche Tissue Diagnostics and Personalis, outside the scope of this study. H.Y. receives consulting fees from AstraZeneca, Daiichi, Taiho, Janssen, AbbVie, Blueprint, Black Diamond Research funding to my institution from AstraZeneca, Daiichi, Cullinan, Janssen, Blueprint, Black Diamond, Novartis, Pfizer, ERASCA. S.F.B. owns equity in, receives compensation from, serves as a consultant for and serves on the SAB and BOD of Volastra Therapeutics. He serves on the scientific advisory board of Meliora Therapeutics. M.J.-H. has consulted for, and is a member of, the Achilles Therapeutics Scientific Advisory Board and Steering Committee; has received speaker honoraria from Pfizer, Astex Pharmaceuticals, Oslo Cancer Cluster and Bristol Myers Squibb and is listed as a co-inventor on a European patent application relating to methods to detect lung cancer (PCT/US2017/028013). This patent has been licensed to commercial entities and, under terms of employment, M.J.-H. is due a share of any revenue generated from such license(s). The other authors have no competing interests to declare.

Figures

Fig. 1
Fig. 1. Continuous APOBEC3B expression is detrimental for tumorigenesis in a p53 WT EGFRL858R mouse model of lung cancer.
a, Tumorigenesis in E (TetO-EGFRL858R; Rosa26LNL-tTA) and EA3B (TetO-EGFRL858R; Rosa26LNL-tTA/LSL-A3Bi) mice was induced using the indicated viral titer. Tumor growth was assessed by micro-CT analysis. b, Total tumor volume per mouse at 3 months postinduction quantified by micro-CT analysis (E, n = 15; EA3B, n = 24; mean ± s.d., two-sided Mann–Whitney test, *P = 0.0163, each dot represents a mouse). c, Total tumor number per mouse at 3 months postinduction quantified by micro-CT analysis (E, n = 15; EA3B, n = 24, mean ± s.d., two-sided Mann–Whitney test, *P = 0.0236, each dot represents a mouse). d, Quantification of EGFRL858R+ cells per lung area (mm2) by IHC staining at 3 months postinduction (E, n = 9; EA3B, n = 10; mean ± s.d., two-sided Mann–Whitney test, *P = 0.0435, each dot represents a mouse). e, Quantification of caspase 3+ cells per mm2 of tumor at 3 months postinduction (E, n = 9; EA3B, n = 10; mean ± s.d., two-sided Mann–Whitney test, ****P < 0.0001, each dot represents a tumor). f, Representative IHC stainings of EGFRL858R, APOBEC3B and caspase-3 (scale bar = 20 µm, arrow indicates positive cell; E, n = 9; EA3B, n = 10 biological replicates). g, Percent chromosome missegregation errors at 3 months postinduction (two-sided Fisher’s exact test, *P = 0.016; E, n = 9; EA3B, n = 10). h, Tumorigenesis in E and E(CAG)A3BE255A mice was induced using the indicated viral titer (2.5 × 107 viral particles per mouse). i, Quantification of EGFRL858R+ cells per lung area (mm2) by IHC staining at 3 months postinduction (E, n = 12; E(CAG)A3BE255A, n = 12; mean ± s.d., each dot represents a mouse). j, Representative IHC staining of EGFRL858R and APOBEC3B (scale bar = 20 µm; E, n = 12; E(CAG)A3BE255A, n = 12). k, Tumor growth was assessed by micro-CT analysis in EP and EPA3B mice. l, Total tumor number per mouse at 3 months postinduction quantified by micro-CT analysis (EP, n = 21; EPA3B, n = 30; combined from two separate experiments). m, Survival curve of EP versus EPA3B mice (EP, n = 8; EPA3B, n = 7; each dot represents a mouse). NS, not significant. Source data
Fig. 2
Fig. 2. APOBEC3B expression correlates with multiple measures of CIN, and APOBEC mutagenesis is subclonally enriched in TN EGFRmut patients from the TRACERx421 (Tx421) dataset.
a, Correlation between APOBEC3B (A3B) expression and percent missegregation errors calculated using patients with EGFRmut lung adenocarcinoma (n = 13 tumors; Spearman, R = 0.59; P = 0.038). b, Significant correlation between A3B expression and CIN70 GSEA score calculated using EGFRmut tumors from patients with lung adenocarcinoma (n = 19 tumors; Spearman, R = 0.59; P = 0.009). c, Significant correlation between A3B expression and CIN70 GSEA score calculated using EGFRmut tumor regions in patients with lung adenocarcinoma (n = 42 tumor regions; Spearman, R = 0.64; P < 9 × 10−6). d, Correlation between A3B expression and subclonal CIN fraction calculated in EGFRmut patients with lung adenocarcinoma (n = 19 tumors; bootstrapped Spearman, R = 0.5; P = 0.032). e, Significant correlation between percent missegregation errors (anaphase bridges (bridges) and lagging chromosomes (lagging)) and CIN70 score calculated using tumors from patients (n = 112 tumors; Spearman, R = 0.27; P = 0.0038). f, Significant correlation between A3B expression and CIN70 GSEA score calculated using tumors from patients with lung adenocarcinoma (n = 188 tumors; Spearman, R = 0.56; P < 2 × 10−16). g, Significant correlation between A3B expression and CIN70 GSEA score calculated using tumor regions in patients with lung adenocarcinoma (n = 466 tumor regions; Spearman, R = 0.54; P < 2 × 10−16). h, Correlation between A3B expression and subclonal CIN fraction calculated patients with lung adenocarcinoma in the Tx421 cohort (n = 168 tumors; bootstrapped Spearman, R = 0.26; P = 0.00087). i, Comparisons between C>T and C>G mutation counts at TCN and TCW trinucleotide context and percentage of genome altered subclonally (n = 25, two-sided Pearson, TCW R = 0.49, P = 0.015; TCN R = 0.52, P = 0.0092). j, Comparison of clonal and subclonal APOBEC-associated mutation signature (clonal APOBEC–subclonal APOBEC) in patients with EGFR driver mutations (1, 1a, exon 19 deletion). White bars indicate that the patient is TP53 WT or has a subclonal TP53 mutation. Red bars indicate that the patient has a clonal TP53 mutation (n = 23, one-sided Wilcoxon, P = 1 × 10−4). k, Number of APOBEC-associated mutations in patients with EGFR driver mutations (1, 1a, exon 19 deletion). Colors indicate clonal or subclonal APOBEC or non-APOBEC-associated mutations (n = 23). All analyses were performed on samples from the Tx421 cohort. GSEA, gene set enrichment analysis; NES, normalized enrichment score; TMM, trimmed mean of M values.
Fig. 3
Fig. 3. APOBEC3B drives targeted therapy resistance in mouse and human preclinical models.
a, TetO-EGFRL858R;CCSP-rtTA;R26LSL-APOBEC3B/Cre-ER(T2) mice with or without induction of subclonal APOBEC3B (A3B) with TKI therapy (erlotinib). b, Fraction of tumor grade, not present or hyperplasia only. Bronchioloalveolar adenoma or carcinoma at 5 months (Ei, n = 19; EA3Bi, n = 19; two-sided Fisher’s exact test, **P = 0.0044). c, Tumor nodules per lung section per mouse at 5 months (Ei, n = 19; EA3Bi, n = 19; two-sided Mann–Whitney test, *P = 0.0443). d, Tumor area per lung area per mouse at 5 months (Ei, n = 19; EA3Bi, n = 19; two-sided Mann–Whitney test, *P = 0.0212). e, Representative IHC staining of EGFRL858R and A3B (scale bar = 100 µm and 20 µm; Ei, n = 19; EA3Bi, n = 19 biological replicates). f, A3B+ cells per mm2 of tumor per mouse (EA3Bi −TKI = 151, EA3Bi +TKI = 52, two-sided Mann–Whitney test, ****P < 0.0001). g, Induction of subclonal A3B using TetO-EGFRL858R;CCSP-rtTA;R26Cre-ER(T2)/+ or TetO-EGFRL858R;CCSP-rtTA;R26LSL-APOBEC3B/Cre-ER(T2) mice with continuous TKI therapy (erlotinib). h, Tumor nodules per lung section per mouse (Ei, n = 13; EA3Bi, n = 17; two-sided Mann–Whitney test, **P = 0.0086). i, Fraction of tumor grade, not present or hyperplasia only. Bronchioloalveolar adenoma or carcinoma at 11 months (Ei, n = 13; EA3Bi, n = 17; two-sided Fisher’s exact test). j, Quantification of UNG+ cells per mm2 of tumor at 5 months postinduction (E, n = 10; EA3Bi, n = 10; two-tailed t test, *P = 0.0226, each dot represents a tumor). k, Representative IHC staining of EGFRL858R and UNG. Scale bar = 50 µm. ln, CellTiter-Glo viability timecourse assays performed on A3B-deficient or A3B-proficient PC9 cells treated with 100 nM Osi (l, n = 3 biological replicates, mean ± s.d., two-sided t test, *P = 0.0439, *P = 0.0155, *P = 0.0168); HCC827 cells treated with 100 nM Osi (m, n = 3 biological replicates, mean ± s.d., two-sided t test, *P = 0.0377, **P = 0.0029, ****P = 0.0004, ****P = 0.00009); H3122 cells treated with 100 nM alectinib (n, n = 3 biological replicates, mean ± s.d., two-sided t test, *P = 0.0189, **P = 0.0044). Osi, osimertinib.
Fig. 4
Fig. 4. Knockdown of APOBEC3B reduces the TKI therapy-induced APOBEC activity in EGFRmut lung cancer cell lines.
a, RT–qPCR performed on PC9 cells treated with DMSO or 0.5 μM Osi for 18 h, measuring APOBEC3A (A3A), APOBEC3B (A3B), APOBEC3C (A3C) and APOBEC3F (A3F; n = 4 biological replicates, mean ± s.d., one-way ANOVA test, ***P = 0.0002, ****P < 0.0001). b, RT–qPCR analysis of HCC827 cells treated with DMSO or 0.5 μM Osi for 18 h (n = 3 biological replicates, mean ± s.d., one-way ANOVA test, *P = 0.0264, ***P = 0.0005, ***P = 0.0008, ****P < 0.0001). c, APOBEC activity assay performed using nuclear extracts of PC9 cells treated with DMSO or 2 μM Osi for 18 h (n = 3 biological replicates, mean ± s.d., two-tailed t test, ***P = 0.0002). d, APOBEC activity assay using nuclear extracts of HCC827 cells treated with DMSO or 0.4 µM Osi for 18 h (n = 3 biological replicates, mean ± s.d., two-tailed t test, *P = 0.0213). e, Western blot analysis of A3B protein levels in PC9 cells treated with DMSO or 0.5 μM Osi for 18 h with quantification (n = 3 biological replicates, mean ± s.d., two-tailed t test, *P = 0.0129). f, Western blot analysis for A3B protein levels in HCC827 cells treated with DMSO or 0.5 μM Osi for 18 h (n = 3 biological replicates, mean ± s.d., two-tailed unpaired t test, **P = 0.0082). g, APOBEC activity assay performed on lysates of PC9 or HCC827 cells treated with DMSO or 0.5 μM Osi for 18 h, with siRNA knockdown of APOBEC3A (siA3A), APOBEC3B (siA3B), APOBEC3C (siA3C) and APOBEC3F (siA3F) and nontargeting siRNA (siNTC), and quantification (PC9, n = 4 biological replicates, mean ± s.d., one-way ANOVA test (nonparametric), **P = 0.0017; HCC827, n = 3 biological replicates, mean ± s.d., one-way ANOVA test (nonparametric), **P = 0.0076). ANOVA, analysis of variance.
Fig. 5
Fig. 5. Treatment with TKI induces APOBEC3B upregulation.
a, GSEA of the indicated GEO2R datasets of EGFR-driven cellular models of human lung adenocarcinoma treated with erlotinib or a mitogen-activated protein kinase kinase (MAP2K or MEK1) inhibitor (AZD6244). b, RNA-seq analysis of gene expression changes in PC9 cells treated with 2 μM Osi for 9 d relative to DMSO-treated cells (n = 3 biological replicates, mean ± s.d., ANOVA test). c, RT–qPCR analysis of PC9 cells treated with DMSO or 2 μM Osi for 18 h (n = 4 biological replicates, mean ± s.d., one-way ANOVA test, *P = 0.0349, ****P < 0.0001). d, RT–qPCR analysis of HCC827 cells treated with DMSO or 0.4 μM osimertinib for 18 h (n = 4 biological replicates, mean ± s.d., one-way ANOVA test, ***P = 0.0008, **P = 0.0014). e, Western blot analysis of cells treated in a and b (CYTO, cytoplasmic extracts; H3, histone H3; NUC, nuclear extracts) with quantification of A3B levels in PC9 cells (n = 3 biological replicates, mean ± s.d., one-way ANOVA test, **P = 0.0012, **P = 0.0058) and HCC827 cells (n = 3 biological replicates, mean ± s.d., one-way ANOVA test, *P = 0.0186). f, RT–qPCR analysis of PC9 cells treated with nontargeting siRNA (siNTC) or EGFR siRNA (siEGFR) for 18 h and grown for 2 d (n = 4 biological replicates, mean ± s.d., two-sided t test, **P = 0.0075, ***P = 0.0002, **P = 0.0027). FC, fold change.
Fig. 6
Fig. 6. APOBEC3B is required for APOBEC signature accumulation in Osi-treated human NSCLC cell line PC9.
a, Outline of WGS long-term TKI treatment experiment on APOBEC3B (A3B)-deficient and A3B-proficient PC9 single-cell clone lines. Figure created in BioRender.com. b, Focused plots showing APOBEC signature (SBS2 + SBS13) burden in the indicated A3B-deficient (A3B KO) and A3B-proficient (A3B WT) PC9 clones (A3B WT, n = 6 biological replicates; A3B KO, n = 6 biological replicates). c, Fraction of mutations in an APOBEC context (TCW C>T/G) of total mutations per replicate, of Osi-treated A3B WT and A3B KO cells (all data points shown, n = 6 biological replicates, mean ± s.d., two-tailed Mann–Whitney test, **P = 0.0043). d, Fraction of APOBEC mutations (RTCW C>T/G) of total mutations per replicate Osi-treated A3B WT and A3B KO cells (all data points shown, n = 6 biological replicates, two-tailed Mann–Whitney test, **P = 0.0022). e, Fraction of APOBEC mutations (YTCW C>T/G) of total mutations per replicate in Osi-treated A3B WT and A3B KO cells (all data points shown, n = 6 biological replicates, two-tailed Mann–Whitney test, P = 0.0931). f, Profiles of APOBEC-associated signatures SBS2 and SBS13 from the Catalogue of Somatic Mutations in Cancer (COSMIC) (cancer.sanger.ac.uk). g, Mutational profiles of A3B KO and A3B WT Osi-treated PC9 cell lines. Mutational profiles are plotted as the number of mutations (y axis) at cytosine or thymine bases classified into 96 possible trinucleotide sequence contexts (asterisk indicates cell lines that acquired APOBEC signature during TKI treatment timecourse (SBS2 + SBS13; A3B WT, n = 6 biological replicates; A3B KO, n = 6 biological replicates)).
Fig. 7
Fig. 7. APOBEC3B expression and APOBEC-associated mutations are elevated with targeted therapy in patients with NSCLC.
a, APOBEC3B (A3B) expression levels (batch-corrected transcripts per million (TPM)) measured using RNA-seq analysis in human NSCLC specimens driven by EGFR- and ALK-driver mutations obtained before TKI treatment (pre-TKI, n = 32 samples) or post-treatment (post-TKI, n = 42 samples; all data points shown, two-sided t test, *P = 0.02). b, APOBEC family member expression measured using single-cell RNA-seq obtained from human NSCLC before TKI treatment (TN), on-treatment at RD or at PD (all data points shown, n = 762, 553 and 988 cells per group, respectively, two-sided Wilcoxon test with a Holm correction, ****P < 2.22 × 10−16). c,d, Representative images of IHC analysis of A3B protein levels in patients with NSCLC at TN, RD and PD stages. Red arrows indicate positive stained cells (scale bar: 30 µM, c) with IHC quantification of human NSCLC samples pre-TKI (n = 16 samples) or post-TKI single agent (n = 15 samples; all data points shown, two-sided unpaired t test, *P = 0.0113, d). e, Total mutation burden (SNV count) in paired human NSCLC samples pre-TKI or post-TKI (n = 32, two-tailed Wilcoxon matched-pairs signed-rank test, **P = 0.0013). f, APOBEC-associated mutation count in paired human NSCLC samples pre-TKI or post-TKI (n = 32, two-tailed Wilcoxon matched-pairs signed-rank test, *P = 0.0155). g, Mutation signature associated with each putative de novo TKI resistance mutation detected in clinical samples analyzed post-TKI at PD. An asterisk denotes a sample from a patient who has received prior chemotherapy. Boxplots: middle line represents median; lower and upper hinges represent the first and third quartiles; lower and upper whiskers represent smallest and largest values within 1.5× interquartile range from hinges.
Fig. 8
Fig. 8. APOBEC3B in EGFR-driven lung tumor evolution.
At tumor initiation, continuous APOBEC3B expression and activity induces CIN and p53 pathway activation, resulting in cell death. With targeted therapy, NF-κB induction leads to increased A3B expression, fueling TKI resistance. Figure created in BioRender.com.
Extended Data Fig. 1
Extended Data Fig. 1. APOBEC3B is detrimental for tumorigenesis in an EA3B mouse model of lung cancer.
a, Two by two contingency table of the number of mice with visible tumors (VT) or no visible tumors (NVT) by microCT at 3 months (two-sided Fisher’s exact test, *P = 0.0236). b, Representative images of p53 nuclear IHC staining (scale bar=10 µm, arrows indicate positive cells, E n = 5, EA3B n = 5 biological replicates). c, Quantification of p53 positive cells per lung area by IHC staining at 3 months post-induction (E n = 5, EA3B n = 5, mean ± SD, two-sided Mann-Whitney test, *P = 0.0159). d, Quantification of p53 positive cells per lung area by IHC staining at late timepoint (termination) (E n = 8, EA3B n = 8, mean ± SD, two-sided Mann-Whitney test). e, Quantification of Ki67-positive cells per mm2 of tumor at 3 months post-induction (E n = 9, EA3B n = 10, each dot represents a tumor, mean ± SD, two-sided unpaired t-test). f, Quantification of γH2AX-positive cells per mm2 of tumor at 3 months post-induction (E n = 9, EA3B n = 10, each dot represents a tumor, mean ± SD, two-sided Mann-Whitney test). g, Quantification of CD4+ cells per mm2 of tumor at 3 months post-induction (E n = 8, EA3B n = 7, each dot represents a tumor, mean ± SD, two-sided Mann-Whitney test, **P = 0.0086). h, Quantification of CD8+ cells per mm2 of tumor at 3 months post-induction (E = 8, EA3B = 8, each dot represents a tumor, mean ± SD, two-sided Mann-Whitney test, ***P = 0.0003). i, Representative IHC stainings of EGFRL858R, APOBEC3B, and CD4 and CD8 T cells (scale bar=50 µm, EGFRL858R E n = 9, EA3B n = 10, A3B E n = 9, EA3B n = 10, p53fl/fl E n = 5, EA3B n = 5, CD4 E n = 8, EA3B n = 7, CD8 E n = 8, EA3B n = 8). j, Intravenous transplantation using an EGFRL858R; p53fl/fl;APOBEC3B (EPA3B) mouse tumor cell line injected into a wildtype C57BL/6J mouse or a C57BL/6J EPA3B GEMM mouse. k, Quantification of EGFRL858R positive tumors in C57BL/6 wildtype versus EPA3B mice at 4 weeks (mean ± SD, two-sided Mann-Whitney test, n = 4, *P = 0.0286, each dot represents a mouse, C57BL/6 wildtype n = 4, C57BL/6J EPA3B GEMM n = 4). l, Quantification of EGFRL858R positive tumors in C57BL/6 wildtype versus EPA3B mice at 12 weeks (mean ± SD, two-sided Mann-Whitney test, n = 3, *P = 0.0286, each dot represents a mouse, C57BL/6 wildtype n = 4, C57BL/6J EPA3B GEMM n = 3). m, Representative IHC staining of EGFRL858R and APOBEC3B (scale bar=50 µm, 4 weeks C57BL/6 wildtype n = 4, C57BL/6J EPA3B GEMM n = 4, 12 weeks C57BL/6 wildtype n = 4, C57BL/6J EPA3B GEMM n = 3).
Extended Data Fig. 2
Extended Data Fig. 2. Subclonal A3B expression in treatment naive mice inhibits tumor growth.
a, Experimental set up of induction of subclonal APOBEC3B using TetO-EGFRL858R;CCSP-rtTA;Rosa26LSL-APOBEC3B/Cre-ER(T2)(EA3Bi) or TetO-EGFRL858R;CCSP-rtTA;Rosa26Cre-ER(T2)/+(Ei) mice. b, Tumor nodules per lung section per mouse at termination (Ei n = 10, EA3Bi n = 10, two-sided Mann-Whitney test, *P = 0.0494). c, Tumor area per lung area at termination (Ei n = 10, EA3Bi n = 10, two-sided Mann-Whitney test, *P = 0.0216). d, Survival curve of Ei versus EA3Bi mice (Ei n = 14, EA3Bi n = 17, each dot represents a mouse, Log-rank (Mantel-Cox) test, *P = 0.0358).
Extended Data Fig. 3
Extended Data Fig. 3. Putative resistance mutations in genes previously associated with TKI resistance in mouse tumor cell lines.
a, Comparison of EP and EPA3B mutation burdens in TKI naive and TKI resistant mouse lung cancer cell lines (mean ± SD, one-way ANOVA test, *P = 0.0135, *P = 0.0346, **P = 0.0039). b, Comparison of EP and EPA3B APOBEC driven mutations (TCN, C > T or C > G SNVs) in TKI naive and TKI resistant mouse lung cancer cell lines (mean ± SD, one-way ANOVA test, *P = 0.0333, *P = 0.0333, **P = 0.0012). c, Functional annotation of TCN mutations in potential TKI resistance genes with change in variant allele frequency shown (x=TCN, Red square=deleterious mutation, yellow square=mixed (neutral and deleterious), orange square=neutral). d, Significant subclonal enrichment of the APOBEC-associated mutation signature in the TRACERx patient with A3B driven D129N mutation in the type IIa PTP PTPRD (equivalent to D138N mutation in PTPRS ***P = 0.0002, two-sided one-sample Wilcoxon test).
Extended Data Fig. 4
Extended Data Fig. 4. APOBEC3 family member mRNA and protein levels in control and A3B knockout cell lines.
a, Immunoblot for APOBEC3B (A3B) protein levels in PC9 control (sgGFP) and A3B knockout (sgA3B) cell lines, (n = 3 biological replicates, 2 independent experiments). b, mRNA expression levels of APOBEC3 family members in control (sgGFP) and A3B knockout (sgA3B) PC9 cell lines (n = 3 biological replicates, mean ± SD, one-way ANOVA test, ***P = 0.0001). c, Immunoblot for A3B protein levels in HCC827 control (sgGFP) and A3B knockout (sgA3B) cell lines (n = 3 biological replicates, 2 independent experiments). d, mRNA expression levels of APOBEC3 family members in control (sgGFP) and A3B knockout (sgA3B) HCC827 cell lines (n = 3 biological replicates, mean ± SD, one-way ANOVA test, ***P = 0.0001). e, Immunoblot for A3B protein levels in H3122 control (sgCtrl) or A3B knockout (sgA3B) cell line (n = 1 biological replicate, 2 independent experiments). f, mRNA expression levels of APOBEC3 family members in control (sgGFP) and A3B knockout (sgA3B) H3122 cell lines (n = 2 biological replicates, mean ± SD, one-way ANOVA test, ****P < 0.0001). g, CellTiter-Glo (CTG) viability assay performed on A3B-deficient or A3B-proficient PC9 cells treated with DMSO for 7 days (n = 3 biological replicates, mean ± SD, two-sided t-test). h, CTG viability assay performed on A3B-deficient or A3B-proficient HCC827 cells treated with DMSO for 7 days (n = 3 biological replicates, mean ± SD, two-sided t-test). i, CTG viability assay performed on A3B-deficient or A3B-proficient H3122 cells treated with DMSO for 7 days (n = 3 biological replicates, mean ± SD, two-sided t-test, *P = 0.0293).
Extended Data Fig. 5
Extended Data Fig. 5. Knockdown of APOBEC3 family members under TKI treatment.
a, Western blot analyses for pEGFR and pERK1/2 to confirm loss with osimertinib treatment in PC9 and HCC827 cells treated with DMSO or 0.5 μM osimertinib (Osi) for 18 hours (PC9 n = 4 independent experiments, HCC827 n = 1 independent experiment). b–e, RT-qPCR analysis of APOBEC3 family members expression in PC9 cells treated with DMSO or 0.5 μM osimertinib for 18 hours, with siRNA knockdown of APOBEC3A (A3A), APOBEC3B (A3B), APOBEC3C (A3C) or APOBEC3F (A3F): A3A expression (b, n = 3 biological replicates, mean ± SD, one-way ANOVA test ****P < 0.0001); A3B expression (c, n = 3 biological replicates, mean ± SD, one-way ANOVA test, ****P < 0.001); A3C expression (d, n = 3 biological replicates, mean ± SD, one-way ANOVA test, **P = 0.0049, ****P < 0.0001); A3F expression (e, n = 3 biological replicates, mean ± SD, one-way ANOVA test ****P = < 0.001). f–i, RT-qPCR analysis of APOBEC3 family members expression in HCC827 cells treated with DMSO or 0.5 μM osimertinib for 18 hours, with siRNA knockdown of A3A, A3B, A3C or A3F: A3A expression (f, n = 3 biological replicates, mean ± SD, one-way ANOVA test, ***P = 0.0003); A3B expression (g, n = 3 biological replicates, mean ± SD, one-way ANOVA test, **P = 0.0011); A3C expression (h, n = 3 biological replicates, mean ± SD, one-way ANOVA test, ***P = 0.0002, **P = 0.0040); A3F expression (i, n = 3 biological replicates, mean ± SD, one-way ANOVA test, ****P < 0.0001).
Extended Data Fig. 6
Extended Data Fig. 6. TKI treatment induces increased A3B and decreased UNG expression and activity in pre-clinical models of lung adenocarcinoma.
a, Uracil excision capacity assay (UEC) using PC9 nuclear extracts treated with DMSO or 2 μM osimertinib (Osi) (n = 3 biological replicates, mean ± SD, two-tailed t-test, *P = 0.0275). b, UEC in HCC827 treated with DMSO or 0.4 µM osi (n = 3 biological replicates, mean ± SD, two-tailed t-test, ****P < 0.0001). c, Western blot (WB) from H1975 treated with DMSO, 0.1 µM or 0.5 μM crizotinib (CYTO: cytoplasmic; NUC: nuclear; H3: Histone H3; TUBB: beta-tubulin) (n = 3 biological replicates). d, APOBEC activity assay (AAA) using H1975 treated with DMSO or 1 µM osi (n = 3 biological replicates, mean ± SD, two-tailed t-test, **P = 0.0084). e, UEC in H1975 treated with DMSO or 1 uM osi (n = 3 biological replicates, mean ± SD, two-tailed t-test, **P = 0.0054). f, WB from H3122 treated with DMSO or 1 μM crizotinib (n = 3 biological replicates). g, AAA from H3122 treated with DMSO or 0.5 μM crizotinib (n = 3 biological replicates, mean ± SD, two-tailed t-test, *P = 0.0204). h, UEC in H3122 treated with DMSO or 0.5 μM crizotinib (n = 3 biological replicates, mean ± SD, two-tailed t-test, *P = 0.0123). i, WB of H2228 treated with DMSO or 0.5 μM alectinib for (n = 3 biological replicates). j, AAA from PC9 transduced with empty vector (shEV) or shRNA against A3B (shA3B-1) and treated with DMSO or 1 μM erlotinib (n = 3 biological replicates). k, WB from nuclear extracts of PC9 transduced with shEV or shA3B-1 alone or together with wild-type HA-tagged A3B or HA-tagged catalyticaly-inactive A3B mutant (E255A) expression plasmid (n = 3 biological replicates). l, AAA from PC9 as in panel k, in the absence of RNase A (n = 3 biological replicates). m, mRNA expression levels of APOBEC3 family members in control (shEV) and A3B knockdown (shA3B) PC9 (n = 3 biological replicates, mean ± SD, one-way ANOVA test, **P = 0.0059, ****P < 0.0001). n, Cell cycle analysis of PC9 treated with DMSO, 2 μM osimertinib or 1 μM palbociclib (Palbo) (n = 4 biological replicates, mean ± SD, two-tailed t-tests, *P = 0.012, **P = 0.0032, **P = 0.0071, **P = 0.0084, *P = 0.0105). o, RT-qPCR analysis of PC9 cells treated as in panel a, (n = 2 or 3 biological replicates, mean ± SD, one-way ANOVA test, ****P < 0.0001, *P = 0.0215, **P = 0.0018). Panels a–i, n: treatment for 18 hours.
Extended Data Fig. 7
Extended Data Fig. 7. EGFR inhibition induces A3B upregulation and UNG downregulation in xenograft models.
a, Western blot analysis using extracts of EGFR-mutant H1975 human NSCLC xenografts harvested after 4 days of treatment with vehicle or the indicated doses of osimertinib (TUBB: Tubulin Beta Class I) (n = 1 biological replicate). b, Western blot analyses of extracts of PC9 tumor xenografts treated with vehicle or 5 mg/kg osimertinib (n = 2 biological replicates). c, Representative images of IHC analysis of APOBEC3B (A3B) protein levels in 11-18 xenografts treated with vehicle, 12.5 mg/kg/day erlotinib, 7.5 mg/kg/day NF-κB inhibitor (NF-κBi, PBS-1086) or combination (Erlotinib + NF-κBi) for 2 months (scale: 60 µM, n = 2 biological replicates)17. d, Quantification of immunohistochemical staining for A3B in 11-18 xenografts treated with vehicle, erlotinib (Erl), NF-κB inhibitor (NF-κBi, PBS-1086) or combination (Erl + NF-κBi) for 2 months (n = 2 biological replicates). e, Representative images of IHC analysis of UNG protein levels in 11-18 xenografts treated with vehicle or 12.5 mg/kg/day erlotinib for 2 months (n = 2 biological replicates). f, Quantification of immunohistochemical staining for UNG in 11-18 xenografts treated with vehicle or erlotinib for 2 months (n = 2 biological replicates). g, RNA-Seq analysis upon treatment of a PDX model of human EGFR-driven lung adenocarcinoma with vehicle or erlotinib (2 days, 25 mg/kg) (n = 2 biological replicates). h, RNA-Seq analysis upon treatment of a PDX model of human EGFR-driven lung adenocarcinoma with vehicle or osimertinib (6 days, 10 mg/kg) (n = 3 biological replicates, mean ± SD, two-sided t-test, *P = 0.0267).
Extended Data Fig. 8
Extended Data Fig. 8. NF-κB signaling contributes to TKI-induced A3B upregulation, and expression of c-Jun and UNG are decreased upon TKI treatment.
a, RNA-Seq analysis of EGFR-mutant 11-18 cells treated with DMSO, 100 µM erlotinib (erl), 5 µM NF-κB inhibitor (NF-κBi, PBS-1086) or combination (Erl+NF-κBi) (n = 3 biological replicates, mean ± SEM, one-way ANOVA test, ****P < 0.0001). b, Western blot analysis of extracts from PC9 treated with DMSO or with TNFα for 8.5 hours (n = 3 biological replicates). c, RT-qPCR analysis of TNFα-treated PC9 (n = 3 biological replicates, mean ± SD, two-tailed t-test, *P = 0.0406, *P = 0.0299, **P = 0.0024). d, RT-qPCR validation of RELA and RELB knockdown in PC9 with non-targeting vector or combination of shRELA-1+shRELB-1 (mix1) or shRELA-2+shRELB-2 (mix2) (n = 3 biological replicates; mean ± SD, one-way ANOVA test, ****P < 0.0001). e, RT-qPCR analysis of APOBEC3B (A3B) in PC9 with non-targeting vector or mix1 or mix2, treated with DMSO or 500 nM osi for 1 day (n = 3 biological replicates; mean ± SD, two-tailed t-test, *P = 0.0465, **P = 0.0026). f, Western blot analysis of PC9 used in e (n = 3 biological replicates). g, APOBEC activity assay of PC9 used in f (n = 3 biological replicates). h–j, Single-cell RNA-Seq expression in lung cancer cells from patient tumors at treatment naïve (TN, 762 cells), residual disease (RD, 553 cells) and progressive disease (PD, 988 cells) of: A3B (h), RelA (i) and RelB (j) (all data points shown, two-sided Wilcoxon test with Holm correction, ****P < 2.22e-16). k, Single-cell RNA-Seq analysis of NF-κB signature (from Gilmore_Core_NFκB_Pathway, GSEA, C2) in tumors from panels h–j (mean ± SD, two-sided Wilcoxon test with Holm correction, ****P < 2.22e-16). l, RT-qPCR analysis of c-JUN in PC9 treated with DMSO or 2 μM osimertinib for 9 days (n = 3 biological replicates, mean ± SEM, two-tailed t-test, ***P = 0.0009). m, RT-qPCR analysis of PC9 with non-targeting (siNTC) or c-JUN siRNA, treated with DMSO or 2 μM osimertinib for 18 hours (n = 3 biological replicates, mean ± SD, one-way ANOVA test, ****P < 0.0001). Boxplots: middle line=median, lower and upper hinges=first and third quartiles, lower and upper whiskers=smallest and largest values within 1.5×inter-quartile range from hinges.
Extended Data Fig. 9
Extended Data Fig. 9. Mutation burden and putative resistance mutations in genes previously associated with TKI resistance in PC9 TKI resistant cell line.
a, Mutation burden quantified in APOBEC3B (A3B)-deficient (A3B KO), and A3B-proficient (A3B WT) single cell cloned PC9 cells treated with osimertinib for 3 months (n = 6 biological replicates, mean ± SD, two-tailed Mann-Whitney test). b, Western blot analysis of PC9 cells treated with non-targeting (siNTC) or NRXN3-targeting (siNRXN3) siRNA and treated with DMSO or 500 nM osimertinib for 2 days (n = 3 biological replicates). c, RT-qPCR-based validation of NRXN3 knockdown in cells shown in a (n = 3 technical replicates, mean ± SD, two-sided t-test performed on ΔCt values shown, ***P = 0.0007). d, IC50 analysis of PC9 siNTC or siNRXN3 after 3-day treatment (n = 5 biological replicates for each of the following doses of osimertinib: 0 nM, 5 nM, 50 nM, 100 nM, 500 nM and 5000 nM, mean ± SD, two-sided t-test, ***P = 0.0004).
Extended Data Fig. 10
Extended Data Fig. 10. Expression of APOBEC3 enzymes in clinical samples upon targeted therapy treatment.
a, Comparison of APOBEC3B (A3B) expression levels (Exp: batch corrected TPM) measured using RNA-Seq analysis in human NSCLC specimens driven by EGFR and ALK driver mutations obtained before treatment (Pre-TKI, 32 samples), or post-treatment (Post-TKI, 42 samples) (all data points shown, two-sided t-test, *P = 0.011). b, Comparison of APOBEC3 (A3) family member expression levels (Exp: batch corrected Log (TPM + 1) measured using RNA-seq analysis in human NSCLC specimens obtained at treatment naïve (TN), residual disease (RD) or progressive disease (PD) with TKI (all data points shown, 762, 553, and 988 cells per group respectively, two-sided Wilcoxon test with Holm correction, *P = 0.02). c, Boxplot of normalized A3 family member expression measured using scRNA-seq obtained from the same samples as b (all data points shown, 762, 553, and 988 cells per group respectively, two-sided Wilcoxon test with Holm correction, *P < 0.05, **P < 0.01, ****P < 0.001, d=effect size calculated using a Cohen test). Boxplots: middle line=median, lower and upper hinges=first and third quartiles, lower and upper whiskers=smallest and largest values within 1.5×inter-quartile range from hinges.

References

    1. Cheng AZ, et al. APOBECs and herpesviruses. Viruses. 2021;13:390. doi: 10.3390/v13030390. - DOI - PMC - PubMed
    1. Harris RS, Liddament MT. Retroviral restriction by APOBEC proteins. Nat. Rev. Immunol. 2004;4:868–877. doi: 10.1038/nri1489. - DOI - PubMed
    1. Swanton C, McGranahan N, Starrett GJ, Harris RS. APOBEC enzymes: mutagenic fuel for cancer evolution and heterogeneity. Cancer Discov. 2015;5:704–712. doi: 10.1158/2159-8290.CD-15-0344. - DOI - PMC - PubMed
    1. Venkatesan S, et al. Induction of APOBEC3 exacerbates DNA replication stress and chromosomal instability in early breast and lung cancer evolution. Cancer Discov. 2021;11:2456–2473. doi: 10.1158/2159-8290.CD-20-0725. - DOI - PMC - PubMed
    1. Isozaki H, et al. Therapy-induced APOBEC3A drives evolution of persistent cancer cells. Nature. 2023;620:393–401. doi: 10.1038/s41586-023-06303-1. - DOI - PMC - PubMed

MeSH terms