. 2023 Dec 4;22(1):196.
doi: 10.1186/s12943-023-01907-7.

Immunoproteasome function maintains oncogenic gene expression in KMT2A-complex driven leukemia

Affiliations

Immunoproteasome function maintains oncogenic gene expression in KMT2A-complex driven leukemia

Nuria Tubío-Santamaría et al. Mol Cancer. .

Abstract

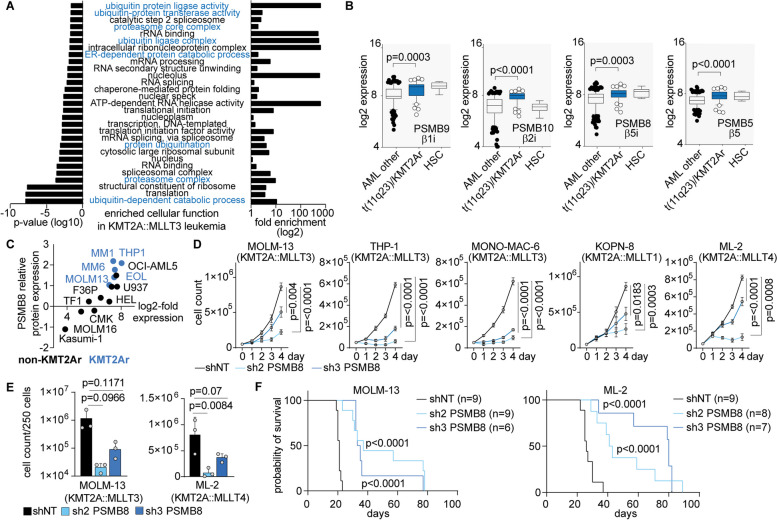
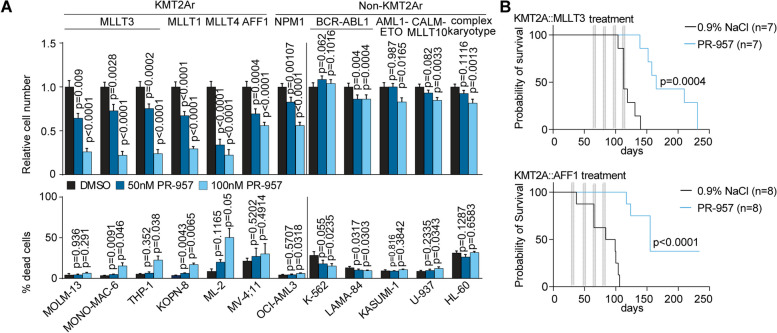
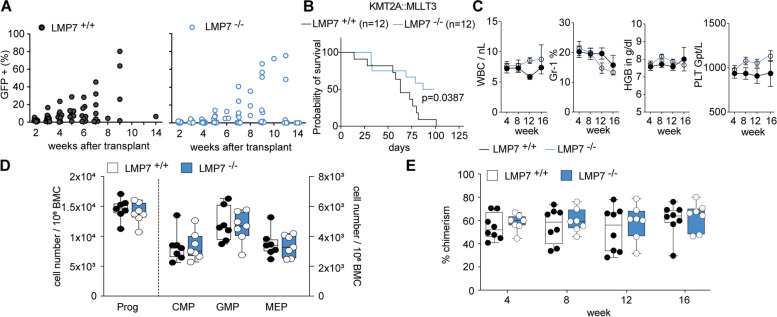
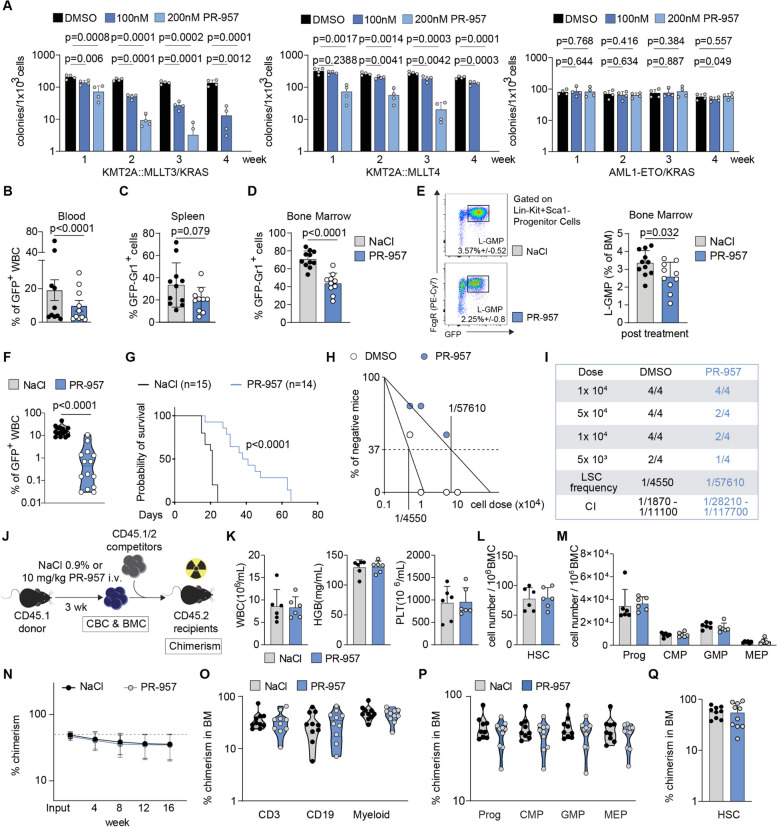
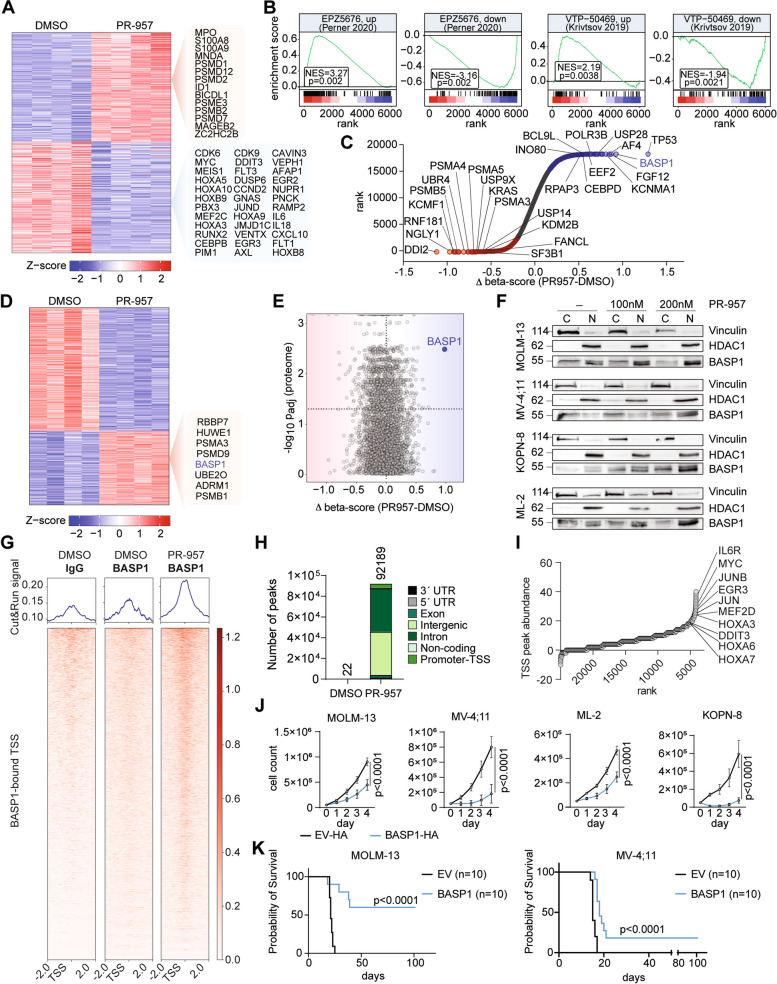
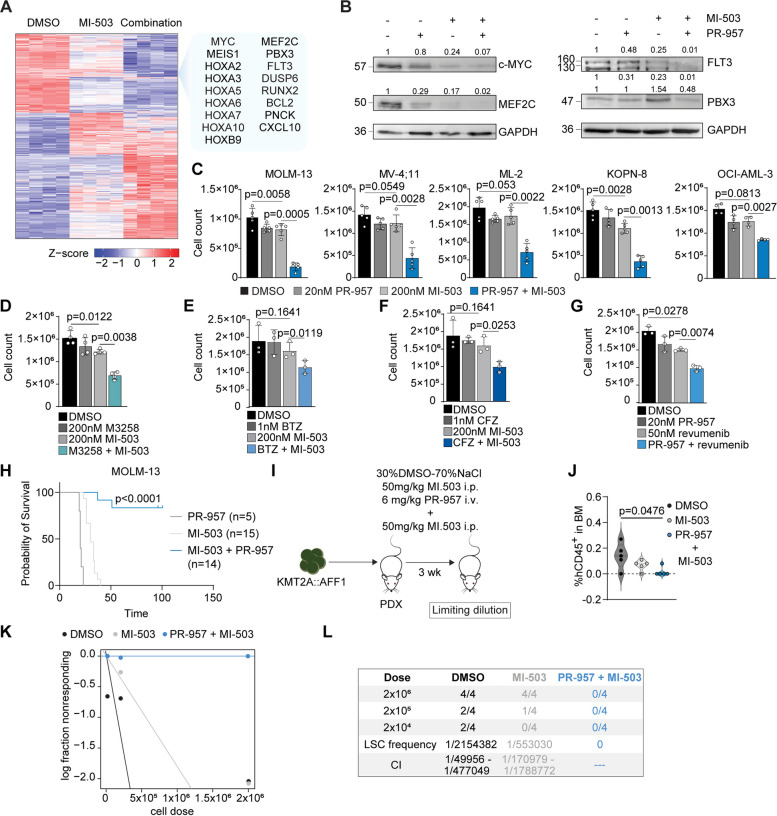
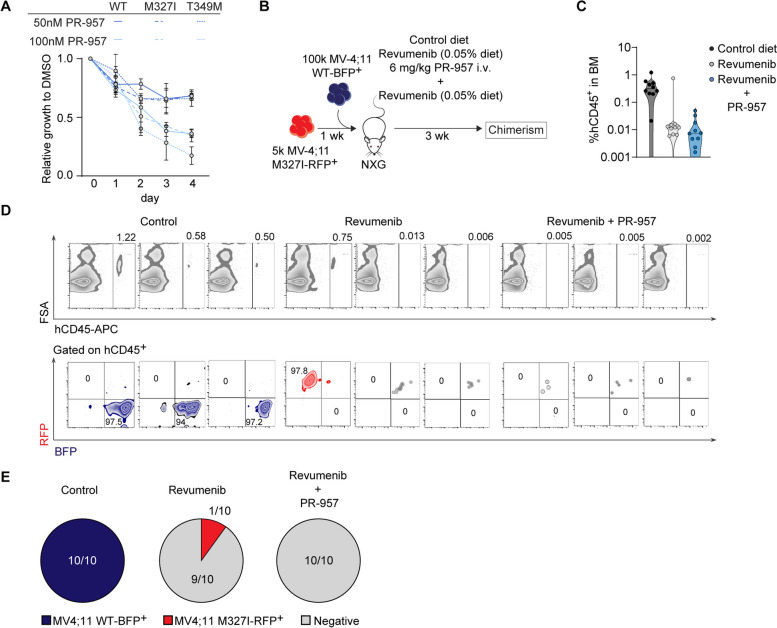
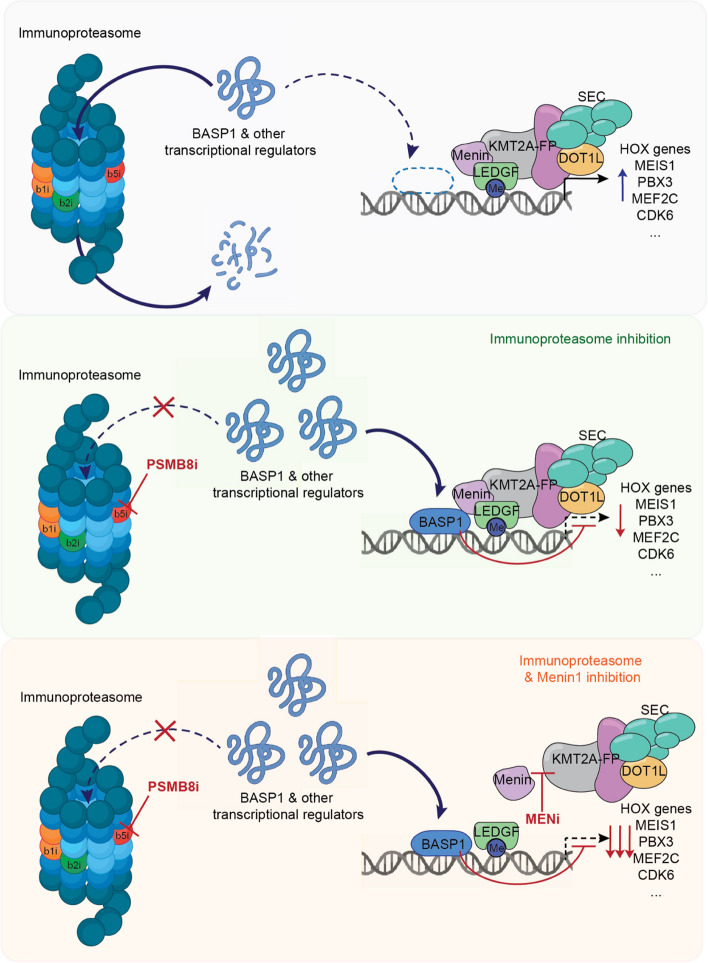
Pharmacologic targeting of chromatin-associated protein complexes has shown significant responses in KMT2A-rearranged (KMT2A-r) acute myeloid leukemia (AML) but resistance frequently develops to single agents. This points to a need for therapeutic combinations that target multiple mechanisms. To enhance our understanding of functional dependencies in KMT2A-r AML, we have used a proteomic approach to identify the catalytic immunoproteasome subunit PSMB8 as a specific vulnerability. Genetic and pharmacologic inactivation of PSMB8 results in impaired proliferation of murine and human leukemic cells while normal hematopoietic cells remain unaffected. Disruption of immunoproteasome function drives an increase in transcription factor BASP1 which in turn represses KMT2A-fusion protein target genes. Pharmacologic targeting of PSMB8 improves efficacy of Menin-inhibitors, synergistically reduces leukemia in human xenografts and shows preserved activity against Menin-inhibitor resistance mutations. This identifies and validates a cell-intrinsic mechanism whereby selective disruption of proteostasis results in altered transcription factor abundance and repression of oncogene-specific transcriptional networks. These data demonstrate that the immunoproteasome is a relevant therapeutic target in AML and that targeting the immunoproteasome in combination with Menin-inhibition could be a novel approach for treatment of KMT2A-r AML.


Conflict of interest statement

S.A.A., M.W.M.K., F.P.: Advisors to Syndax Inc. Otherwise, the authors declare no competing interests.

Figures

Fig. 1
Fig. 1
Immunoproteasome function is a vulnerability in KMT2A-r AML. A GO enrichment analysis on MS-based global proteome analysis on murine LSC-enriched GFP+ c-Kit+ cells of KMT2A::MLLT3-induced leukemia compared to AML1-ETO9a (n = 4). Displayed are the Top 30 GO-terms (“molecular function”) sorted by p-value. B Gene expression of catalytic proteasome subunits in hematopoietic stem cells (HSC), KMT2A-r leukemia (AML t(11q23)/KMT2A) or non-KMT2A-r AML (AML other) (https://servers.binf.ku.dk/bloodspot/). The box-and-whisker plots display the 90/10 percentiles at the whiskers, the 75/25 percentiles at the boxes, and the median. Mann–Whitney U test was performed. C Protein abundance of catalytic immunoproteasome subunit PSMB8 in KMT2A-r (blue) or non-KMT2A-r (black) AML cell lines (https://depmap.org/portal/). D Growth curves depicting cell counting after trypan blue exclusion of MOLM-13, THP-1, MONO-MAC-6, KOPN-8 and ML-2 cells transduced with shRNAs targeting PSMB8 or a non-targeting control (shNT). n = 3–5 independent experiments, in triplicate; mean with Standard Error of Mean (SEM); 2-way ANOVA. E Cell numbers on day 10; plating of 2.5 × 102 MOLM-13 or ML-2 cells in methylcellulose. n = 3 independent experiments; mean with Standard Deviation (SD); paired Student t test. F Kaplan–Meier survival curves of NSGS recipient mice transplanted with 1 × 105 MOLM-13 or ML-2 cells, expressing PSMB8-shRNA2 (n = 9 for MOLM-13; n = 8 for ML-2) and -shRNA3 (n = 6; n = 7) or non-targeting control (shNT: n = 9; n = 9); two independent cohorts; Mantel-Cox test
Fig. 2
Fig. 2
Pharmacologic targeting of PSMB8 confirms immunoproteasome requirement in KMT2A-r AML. A Relative cell number and percentage of dead cells (SYTOX®Blue+) of human leukemic cell lines as indicated after treatment with PR-957 (50 nM, 100 nM) for 96 h or DMSO as diluent control. n = 4 independent experiments, in triplicate; mean with SEM; paired Student t test. B Kaplan–Meier survival curves for two patient derived xenografts (PDX) using 1–5 × 104 cells from patient samples containing an KMT2A::MLLT3 (upper) or KMT2A::AFF1 (lower) translocation injected into NSGW41 recipient mice. Recipients treated in vivo with 3-6 mg/kg PR-957 for 5 days/week or NaCl 0.9% as diluent control on 4 alternate weeks (n = 7 per group for KMT2A::MLLT3; n = 8 for KMT2A::AFF1). Two independent cohorts; Mantel-Cox test
Fig. 3
Fig. 3
LMP7/PSMB8 is essential for KMT2A-r AML development but dispensable for normal hematopoiesis. A Dot plots depicting % of GFP+ cells in peripheral blood of recipient mice transplanted with 7 × 104 KMT2A::MLLT3 transformed LSKs from LMP7+/+ (n = 12) or LMP7−/− (n = 12) mice over 14 weeks. Two independent cohorts. B Kaplan–Meier survival curves of recipient mice (KMT2A::MLLT3 transformed LSKs from LMP7+/+ (n = 12) or LMP7 −/− (n = 12) mice). Two independent cohorts; Mantel-Cox test. C White blood counts (WBC), hemoglobin (HGB) and platelets (PLT) in the peripheral blood of LMP7−/− (n = 7) for 16 weeks of steady-state hematopoiesis, compared with LMP7+/+ controls (n = 7). D Immunophenotypic quantification of progenitor cell abundance (Prog: Lin Sca1 c-Kit+), common myeloid progenitors (CMP: Lin Sca1 c-Kit+ CD34+ FcgR), granulocyte–macrophage progenitors (GMP: Lin Sca1 c-Kit+ CD34+ FcgR+) and megakaryocyte-erythroid progenitors (MEP: Lin Sca1 c-Kit+ CD34 FcgR) in the bone marrow. E Peripheral blood chimerism over 16 weeks; competitive repopulation assay using BM cells from LMP7−/− (n = 8) or LMP7+/+ (n = 8) donors
Fig. 4
Fig. 4
Pharmacologic inhibition of LMP7/PSMB8 impairs KMT2A-r leukemia stem cell function without affecting normal hematopoietic stem cells. A Serial re-plating to assess for colony formation in methylcellulose using murine LSK cells transformed with KMT2A::MLLT3/KRAS, KMT2A::MLLT4 or AML1-ETO/KRAS. Cells were treated with DMSO as diluent control or PR-957 (100 nM, 200 nM). n = 3–4 independent experiments; mean with SD; paired Student t test. B-D 3 × 105 KMT2A::MLLT3 murine BM cells transplanted into sublethally irradiated recipient mice. Mice were treated for 5 days/week for 3 cycles with 10 mg/kg PR-957 (n = 10) or NaCl 0.9% as diluent control (n = 11). Relative abundance of leukemic cells after 3 weeks of treatment in primary recipient mice in (B) peripheral blood, (C) spleen and (D) bone marrow. Two independent cohorts; mean with SD; Mann–Whitney U test. E Relative abundance of L-GMP (Lin-Kit + Sca1-CD34 + FcgR + GFP +) in diluent or PR-957 treated mice. Two independent cohorts; mean with SD; Mann–Whitney U test. F 2 × 106 whole bone marrow cells from the PR-957 or NaCl in vivo treated KMT2A::MLLT3 mice were transplanted into secondary recipients (n = 14 recipients of PR-957 treated mice; n = 15 recipients of NaCl treated mice). Abundance of leukemic cells in the peripheral blood, 2 weeks after transplantation. Two independent cohorts; Mann–Whitney U test. G Survival of secondary recipient mice. Mantel-Cox test. H-I Limiting dilution (LD) assay using murine KMT2A::MLLT3 BM cells treated for 48 h with diluent or 200 nM PR-957. H Reduction of leukemia initiating cells and (I) Cell dose, animal numbers, LSC-frequency and confidence intervals (CI) following diluent or PR-957 exposure. n = 4 mice per dilution and treatment, analysis performed using ELDA (Extreme Limiting Dilution Assay) software [28]. J Schematic depicting competitive repopulation assay to investigate effects of PR-957 treatment on normal HSPCs. K-M Relative abundance of hematopoietic cells in CD45.1 mice after 3 weeks of treatment with 10 mg/kg PR-957 (n = 6) or NaCl 0.9% (n = 6), specifically in (K) Peripheral blood, (L-M) Bone marrow. L HSC abundance (HSC: Lin Sca1+ cKit+ CD48 CD150+); (M) Progenitor cell abundance; (N) Peripheral blood chimerism of recipient animals using BM cells from in vivo treated mice with PR-957 or diluent control. O-Q Abundance of hematopoietic cells in the BM of recipient mice at week 16. O mature cell compartments; (P) progenitor cells; (Q) HSCs (HSC: Lin Sca1+ cKit+ CD34)
Fig. 5
Fig. 5
Enrichment of BASP1 by PSMB8 inhibition inhibits KMT2A target gene expression. A Heatmap of differentially expressed genes in MOLM-13 cells: 100 nM PR-957 vs. DMSO (72 h). Upregulated (red; fold-change (FC) > 2, p < 0.05) and downregulated (blue; FC < -2, p < 0.05) genes. B Gene Set Enrichment Analysis (GSEA) of PR-957 treated MOLM-13 cells compared to EPZ5676- or VTP-50469-treatment; NES (normalized enrichment score). C Hockey-stick-plot of ranked genes found to be differentially enriched/depleted in genome wide CRISPR/Cas9 screening in MOLM-13 cells. D Heatmap depicting unsupervised hierarchical clustering of differentially abundant proteins detected by mass-spectrometry. 100 nM PR-957 vs. DMSO, 72 h, MOLM-13. Upregulated (red; FC > 2, p < 0.05) and downregulated (blue; FC < -2, p < 0.05) proteins. E Correlation between the magnitude of differential protein abundance (-log10 Padj) as determined by proteome analysis and the functional dependencies obtained by CRISPR/Cas9 screening (Δ beta-scores PR-957 vs. DMSO) in MOLM-13 cells. F Western Blotting showing expression of BASP1 in nuclear (N) and cytoplasmic (C) fractions of MOLM-13, KOPN-8, ML-2 and MV4;11 cells. PR-957 (100 nM, 200 nM) vs. DMSO, 72 h. G Heatmaps displaying IgG and BASP1 Cut&Run signal mapping to a 2-kb window around the TSS (Transcription Start Site). 100 nM PR-957 vs. DMSO, 48 h, MOLM-13 cells; 1 (out of n = 3) representative replicate. H Stacked bar plot depicting genomic distribution of BASP1 Cut&Run peaks. MOLM-13 cells; n = 3 independent replicates. I Dot-plot of ranked BASP1-bound TSS according to their abundance; 1 representative replicate. J Growth curves of KMT2A-r cells (MOLM-13, MV-4;11, ML-2, KOPN-8) transduced with pLEX-BASP1-HA-Tag (BASP1-HA) or pLEX-HA-Tag (EV-HA). n = 4 independent experiments, in triplicate; mean with SEM; 2-way ANOVA. K Survival curves of NXG recipient mice transplanted with 1 × 105 MOLM-13 or MV-4;11 cells expressing pLEX-BASP1 (BASP1) or pLEX-EV (EV) (n = 10 per construct and cell line). Two independent cohorts; Mantel-Cox test
Fig. 6
Fig. 6
Synergistic targeting of oncogenic gene expression through pharmacologic inactivation of Menin and PSMB8. A Heatmap of differentially expressed genes in MOLM-13 cells. 1 μM MI-503 treatment, 1 μM MI-503 and 100 nM PR-957 treatment or DMSO for 72 h. Upregulated (red; FC > 2, p < 0.05) and downregulated (blue; FC < -2, p < 0.05) genes. B Representative plots (out of n = 3–4) showing protein expression of c-Myc, MEF2C, FLT3 and PBX3 upon treatment with DMSO, 100 nM PR-957, 1 μM MI-503 or 1 μM MI-503 + 100 nM PR-957 for 72 h in MOLM-13 cells. C Bar plots depicting cell counts in MOLM-13, MV-4;11, ML-2, KOPN-8 and OCI-AML3 cells after treatment with 20 nM PR-957, 200 nM MI-503, a combination of both or DMSO for 6 days. n = 4–5 independent experiments; mean with SD; paired Student t test. D-G Bar plots representing proliferation of MOLM-13 cells after treatment with indicated monotherapies, combinations or DMSO for 6 days. n = 3 independent experiments; mean with SD; paired Student t test. H Xenograft of human MOLM-13 cells: Survival curve of NXG recipient mice transplanted with 1 × 105 MOLM-13 cells pre-treated ex vivo with either 100 nm PR-957 (n = 5) for 48 h, 2.5 μM MI-503 (n = 15) for 96 h or a combination of 2.5 μM MI-503 for 96 h and 100 nM PR-957 for 48 h (n = 14). Four independent cohorts; Mantel-Cox test. I Patient derived xenograft (PDX): Schematic representation of the in vivo MI-503 (50 mg/kg, × 7), MI-503 + PR-957 (6 mg/kg, i.v., 5 days/week for 3 weeks) or 30% DMSO-70% NaCl0.9% (× 7) treatment of NXG mice (n = 5/treatment) injected with 2 × 104 KMT2A::AFF1 PDX-cells. BM cells were subsequently transplanted at limiting numbers (2 × 106, 2 × 105, 2 × 104) into NXG recipient mice. J Immunophenotyping of human CD45+ (hCD45+) cells in the BM of NXG mice after in vivo treatment with MI-503, MI-503 + PR-957 or DMSO/NaCl0.9%. n = 5 mice per treatment; Mann–Whitney U test. K-L Limiting dilution (LD) assay. K Reduction of leukemia initiating cells. L Cell dose, animal numbers, LSC-frequency and CI following diluent, MI-503 or PR-957 + MI-503 exposure. n= 4 per dilution and treatment; analysis was performed using ELDA software [28]
Fig. 7
Fig. 7
Menin mutated cells with acquired resistance to Menin-inhibition retain sensitivity to immunoproteasome inhibition and preserved activity of combinatorial treatment strategies against MEN1-mutated clones may blunt outgrowth of resistant cells. A Relative growth to DMSO of wild-type MV-4;11 (MV-4;11 WT) and two MV-4;11 cell lines containing mutations in MEN1 (MV-4;11 M327I, methionine to isoleucine change at position 327; MV-4;11 T349M, threonine to methionine at position 349) after treatment with PR-957 (50 nM, 100 nM). n = 4 independent experiments; mean with SD. B Schematic representation of the competitive transplantation of 5 × 104 MV-4;11 M327I-RFP+ cells and 1 × 105 MV-4;11 WT-BFP+ cells (transplanted one week later) into NXG mice. Recipient mice were treated for 3 weeks with food supplemented with 0.05% Revumenib, Revumenib + PR-957 (6 mg/kg, 5 days/week, at week 1 and week 3) or control diet. C Immunophenotyping of human CD45 + (hCD45 +) cells in the BM of NXG mice after in vivo treatment with Revumenib, Revumenib + PR-957 or control diet. n = 10 mice per treatment. D Representative flow cytometry plots (3 per cohort) showing the percentage of hCD45 + and percentage of RFP + hCD45 + and BFP + hCD45 + bone marrow cells in the control, Revumenib-treated and Revumenib + PR-957 treated mice. E Pie charts depicting the number of mice expressing MV-4;11 WT-BFP + cells (blue), MV-4;11 M327I-RFP + cells (red) or no RFP + / BFP + cells (negative, grey), respectively
Fig. 8
Fig. 8
Schematic depicting the relevant mechanisms of PSMB8 inhibition as a functional vulnerability in KMT2A-r leukemia through repressive nuclear functions of BASP1 in conjunction with Menin-inhibitor treatment

References

    1. Brien GL, Stegmaier K, Armstrong SA. Targeting chromatin complexes in fusion protein-driven malignancies. Nat Rev Cancer. 2019;19:255–269. doi: 10.1038/s41568-019-0132-x. - DOI - PubMed
    1. Papaemmanuil E, Gerstung M, Bullinger L, Gaidzik VI, Paschka P, Roberts ND, Potter NE, Heuser M, Thol F, Bolli N, et al. Genomic classification and prognosis in acute myeloid leukemia. N Engl J Med. 2016;374:2209–2221. doi: 10.1056/NEJMoa1516192. - DOI - PMC - PubMed
    1. Bernt KM, Zhu N, Sinha AU, Vempati S, Faber J, Krivtsov AV, Feng Z, Punt N, Daigle A, Bullinger L, et al. MLL-rearranged leukemia is dependent on aberrant H3K79 methylation by DOT1L. Cancer Cell. 2011;20:66–78. doi: 10.1016/j.ccr.2011.06.010. - DOI - PMC - PubMed
    1. Chen CW, Koche RP, Sinha AU, Deshpande AJ, Zhu N, Eng R, Doench JG, Xu H, Chu SH, Qi J, et al. DOT1L inhibits SIRT1-mediated epigenetic silencing to maintain leukemic gene expression in MLL-rearranged leukemia. Nat Med. 2015;21:335–343. doi: 10.1038/nm.3832. - DOI - PMC - PubMed
    1. Krivtsov AV, Evans K, Gadrey JY, Eschle BK, Hatton C, Uckelmann HJ, Ross KN, Perner F, Olsen SN, Pritchard T, et al. A Menin-MLL inhibitor induces specific chromatin changes and eradicates disease in models of MLL-rearranged leukemia. Cancer Cell. 2019;36(660–673):e611. doi: 10.1016/j.ccell.2019.11.001. - DOI - PMC - PubMed

Publication types

Substances