. 2023 Dec 5;42(1):331.
doi: 10.1186/s13046-023-02906-8.

SNORA56-mediated pseudouridylation of 28 S rRNA inhibits ferroptosis and promotes colorectal cancer proliferation by enhancing GCLC translation

Affiliations

SNORA56-mediated pseudouridylation of 28 S rRNA inhibits ferroptosis and promotes colorectal cancer proliferation by enhancing GCLC translation

Chang Xu et al. J Exp Clin Cancer Res. .

Abstract

Background: Colorectal cancer (CRC) is one of the most common malignancies and is characterized by reprogrammed metabolism. Ferroptosis, a programmed cell death dependent on iron, has emerged as a promising strategy for CRC treatment. Although small nucleolar RNAs are extensively involved in carcinogenesis, it is unclear if they regulate ferroptosis during CRC pathogenesis.

Methods: The dysregulated snoRNAs were identified using published sequencing data of CRC tissues. The expression of the candidate snoRNAs, host gene and target gene were assessed by real-time quantitative PCR (RT-qPCR), fluorescence in situ hybridization (FISH), immunohistochemistry (IHC) and western blots. The biological function of critical molecules was investigated using in vitro and in vivo strategies including Cell Counting Kit-8 (CCK8), colony formation assay, flow cytometry, Fe2+/Fe3+, GSH/GSSG and the xenograft mice models. The ribosomal activities were determined by polysome profiling and O-propargyl-puromycin (OP-Puro) assay. The proteomics was conducted to clarify the downstream targets and the underlying mechanisms were validated by IHC, Pearson correlation analysis, protein stability and rescue assays. The clinical significance of the snoRNA was explored using the Cox proportional hazard model, receiver operating characteristic (ROC) and survival analysis.

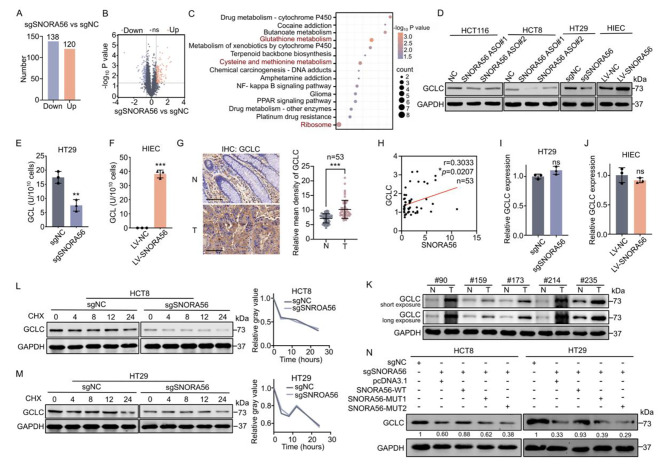
Results: Here, we investigated the SNORA56, which was elevated in CRC tissues and plasma, and correlated with CRC prognosis. SNORA56 deficiency in CRC impaired proliferation and triggered ferroptosis, resulting in reduced tumorigenesis. Mechanistically, SNORA56 mediated the pseudouridylation of 28 S rRNA at the U1664 site and promoted the translation of the catalytic subunit of glutamate cysteine ligase (GCLC), an indispensable rate-limiting enzyme in the biosynthesis of glutathione, which can inhibit ferroptosis by suppressing lipid peroxidation.

Conclusions: Therefore, the SNORA56/28S rRNA/GCLC axis stimulates CRC progression by inhibiting the accumulation of cellular peroxides, and it may provide biomarker and therapeutic applications in CRC.

Keywords: Biomarker; Colorectal cancer; Ferroptosis; GCLC; Proliferation; Pseudouridylation; SNORA56; Therapy.


Conflict of interest statement

The authors declare that they have no competing interests.

Figures

Fig. 1
Fig. 1
SNORA56 upregulation in CRC correlates with poor prognosis. (A) A Venn diagram of three published cohorts reporting upregulation of snoRNAs in CRC tissues. Cohort 1 was obtained from the published article [25]. Cohort 2 is from the Gene Expression Omnibus dataset GSE2091626. Cohort 3 is from our previously published work [29]. (B) Visualization of the genomic location of SNORA56 in its host gene, DKC1, on the UCSC Genome Browser. (C) A schematic representation of the structure of SNORA56. (D, F) The relative expression of SNORA56 and DKC1 in 47 paired CRC and adjacent non-tumor tissues was revealed using RT-qPCR. (E, G) The relative expression of SNORA56 and DKC1 in HIEC, HT29, HCT8, HCT116, SW480, Caco2, and LoVo cells was determined using RT-qPCR. (H) Analysis of the correlation between the expression of SNORA56 and DKC1. (I) SNORA56 FISH analysis and hematoxylin & eosin (H&E) staining in CRC tissue microarray. The mean density of SNORA56 signals was measured using Image Pro Plus. (J–K) SNORA56 staining intensity and the IHC score of CRC tissue microarray. (L) Kaplan Meier curve of the 5-year survival analysis in SNORA56 high and low groups using TCGA_COAD datasets from the SNORic database
Fig. 2
Fig. 2
SNORA56 promotes CRC proliferation in vitro and in vivo. (A–C) The efficiency of SNORA56 silencing in CRC cell lines upon the indicated transfections was determined using RT-qPCR. (D) RT-qPCR analysis of DKC1 mRNA levels in HT29 cells stably transfected with sgNC and sgSNORA56. (E–F, H–I) CCK8 analysis of the proliferation of CRC cells upon the indicated transfections. (G, J) Colony formation analysis in CRC cells upon transient or stable SNORA56 knockdown vs. the negative control. (K) Tumors from nude mouse subcutaneous xenografts bearing HT29 sgNC cells (right) and sgSNORA56 cells (left). (L–M) Tumor weights and growth curves based on tumor volume measurements every two days. (N) IHC analyses of H&E and Ki67 in the xenograft tumors. Ki67 scores were calculated in HT29 sgNC and sgSNORA56 xenografts. Scale bar: 100 μm
Fig. 3
Fig. 3
SNORA56 promotes 28 S rRNA maturation and translation in CRC cells. (A) Schematic representation of the interaction between SNORA56 and 28 S rRNA, and the mutated regions. (B) PyMOL analysis of the ribosomal structure and U1664, the 28 S rRNA site that is pseudouridylated by SNORA56. (C) A schematic diagram of the primers used to detect total and precursors of 18 and 28 S rRNA. Paired primers were displayed in the same color. (D-E) RT-qPCR analysis was used to reveal the relative levels of unprocessed 28 S rRNA and SNORA56 in HT29 sgNC and sgSNORA56 cells transfected with SNORA56-WT, MUT1, or MUT2. (F) Polysome profiling of HT29 cells with stable SNORA56 knockdown vs. the control. (G) OP-puro analysis of HCT29 cells with stable SNORA56 knockdown vs. the control. (H–K) CCK8 and colony formation assays of the treated HT29 and HCT8 cells. (L) Tumors from nude mice subcutaneous xenografts bearing HT29 sgNC, sgSNORA56, together with empty vector (EV), SNORA56-WT, MUT1 and MUT2, respectively. (M–N) Tumor weights and growth curves. (O) IHC analyses of Ki67 in the xenograft tumors. Scare bar: 100 μm
Fig. 4
Fig. 4
SNORA56 upregulates GCLC protein by activating its translation. (A) Differential protein expression in the sgSNORA56 vs. the sgNC group. (B) Volcano plot of differentially expressed proteins. (C) KEGG pathway enrichment analysis of significantly downregulated proteins. (D) GCLC protein levels in HCT116, HCT8, HT29 and HIEC cells were determined using western blotting after indicated transfections. (E–F) GCL enzyme activity in HT29 and HIEC cells with indicated transfection. (G) IHC analysis of GCLC levels in CRC tissue microarray. Mean GCLC density was determined using Image Pro Plus. Scale bar: 100 μm. (H) Analysis of the correlation between the SNORA56 and GCLC protein levels using CRC tissue microarray. (I–J) RT-qPCR analysis of relative GCLC mRNA levels in HT29 and HIEC cells upon indicated transfections. (K) Western blot analysis of GCLC protein levels in paired CRC tissues. (L–M) Western blot analysis of GCLC protein stability in SNORA56-silenced HCT8 and HT29 cells vs. control cells after CHX treatment for indicated durations. Relative band intensities were measured on ImageJ. (N) Western blot analysis of GCLC protein levels in HT29 and HCT8 cells after indicated transfections. GCLC protein levels were normalized to GAPDH.
Fig. 5
Fig. 5
SNORA56 causes GCLC-mediated CRC ferroptosis resistance and proliferation. (A, C, S, X, Q) HCT116, HCT8, HT29, and HIEC cells were transfected as indicated, stained with the BODIPY C11 probe, and subjected to flow cytometry for lipid ROS detection. (B, D, T, Y, R) HCT116, HCT8, HT29, and HIEC cells were subjected to indicated transfections, followed by propidium iodide staining and cell death analysis using flow cytometry. (E) The relative Fe2+/Fe3+ ratios in HT29 and HIEC cells after indicated transfections. (F) The relative GSH/GSSG ratios in HT29 and HIEC cells after indicated transfections. (G-J) Lipid ROS levels and cell death in HCT116 and HCT8 cells transfected with SNORA56 ASOs and control ASO, followed by treatment with DMSO, Fer-1, necrosulfonamide, and Z-VAD-FMK, were measured using flow cytometry. (K-L) The cell viability of HT29 and HIEC cells after indicated transfections and treatment with various erastin concentrations for 24 h, was determined using the CCK8 assay. (M) A schematic representation of GSH synthesis. (N, U) GCL enzyme activity in HT29 and HIEC cells after indicated treatment. (O-P, V-W) CCK8 and colony formation assays were used to assess the proliferation of treated HT29 and HIEC cells
Fig. 6
Fig. 6
SNORA56 is a promising CRC diagnostic biomarker and therapeutic target. (A) Forest plot of the overall survival hazard ratios using TCGA_COAD data. (B) Relative levels of plasma SNORA56. (C) Relative SNORA56 expression in 154 paired CRC tissues was revealed by RT-qPCR. (D–E) ROC curve analysis of SNORA56 in CRC plasma and tissues. (F–G) ROC curve analysis of the CRC diagnostic potential of CEA or CA199 when combined with SNORA56. (H) Tumors from a nude mouse xenograft model that was subcutaneously injected with HT29 sgNC (right) and sgSNORA56 (left) cells and then treated with IKE or solvent respectively. (I) Plots of tumor growth measurements taken on indicated days. (J) Tumor weights. (K) IHC analysis of GCLC and Ki67 in xenograft tumors after treatment with IKE or the solvent. Scale bar: 100 μm. (L) GCLC and Ki67 IHC scores in indicated xenografts
Fig. 7
Fig. 7
The proposed model of how SNORA56 regulates GCLC translation, thereby inhibiting ferroptosis and promoting proliferation. SNORA56, which was significantly upregulated in CRC, pseudouridylates 28 S rRNA at site U1664, thereby promoting ribosome maturation. Consequently, SNORA56 triggers GCLC translation, which drives ferroptosis resistance and proliferation in CRC.

References

    1. Sung H, et al. Global Cancer statistics 2020: GLOBOCAN estimates of incidence and Mortality Worldwide for 36 cancers in 185 countries. CA A Cancer J Clin. 2021;71:209–49. doi: 10.3322/caac.21660. - DOI - PubMed
    1. Patel SG, Karlitz JJ, Yen T, Lieu CH, Boland CR. The rising tide of early-onset Colorectal cancer: a comprehensive review of epidemiology, clinical features, biology, risk factors, prevention, and early detection. Lancet Gastroenterol Hepatol. 2022;7:262–74. doi: 10.1016/S2468-1253(21)00426-X. - DOI - PubMed
    1. Dekker E, Tanis PJ, Vleugels JLA, Kasi PM, Wallace MB. Colorectal cancer. The Lancet. 2019;394:1467–80. doi: 10.1016/S0140-6736(19)32319-0. - DOI - PubMed
    1. Williams GT, Farzaneh F. Are snoRNAs and snoRNA host genes new players in cancer? Nat Rev Cancer. 2012;12:84–8. doi: 10.1038/nrc3195. - DOI - PubMed
    1. Wang K, et al. SNORD88C guided 2′-O-methylation of 28S rRNA regulates SCD1 translation to inhibit autophagy and promote growth and Metastasis in non-small cell Lung cancer. Cell Death Differ. 2023;30:341–55. doi: 10.1038/s41418-022-01087-9. - DOI - PMC - PubMed