

A metabolomics study in aqueous humor discloses altered arginine metabolism in Parkinson's disease
- PMID: 38049870
- PMCID: PMC10696737
- DOI: 10.1186/s12987-023-00494-5
A metabolomics study in aqueous humor discloses altered arginine metabolism in Parkinson's disease
Abstract
Background: The lack of accessible and informative biomarkers results in a delayed diagnosis of Parkinson's disease (PD), whose symptoms appear when a significant number of dopaminergic neurons have already disappeared. The retina, a historically overlooked part of the central nervous system (CNS), has gained recent attention. It has been discovered that the composition of cerebrospinal fluid influences the aqueous humor composition through microfluidic circulation. In addition, alterations found in the brain of patients with PD have a correlate in the retina. This new paradigm highlights the potential of the aqueous humor as a sample for identifying differentially concentrated metabolites that could, eventually, become biomarkers if also found altered in blood or CSF of patients. In this research we aim at analyzing the composition of the aqueous humor from healthy controls and PD patients.
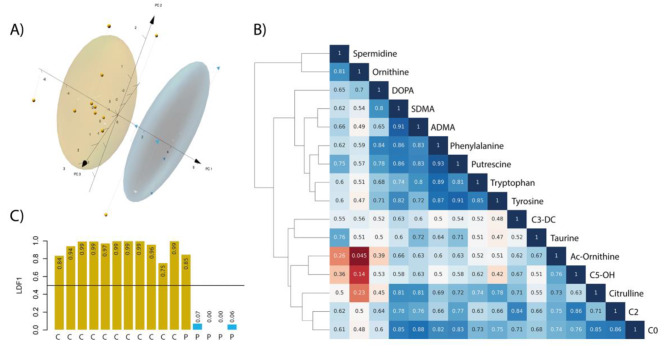
Methods: A targeted metabolomics approach with concentration determination by mass spectrometry was used. Statistical methods including principal component analysis and linear discriminants were used to select differentially concentrated metabolites that allow distinguishing patients from controls.
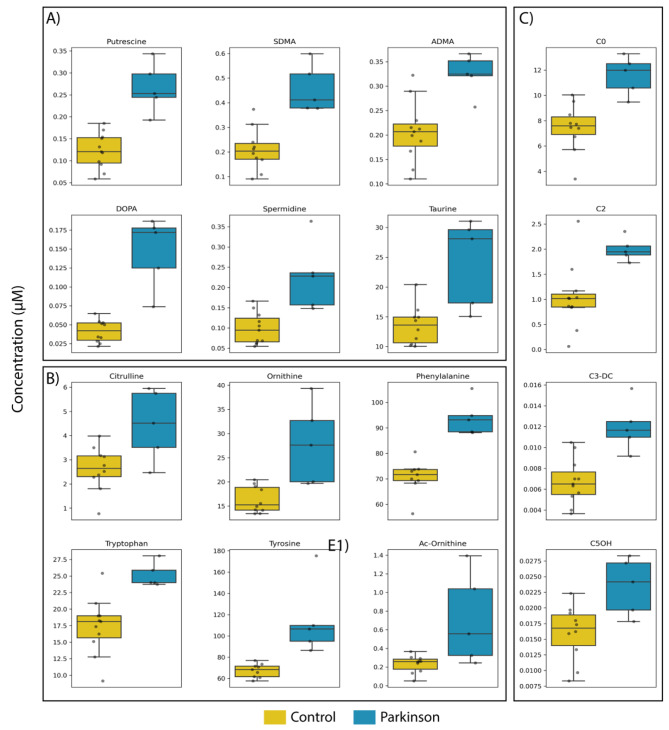
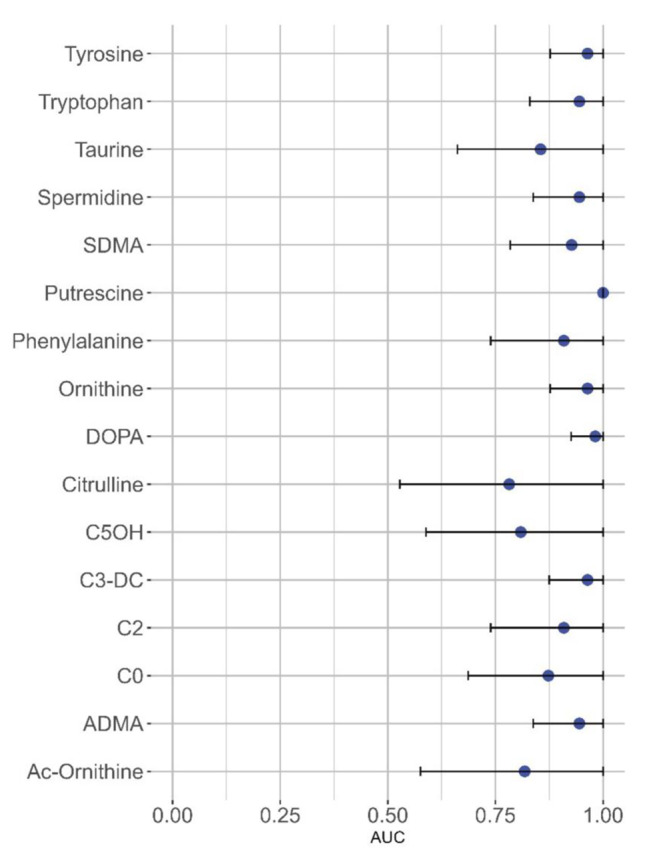
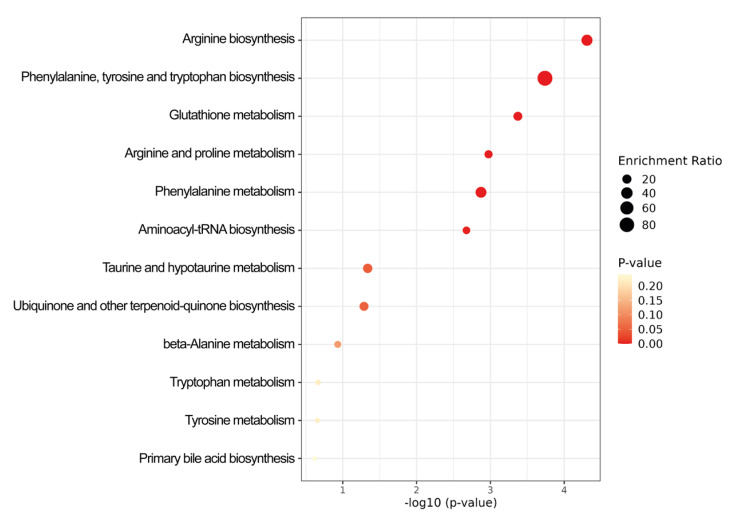
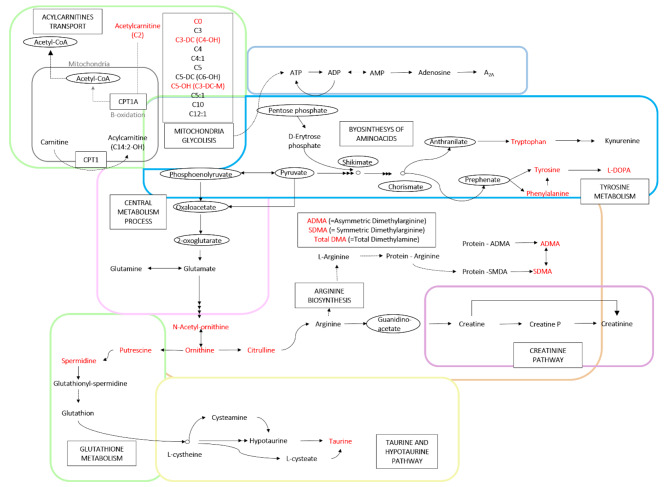
Results: In this first metabolomics study in the aqueous humor of PD patients, elevated levels of 16 compounds were found; molecules differentially concentrated grouped into biogenic amines, amino acids, and acylcarnitines. A biogenic amine, putrescine, alone could be a metabolite capable of differentiating between PD and control samples. The altered levels of the metabolites were correlated, suggesting that the elevations stem from a common mechanism involving arginine metabolism.
Conclusions: A combination of three metabolites, putrescine, tyrosine, and carnitine was able to correctly classify healthy participants from PD patients. Altered metabolite levels suggest altered arginine metabolism. The pattern of metabolomic disturbances was not due to the levodopa-based dopamine replacement medication because one of the patients was not yet taking levodopa but a dopamine receptor agonist.
Keywords: Biogenic amines; Carnitine; Eye; Levodopa; Linear discrimination; Mass spectrometry; Putrescine; Sensitivity; Spermidine.
© 2023. The Author(s).
Conflict of interest statement
Co-authors: Joan Serrano-Marín, Silvia Marin, David Bernal-Casas, Alejandro Lillo, Marc González-Subías, Gemma Navarro, Marta Cascante, Juan Sánchez-Navés, and Rafael Franco, declare that they do not have any conflict of interest to declare.
Figures
References
-
- Hansson O. Biomarkers for neurodegenerative Diseases. Nat Med 2021. 2021;27:6. - PubMed
-
- Cuenca N. The retina as a biomarker of Parkinson Disease. Invest Ophthalmol Vis Sci. 2019;60:8–8. - PubMed
-
- Veys L, Vandenabeele M, Ortuño-Lizarán I, Baekelandt V, Cuenca N, Moons L et al. Retinal α-synuclein deposits in Parkinson’s disease patients and animal models. Acta Neuropathologica 2019 137:3 [Internet]. 2019 [cited 2023 Jun 14];137:379–95. Available from: https://link.springer.com/article/10.1007/s00401-018-01956-z. - DOI - PubMed
-
- Tysnes OB, Storstein A. Epidemiology of Parkinson’s Disease. J neural transm. Springer-Verlag Wien; 2017. pp. 901–5. - PubMed
MeSH terms
Substances
LinkOut - more resources
Full Text Sources
Medical
