. 2023 Dec 4;12(1):56.
doi: 10.1186/s40035-023-00383-9.

Inhibiting tau-induced elevated nSMase2 activity and ceramides is therapeutic in an Alzheimer's disease mouse model

Affiliations

Inhibiting tau-induced elevated nSMase2 activity and ceramides is therapeutic in an Alzheimer's disease mouse model

Carolyn Tallon et al. Transl Neurodegener. .

Abstract

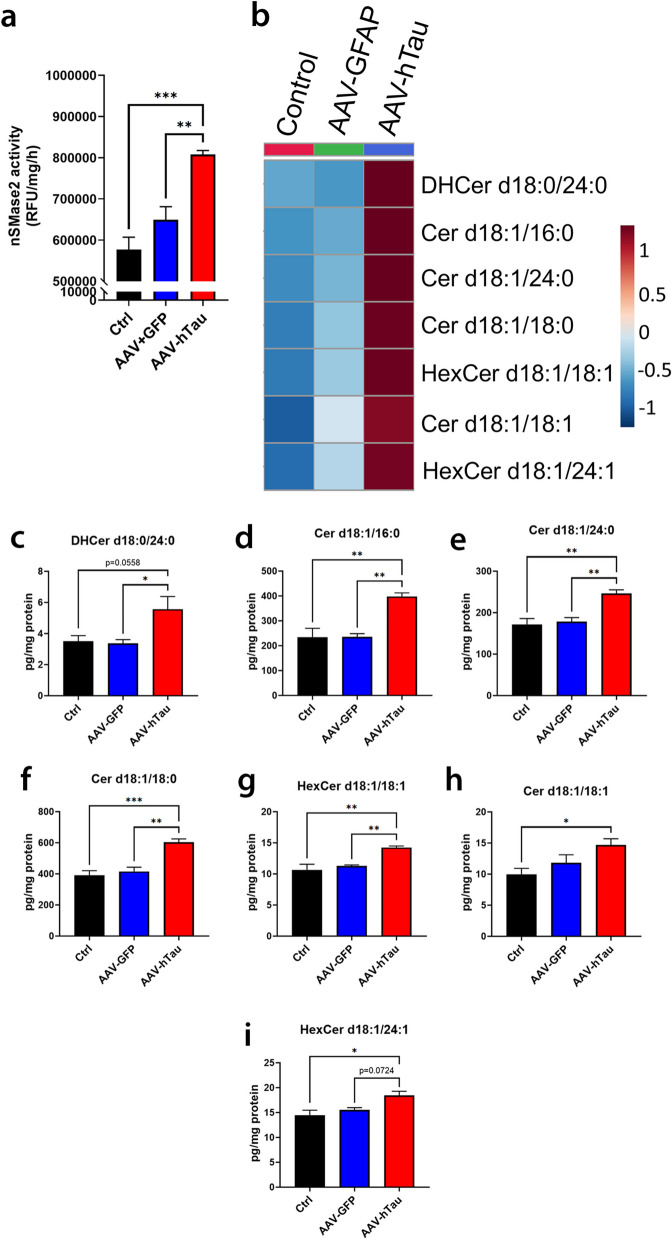
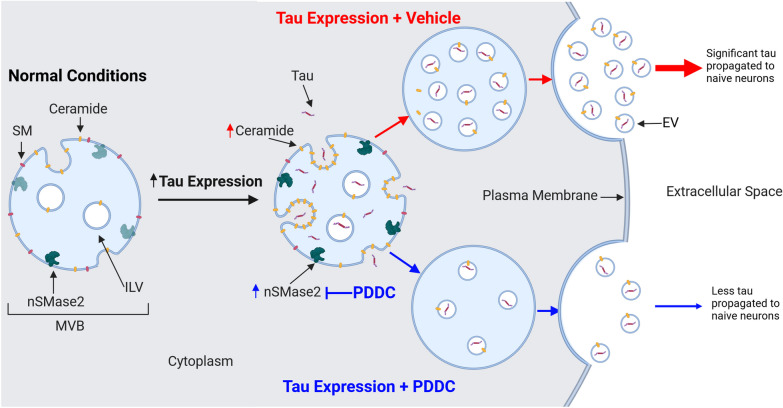
Background: Cognitive decline in Alzheimer's disease (AD) is associated with hyperphosphorylated tau (pTau) propagation between neurons along synaptically connected networks, in part via extracellular vesicles (EVs). EV biogenesis is triggered by ceramide enrichment at the plasma membrane from neutral sphingomyelinase2 (nSMase2)-mediated cleavage of sphingomyelin. We report, for the first time, that human tau expression elevates brain ceramides and nSMase2 activity.

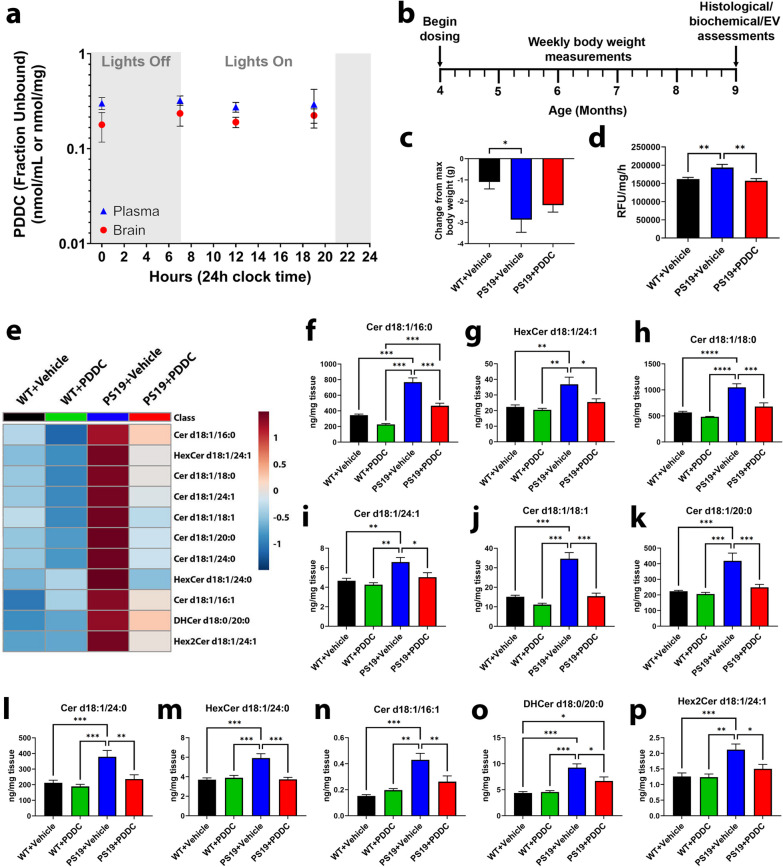
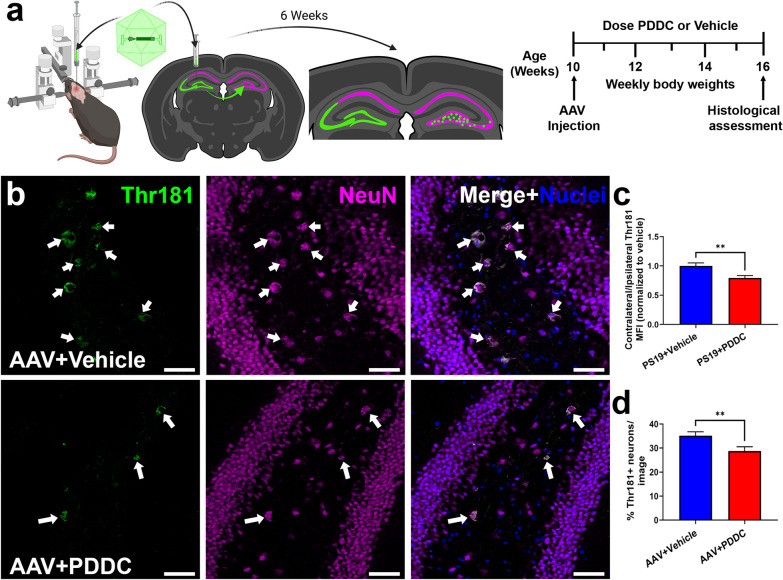
Methods: To determine the therapeutic benefit of inhibiting this elevation, we evaluated PDDC, the first potent, selective, orally bioavailable, and brain-penetrable nSMase2 inhibitor in the transgenic PS19 AD mouse model. Additionally, we directly evaluated the effect of PDDC on tau propagation in a mouse model where an adeno-associated virus (AAV) encoding P301L/S320F double mutant human tau was stereotaxically-injected unilaterally into the hippocampus. The contralateral transfer of the double mutant human tau to the dentate gyrus was monitored. We examined ceramide levels, histopathological changes, and pTau content within EVs isolated from the mouse plasma.

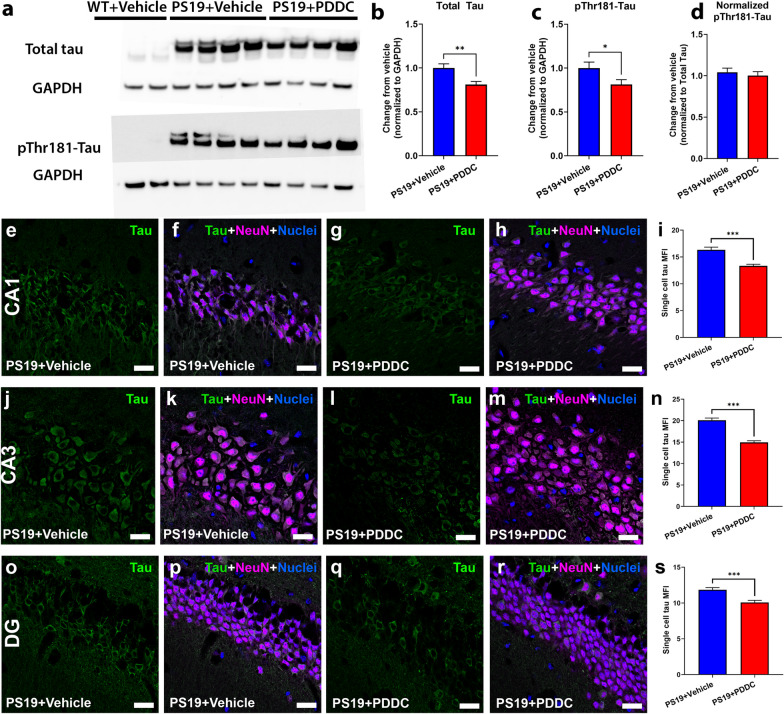
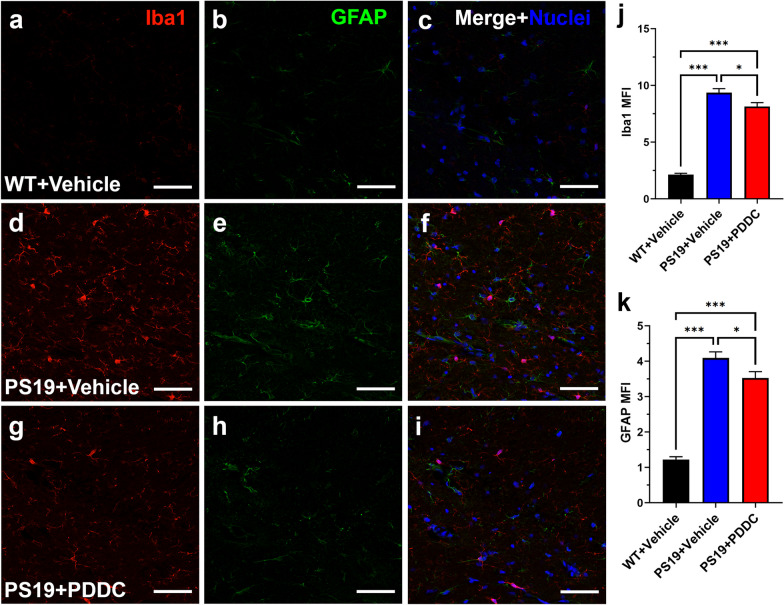
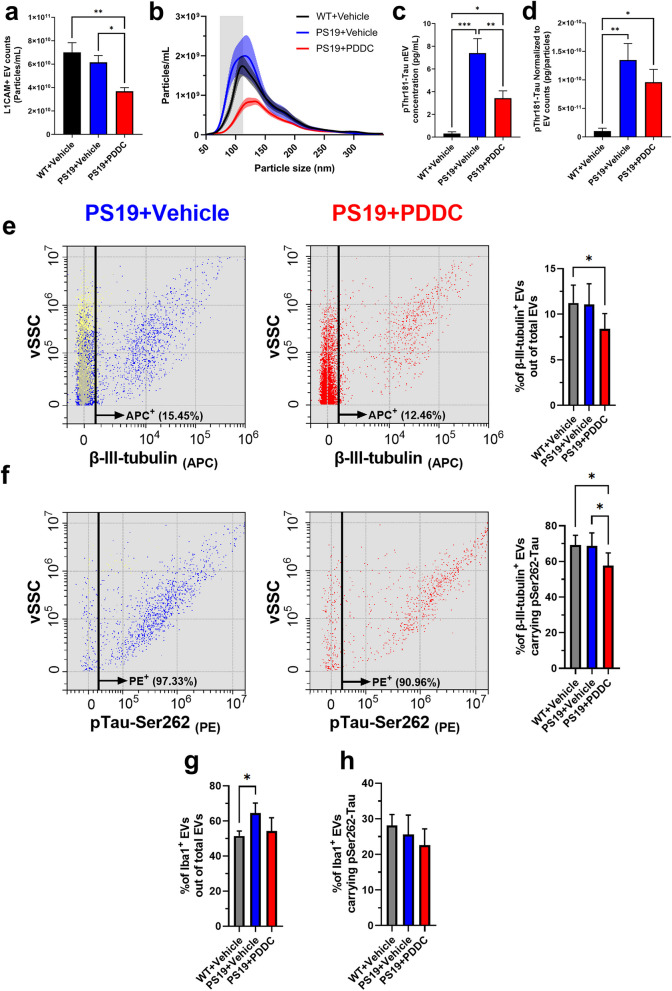
Results: Similar to human AD, the PS19 mice exhibited increased brain ceramide levels and nSMase2 activity; both were completely normalized by PDDC treatment. The PS19 mice also exhibited elevated tau immunostaining, thinning of hippocampal neuronal cell layers, increased mossy fiber synaptophysin immunostaining, and glial activation, all of which were pathologic features of human AD. PDDC treatment reduced these changes. The plasma of PDDC-treated PS19 mice had reduced levels of neuronal- and microglial-derived EVs, the former carrying lower pTau levels, compared to untreated mice. In the tau propagation model, PDDC normalized the tau-induced increase in brain ceramides and significantly reduced the amount of tau propagation to the contralateral side.

Conclusions: PDDC is a first-in-class therapeutic candidate that normalizes elevated brain ceramides and nSMase2 activity, leading to the slowing of tau spread in AD mice.

Keywords: Alzheimer’s disease; Ceramide; Extracellular vesicles; Neutral sphingomyelinase 2; Tau.


Conflict of interest statement

CT, AGT, RR, NJH and BSS are listed as inventors in patent applications filed by Johns Hopkins Technology Ventures covering novel compositions and utilities of nSMase2 inhibitors, including PDDC. This arrangement has been reviewed and approved by the Johns Hopkins University in accordance with its conflict-of-interest policies. Other authors declare that no conflict of interest exist.

Figures

Fig. 1
Fig. 1
Mutant tau expression induces significant increases in nSMase2 activity and ceramide levels in cultured neurons. a nSMase2 activity from untransduced control (Ctrl), AAV-GFP-transduced, and AAV-hTau (P301L/S320F)-transduced cells. b Heat map of the significantly elevated ceramide species in AAV-hTau (P301L/S320F)-transduced cells compared to either control or AAV-GFP-transduced cells. Colors represent fold changes of relative abundance compared to untransduced control cell levels. Red indicates increased fold-change, blue represents decreased fold-change. c–i Individual levels of the altered ceramides. n = 4/group. Bars represent mean ± SEM. *P < 0.05, **P < 0.01, ***P < 0.001. One-way ANOVA with Tukey’s multiple comparison
Fig. 2
Fig. 2
Brain ceramides are robustly elevated in PS19 mice and are normalized with PDDC treatment. a Plasma and brain levels of PDDC measured over 24 h following 4 weeks of dosing. N = 3/group at each time point. Points represent mean ± SEM. b Dosing schematic. c Percent change of body weight at the time of sacrifice from the maximum body weight over a 5-month dosing period in the WT + Vehicle, PS19 + Vehicle, and PS19 + PDDC groups. N = 16–20. d Quantification of hippocampal nSMase2 activity in the WT + Vehicle, PS19 + Vehicle, and PS19 + PDDC mice. N = 8–10/group. e Heatmap showing the ceramide species significantly reduced in PDDC-treated PS19 mice compared to vehicle-treated PS19 mice (P < 0.05). Colors represent relative abundance of each ceramide. f–p Cortical ceramide levels in WT and PS19 mice chronically treated with vehicle or PDDC. N = 6–11/group. Bars represent mean ± SEM. *P < 0.05. **P < 0.01. ***P < 0.001. One-way ANOVA with Tukey’s multiple comparison
Fig. 3
Fig. 3
PDDC treatment reduces hippocampal tau levels in PS19 mice. a Representative Western blots from micro-dissected hippocampal tissue showing total human tau (upper blot) and pThr181-Tau (lower blot). GAPDH shown as a loading control. b Quantification of Western blots for total tau. c Quantification of Western blots for pThr181-Tau. d pThr181-Tau level normalized to total tau. N = 11–12/group. es Representative images showing pThr181-Tau staining (green) and neuronal staining (magenta) from vehicle- and PDDC-treated PS19 mice in the CA1 (eh), CA3 (jm) and dentate gyrus (DG, or). Single-cell mean fluorescence intensity (MFI) from the CA1 (i), CA3 (n), and DG (s). Nuclei shown in blue. N = 120 cells from 4 mice/group. Bars represent mean ± SEM. *P < 0.05, **P < 0.01, ***P < 0.001. Scale bars, 20 µm. Gamma and brightness adjusted equally for all images presented. All graphs, unpaired two-tailed t-test
Fig. 4
Fig. 4
PDDC ameliorates hippocampal cell layer thinning and mossy fiber synaptophysin loss in PS19 mice. a–h Pyramidal cell layer thickness in the CA1 region (a–d) and granule cell layer thickness in the dentate gyrus (DG, e–h) of WT, vehicle-treated PS19 and PDDC-treated PS19 mice. Nuclei shown in blue. Scale bar, 20 µm. d, h Quantification of neuronal cell density counts from CA1 (d) and DG (h). N = 122–141 images from 7 to 8 mice/group. i–l Synaptophysin staining (green) of the mossy fiber layer in the CA3 from WT (i), vehicle-treated PS19 (j), and PDDC-treated PS19 (k) mice. Scale bars, 50 µm. l Quantification of the mean fluorescence intensity (MFI) of synaptophysin staining in the mossy fiber layer. Bars represent mean ± SEM. *P < 0.05, **P < 0.01, ***P < 0.001. N = 45–54 images from 5 to 6 mice/group. One-way ANOVA with Tukey’s multiple comparison
Fig. 5
Fig. 5
PDDC treatment reduces glial activation in the hippocampus of PS19 mice. Representative images from WT mice (a–c), vehicle-treated PS19 mice (d–f), and PDDC-treated PS19 mice (g–i). Microglia were stained with Iba1 (red). Astrocytes were stained with GFAP (green). Nuclei shown in blue. j Quantification of Iba1 MFI. k Quantification of GFAP MFI. N = 216–232 images from 9 to 10 mice/group. Bars represent mean ± SEM. **P < 0.01, ***P < 0.001. Scale bars, 50 µm. Gamma and brightness adjusted equally for all images. One-way ANOVA with Tukey’s multiple comparison
Fig. 6
Fig. 6
PDDC reduces plasma nEVs carrying pThr181-Tau in PS19 mice. a Quantification of L1CAM+ nEVs immunocaptured from the plasma of WT mice, vehicle-treated and PDDC-treated PS19 mice by NTA. N = 15–16. b Averaged size profiles of L1CAM+ nEVs from the plasma of WT mice, vehicle-treated and PDDC-treated PS19 mice. N = 15–16. c pThr181-Tau in lysed L1CAM+ nEVs from WT mice, vehicle-treated and PDDC-treated PS19 mice. N = 11–12. d pThr181-Tau normalized to nEV concentration from WT mice, vehicle-treated and PDDC-treated PS19 mice. N = 11–12. One-way ANOVA with Tukey’s multiple comparison. e Dot plots showing the vSSC vs APC-β-III-tubulin signal of BSE+ events gated in Fig. S5 for vehicle (left, blue events) and PDDC (middle, red events). Black line: threshold for APC-β-III-tubulin+ events. Yellow events indicate negative-control EVs labeled with BSE only. Bar graph: average percentage of APC-β-III-tubulin+ events out of total BSE+ events. f Dot plots showing the vSSC vs PE-pTau-Ser262 signal of APC-β-III-tubulin+ events gated in b. Black line: threshold for PE-pTau-Ser262+ signal. Bar graph: average percentage of APC-β-III-tubulin+ events double-positive for PE-pTau-Ser262. g, h Mean percentage of APC-Iba-1+ events out of total BSE+ events (g) or APC-Iba-1+ events double-positive for PE-pTau-Ser262 (h) for each group. e–h Two-way ANOVA. Bars represent mean ± SEM. *P < 0.05, **P < 0.01, ***P < 0.001
Fig. 7
Fig. 7
PDDC treatment reduces tau spread in an AAV mutant hTau propagation model. a AAV-hTau model and dosing schematic. Mice were stereotaxically injected at 10 weeks old into the left dorsal hippocampus with AAV-CBA-hTau24(P301L)(S320F)-WPRE which was taken up and expressed by cells in the left CA3 and dentate gyrus and propagated to the right DG hilus region over the course of 6 weeks. b Representative images of the contralateral DG showing pThr181-Tau staining (green) from vehicle-treated (top) and PDDC-treated (bottom) AAV-hTau mice. Neurons stained with NeuN (magenta). Nuclei shown in blue. Scale bars, 50 µm. Gamma and brightness adjusted equally for all images presented. c Quantification of pThr181-Tau MFI of the contralateral DG normalized to the ipsilateral DG pThr181-Tau MFI. N = 81–84 images/group from 17 mice/group. d Quantification of the percentage of pThr181-Tau+ neurons in the contralateral dentate gyrus. N = 56–72 images/group from 17 mice/group. Unpaired two-tailed t-test. **P < 0.01. Bars represent mean ± SEM
Fig. 8
Fig. 8
Summary of nSMase2’s role in EV-mediated tau propagation. Under normal MVB conditions, nSMase2 is active at basal levels with moderate ceramide levels. With tau expression, nSMase2 activity is increased and ceramide levels rise, leading to the invagination of the MVB membrane, forming more ILVs and trapping tau within, which are then released to the extracellular space as EVs carrying tau (black, upper pathway). These EVs can then pass on tau to naïve, healthy neurons, thus propagating the disease. With PDDC (blue, lower pathway), nSMase2 is inhibited and the amount of ceramides is reduced, forming fewer ILVs and trapping less tau which causes fewer naïve, healthy neurons to become seeded

Update of

References

    1. Cummings J. Anti-amyloid monoclonal antibodies are transformative treatments that redefine Alzheimer's disease therapeutics. Drugs. 2023;83(7):569–576. doi: 10.1007/s40265-023-01858-9. - DOI - PMC - PubMed
    1. Avgerinos KI, Ferrucci L, Kapogiannis D. Effects of monoclonal antibodies against amyloid-beta on clinical and biomarker outcomes and adverse event risks: a systematic review and meta-analysis of phase III RCTs in Alzheimer's disease. Ageing Res Rev. 2021;68:101339. doi: 10.1016/j.arr.2021.101339. - DOI - PMC - PubMed
    1. Braak H, Braak E. Neuropathological stageing of Alzheimer-related changes. Acta Neuropathol. 1991;82(4):239–259. doi: 10.1007/BF00308809. - DOI - PubMed
    1. Ossenkoppele R, Pichet Binette A, Groot C, Smith R, Strandberg O, Palmqvist S, et al. Amyloid and tau PET-positive cognitively unimpaired individuals are at high risk for future cognitive decline. Nat Med. 2022;28(11):2381–2387. doi: 10.1038/s41591-022-02049-x. - DOI - PMC - PubMed
    1. Simon D, Garcia-Garcia E, Royo F, Falcon-Perez JM, Avila J. Proteostasis of tau. Tau overexpression results in its secretion via membrane vesicles. FEBS Lett. 2012;586(1):47–54. doi: 10.1016/j.febslet.2011.11.022. - DOI - PubMed