An official website of the United States government
The .gov means it’s official.
Federal government websites often end in .gov or .mil. Before
sharing sensitive information, make sure you’re on a federal
government site.
The site is secure.
The https:// ensures that you are connecting to the
official website and that any information you provide is encrypted
and transmitted securely.
1 State Key Laboratory of Oncology in South China and Guangdong Provincial Clinical Research Center for Cancer, Sun Yat-sen University Cancer Center, Guangzhou, China.
2 Department of Biochemistry, School of Medicine, Southern University of Science and Technology, Shenzhen, China.
3 Shenzhen Institute of Pediatrics, Shenzhen Children's Hospital, Shenzhen, China.
4 Department of General Surgery (Colorectal Surgery), Guangdong Provincial Key Laboratory of Colorectal and Pelvic Floor Diseases, Guangdong Institute of Gastroenterology, Biomedical Innovation Center, The Sixth Affiliated Hospital, Sun Yat-sen University, Guangzhou, China.
5 Department of Pathology, Sun Yat-sen University Cancer Center, Guangzhou, China.
6 Department of Colorectal Surgery, Sun Yat-sen University Cancer Center, Guangzhou, China zhengjian@sysucc.org.cn lindx@cicams.ac.cn linjzh@sysucc.org.cn.
7 State Key Laboratory of Oncology in South China and Guangdong Provincial Clinical Research Center for Cancer, Sun Yat-sen University Cancer Center, Guangzhou, China zhengjian@sysucc.org.cn lindx@cicams.ac.cn linjzh@sysucc.org.cn.
8 Department of Etiology and Carcinogenesis, National Cancer Center/National Clinical Research Center/Cancer Hospital, Chinese Academy of Medical Sciences and Peking Union Medical College, Beijing, China.
9 Collaborative Innovation Center for Cancer Personalized Medicine, Nanjing Medical University, Nanjing, China.
10 Affiliated Cancer Hospital and Institute of Guangzhou Medical University, Guangzhou, China.
Objective:
Metastasis is the major cause of cancer death. However, what types of heterogenous cancer cells in primary tumour and how they metastasise to the target organs remain largely undiscovered.
Design:
We performed single-cell RNA sequencing and spatial transcriptomic analysis in primary colorectal cancer (CRC) and metastases in the liver (lCRC) or ovary (oCRC). We also conducted immunofluorescence staining and functional experiments to examine the mechanism.
Results:
Integrative analyses of epithelial cells reveal a stem-like cell cluster with high protein tyrosine phosphatase receptor type O (PTPRO) and achaete scute-like 2 (ASCL2) expression as the metastatic culprit. This cell cluster comprising distinct subpopulations shows distinct liver or ovary metastatic preference. Population 1 (P1) cells with high delta-like ligand 4 (DLL4) and MAF bZIP transcription factor A (MAFA) expression are enriched in primary CRC and oCRC, thus may be associated with ovarian metastasis. P3 cells having a similar expression pattern as cholangiocytes are found mainly in primary CRC and lCRC, presuming to be likely the culprits that specifically metastasise to the liver. Stem-like cells interacted with cancer-associated fibroblasts and endothelial cells via the DLL4-NOTCH signalling pathway to metastasise from primary CRC to the ovary. In the oCRC microenvironment, myofibroblasts provide cancer cells with glutamine and perform a metabolic reprogramming, which may be essential for cancer cells to localise and develop in the ovary.
Conclusion:
We uncover a mechanism for organ-specific CRC metastasis.
Keywords:
cancer stem cells; colorectal cancer; liver; metastasis; ovary.
Single-cell transcriptomic landscape in human CRC. (A) The schematics of sample collection, scRNA-seq…
Figure 1
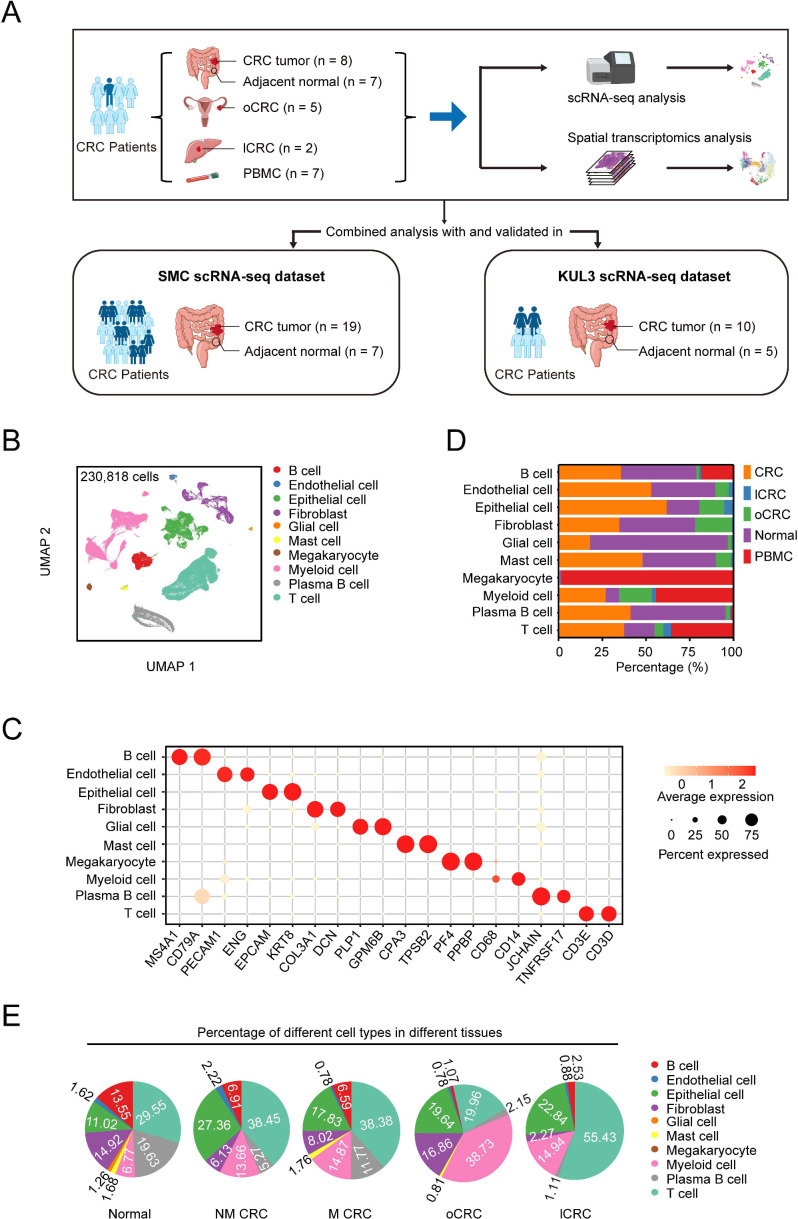
Single-cell transcriptomic landscape in human CRC. (A) The schematics of sample collection, scRNA-seq and spatial transcriptomic analysis of CRC and combined analysis with public datasets. CRC, colorectal cancer; lCRC, liver metastatic CRC; oCRC, ovarian metastatic CRC; PBMC, peripheral blood mononuclear cells. (B) Uniform manifold approximation and projection (UMAP) of 230 818 cells analysed by scRNA-seq across all samples. Clusters were annotated by the canonical markers. (C) The expression levels of the selected markers in different cell subtypes. Dot size indicates the fraction of expressing cells and the colours represent normalised gene expression levels. (D) Relative proportions of cell subtypes across different tissue types. (E) The proportion of different cell subtypes across normal, primary CRC from patients without distant metastases (NM-CRC), primary CRC from patients with distant metastases (M-CRC), oCRC and lCRC. Only cell subtypes with the proportion being >0.5% are shown.
Figure 2
Stem-like cells are the originator…
Figure 2
Stem-like cells are the originator of CRC metastasis. (A) UMAP showing 14 epithelial…
Figure 2
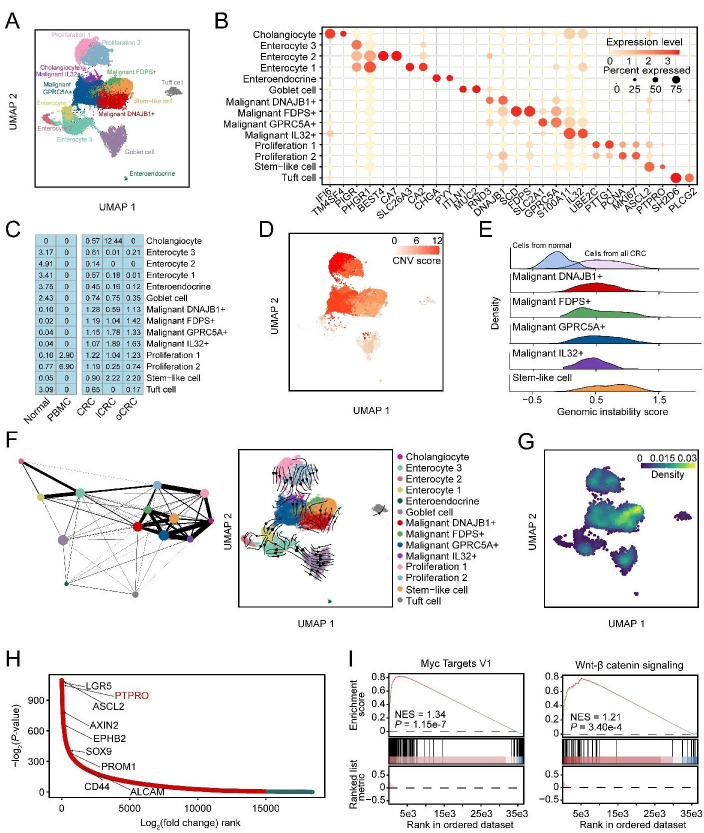
Stem-like cells are the originator of CRC metastasis. (A) UMAP showing 14 epithelial cell subtypes. (B) Bubble heatmap showing expression levels of marker genes (indicated as different colours) and the proportion of expressing cells (indicated as different dot sizes) across 14 epithelial cell subtypes shown in (A). (C) Tissue distribution of different epithelial cells estimated by Ro/e score. (D) UMAP plot showing the copy number variation (CNV) score of epithelial cells. (E) Ridgeline plot showing the genomic instability score of five malignant cell subtypes. (F) Partition-based graph abstraction analysis of 14 epithelial cell subtypes (left panel) and UMAP of RNA velocity of 14 epithelial cell subtypes (right panel). (G) Density of stemness scores of all epithelial cells. (H) Differential expressed genes between stem-like cells and the other cell subtypes. Y-axis indicates the -log2p value, genes ordered by log2fold change along the x-axis. (I) Gene set enrichment analysis showing MYC target V1 and WNT/β-catenin signalling pathway were upregulated in stem-like cells. The normalised enrichment score (NES) and false discovery rate (FDR) are included. CRC, colorectal cancer; lCRC, liver metastatic CRC; oCRC, ovarian metastatic CRC; PBMC, peripheral blood mononuclear cells.
Figure 3
Overexpression of achaete scute-like 2 …
Figure 3
Overexpression of achaete scute-like 2 ( ASCL2) and protein tyrosine phosphatase receptor type…
Figure 3
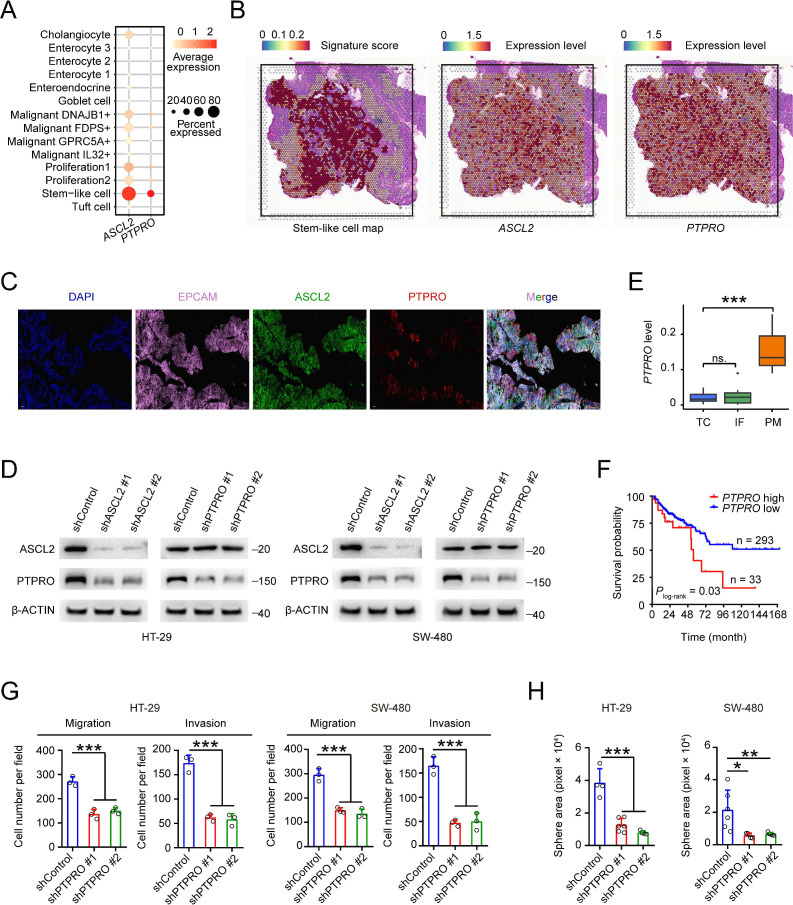
Overexpression of achaete scute-like 2 (ASCL2) and protein tyrosine phosphatase receptor type O (PTPRO) confers colorectal cancer (CRC) stem-like cells metastatic phenotype. (A) The expression levels of ASCL2 and PTPRO across 14 epithelial cell subtypes. Dot size indicates the fraction of expressing cells and the colour represents normalised expression levels. (B) Stem-like signature score (left panel) and the expression levels of ASCL2 (middle panel) and PTPRO (right panel) based on spatial transcriptomic analysis of primary CRC sample from patient 2. (C) Immunofluorescence showing stem-like cells aggregate in a primary CRC sample. Scale bars, 50 μm. (D) The effect of ASCL2 depletion (shASCL2) on the expression level of PTPRO. (E) Comparison of PTPRO expression levels in peritoneal CRC metastasis and primary CRC tumour centre or invasive front (from GSE75117 dataset). P values were determined by Wilcoxon rank-sum tests. (F) Kaplan-Meier estimation of overall survival time in patients with microsatellite stable CRC by the expression level of PTPRO. (G) The effect of PTPRO depletion (shPTPRO) on CRC cell migration and invasion abilities. (H) The effect of PTPRO expression change (shPTPRO) on CRC cell sphere-propagating capacity. Data in (G) and (H) are mean±SD from three independent experiments, *p<0.05, **p<0.01, ***p<0.001 were determined by one-way analysis of variance (ANOVA) test with Dunnett’s T3 multiple-comparison. IF, invasive front; ns, not significant; PM, peritoneal metastasis; TC, tumour centre.
Figure 4
Heterogeneity of CRC stem-like cells…
Figure 4
Heterogeneity of CRC stem-like cells in organ-specific CRC metastasis. (A) UMAP plot showing…
Figure 4
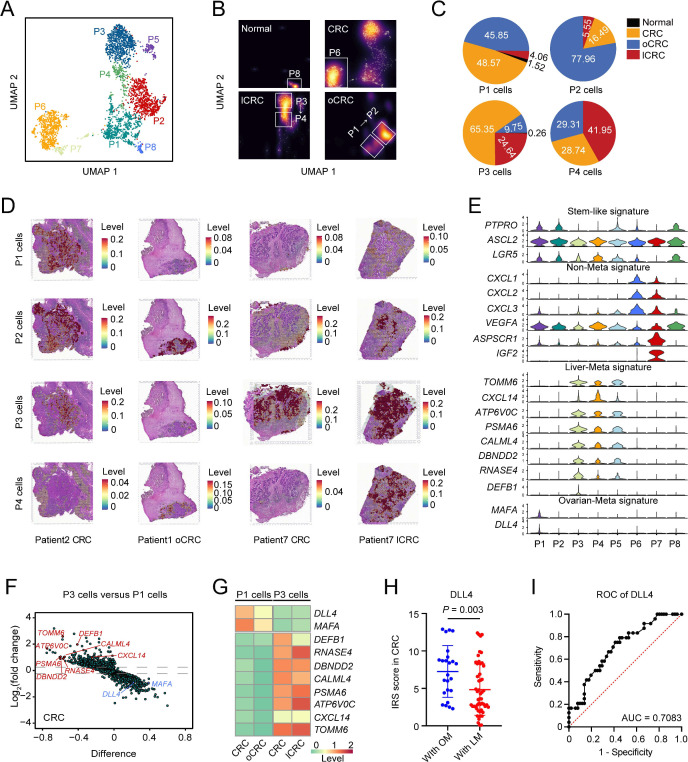
Heterogeneity of CRC stem-like cells in organ-specific CRC metastasis. (A) UMAP plot showing eight stem-like cell subtypes. (B) Density plot showing the distribution of stem-like cell subtypes in different organs. White box highlights high proportion of stem-like cell subtypes in each organ. (C) The proportions of P1, P2, P3 and P4 cells across normal, CRC, lCRC and oCRC. (D) Assignment of cell subtypes and their spatial distributions in CRC, lCRC and oCRC. (E) The signature expression of each stem-like cell subtype. (F) Differentially expressed genes (DEGs) between P1 cells and P3 cells in primary CRC. The x-axis represents the difference in the fraction of genes between the two groups. (G) Heatmap showing the expression level of some DEGs in P1 cells and P3 cells from primary CRC, oCRC and lCRC. (H) Comparison of DLL4 levels in primary CRC from patient with liver metastasis (LM) or ovarian metastasis (OM). P values were calculated by two-sided Wilcoxon rank-sum test. (I) Receiver operating characteristic (ROC) curves show predictive efficiency of DLL4 protein level in primary CRC for ovarian metastasis (area under the curve (AUC)=0.7083). CRC, colorectal cancer; lCRC, liver metastatic CRC; oCRC, ovarian metastatic CRC.
Figure 5
Delta-like ligand 4 (DLL4), achaete…
Figure 5
Delta-like ligand 4 (DLL4), achaete scute-like 2 (ASCL2) and protein tyrosine phosphatase receptor…
Figure 5
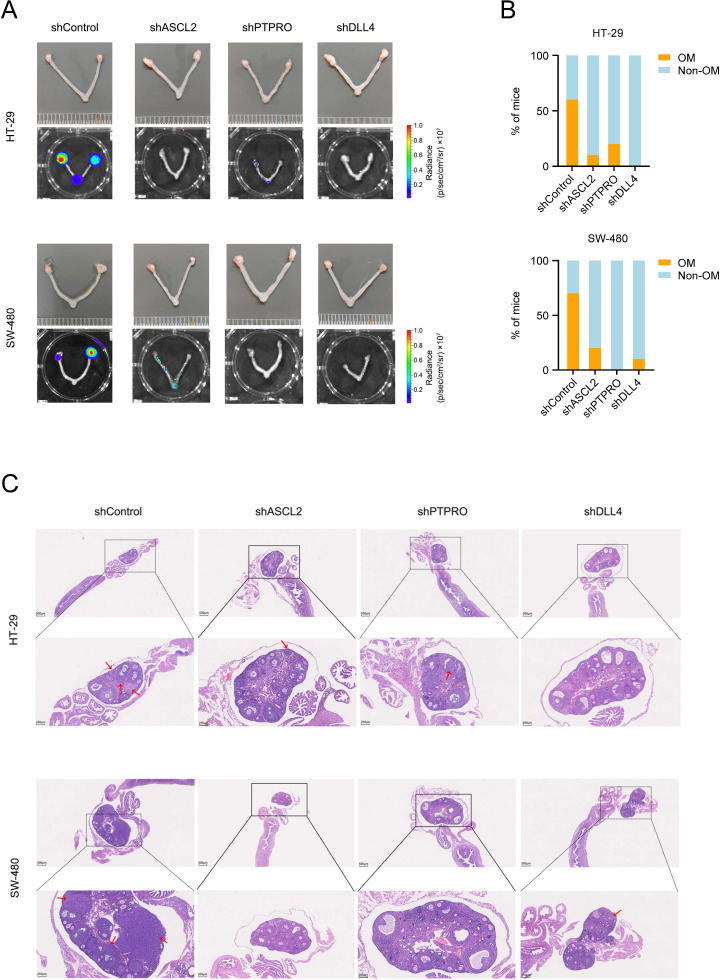
Delta-like ligand 4 (DLL4), achaete scute-like 2 (ASCL2) and protein tyrosine phosphatase receptor type O (PTPRO) promotes colorectal cancer (CRC) ovarian metastasis. (A) Effect of ASCL2, PTPRO or DLL4 depletion on the CRC ovarian metastasis. (B) The proportions of mice with ovarian metastasis (OM) or without ovarian metastasis (non-OM) as function of ASCL2, PTPRO or DLL4 depletion. (C) Representative H&E images of mouse OM. Red arrows indicate CRC metastases. Scale bars, 500 μm and 250 μm.
Figure 6
Interactions of stem-like cells with…
Figure 6
Interactions of stem-like cells with CAFs and differentiated endothelial cells in colorectal cancer…
Figure 6
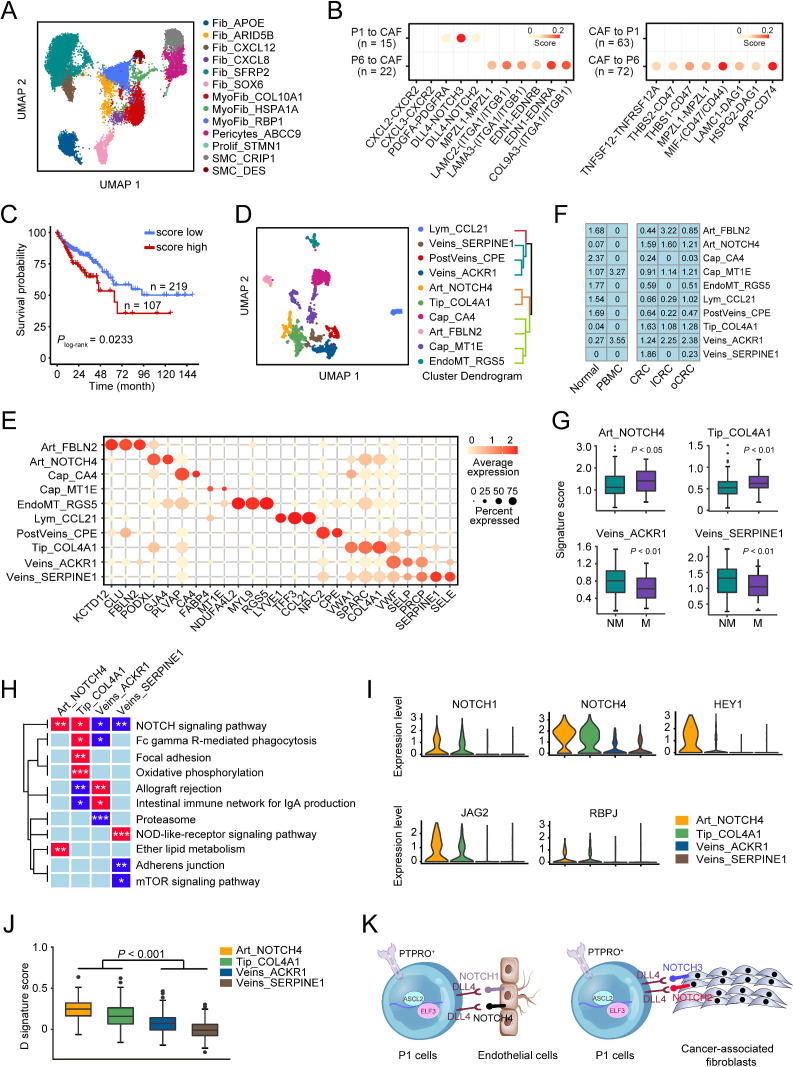
Interactions of stem-like cells with CAFs and differentiated endothelial cells in colorectal cancer (CRC) metastasis. (A) UMAP plot of 13 fibroblast cell subtypes. (B) Selected ligand-receptor pairs between CAFs and P1/P6 cells in primary CRC. (C) Kaplan-Meier estimation of survival time of patients with microsatellite stable CRC in The Cancer Genome Atlas (TCGA)-COAD dataset based on the score of P1-CAFs interactions. (D) UMAP plot of 10 endothelial cell subtypes (left panel) and hierarchical clustering of these endothelial cell subtypes (right panel). (E) Bubble heatmap showing expression levels of selected markers in different endothelial cell subtypes. Dot size indicates the fraction of expressing cells and the colours indicate the normalised expression level. (F) Tissue prevalence of endothelial cell subtypes estimated by Ro/e score. (G) The signature scores of four endothelial cell subtypes in patients with or without CRC metastases. Data were from TCGA-COAD dataset. P values by Wilcoxon rank-sum tests. (H) Heatmap of the gene expression levels in some pathways in four endothelial cell subtypes. (I) The differential expression levels of some genes in the NOTCH signalling pathway in four endothelial cell subtypes. (J) The comparison of the D signature score of differentiated endothelial cells in four endothelial cell subtypes. P values by Wilcoxon rank-sum tests. (K) The network involved in DLL4-NOTCH ligand-receptor pairs between P1 and CAFs or Art_NOTCH4/Tip_COL4A1.
Figure 7
Characterisation of the metabolic features…
Figure 7
Characterisation of the metabolic features in ovarian metastatic colorectal cancer (oCRC). (A) The…
Figure 7
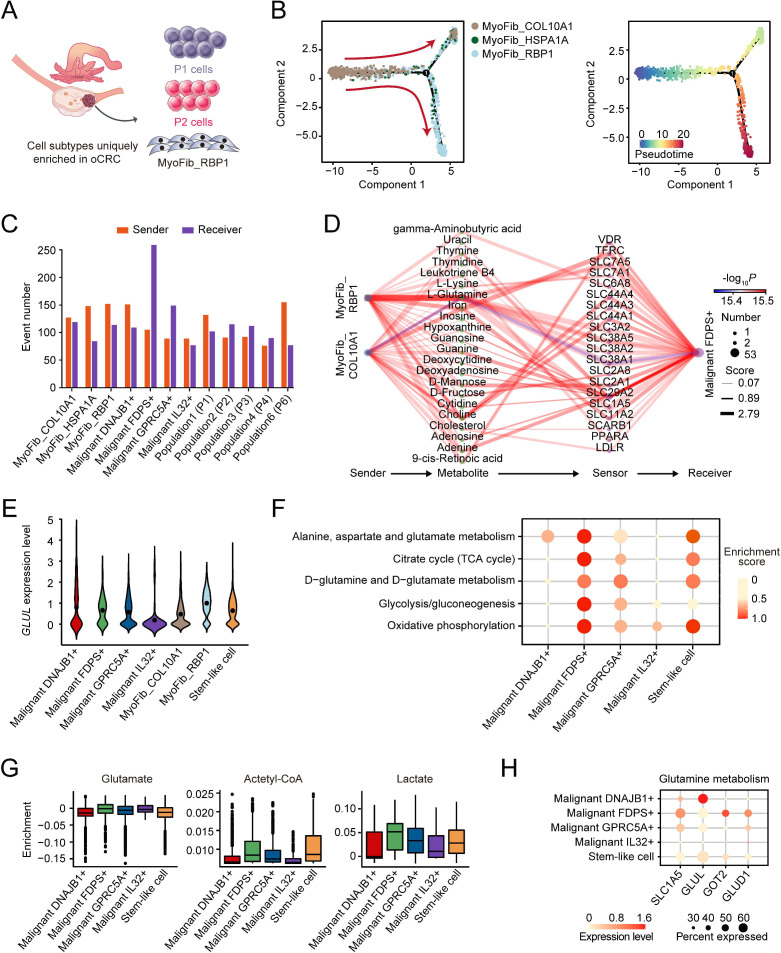
Characterisation of the metabolic features in ovarian metastatic colorectal cancer (oCRC). (A) The schematics of cell subtypes present in the oCRC microenvironment. (B) Pseudotime-ordered analysis of three myofibroblast subtypes inferred by Monocle2. Cell subtypes are labelled by different colours (left panel) and pseudotime (right panel). (C) Bar plot showing the number of communications for the senders and receivers. The x-axis is the myofibroblast and cancer cell subtypes while the y-axis is the number of communications. The orange bars and purple bars indicate the number of communications for sender and receiver cells, respectively. (D) The diagram showing the information flow of metabolite-sensor communications from myofibroblast to FDPS+ malignant cells through metabolites and sensors. The size of dots represents the number of connections. The lines connect the sender, metabolite, sensor and receiver. The colour of the line indicates the −log10(p value) and the width of line represents the communication score. (E) Violin plot showing the GLUL mRNA level of two myofibroblasts and five malignant cell subtypes. (F) The metabolic scores of five malignant cell subtypes in oCRC, showing that FDPS+ malignant cells had the highest metabolic activity. The circle size and colour darkness both represent the scaled metabolic score. (G) Box plot showing the enrichment level of select metabolites in five malignant cell subtypes. (H) The expression levels of genes in the glutamine metabolism pathway in five malignant cell subtypes. Dot size indicates the fraction of expressing cells while the colour indicates the normalised expression levels.
Torre LA, Islami F, Siegel RL, et al. . Global cancer in women: burden and trends. Cancer Epidemiol Biomarkers Prev 2017;26:444–57. 10.1158/1055-9965.EPI-16-0858
-
DOI
-
PubMed
Gupta GP, Massagué J. Cancer metastasis: building a framework. Cell 2006;127:679–95. 10.1016/j.cell.2006.11.001
-
DOI
-
PubMed
Biller LH, Schrag D. Diagnosis and treatment of metastatic colorectal cancer: a review. JAMA 2021;325:2405. 10.1001/jama.2021.6027
-
DOI
-
PubMed
Riihimäki M, Hemminki A, Sundquist J, et al. . Patterns of metastasis in colon and rectal cancer. Sci Rep 2016;6:29765. 10.1038/srep29765
-
DOI
-
PMC
-
PubMed
Bouzid H, Soualmia F, Oikonomopoulou K, et al. . Kallikrein-related peptidase 6 (KLK6) as a contributor toward an aggressive cancer cell phenotype: a potential role in colon cancer peritoneal metastasis. Biomolecules 2022;12:1003. 10.3390/biom12071003
-
DOI
-
PMC
-
PubMed