. 2024 Jan 10;44(2):e0340232023.
doi: 10.1523/JNEUROSCI.0340-23.2023.

Hippocampal Engrams Generate Variable Behavioral Responses and Brain-Wide Network States

Affiliations

Hippocampal Engrams Generate Variable Behavioral Responses and Brain-Wide Network States

Kaitlyn E Dorst et al. J Neurosci. .

Abstract

Freezing is a defensive behavior commonly examined during hippocampal-mediated fear engram reactivation. How these cellular populations engage the brain and modulate freezing across varying environmental demands is unclear. To address this, we optogenetically reactivated a fear engram in the dentate gyrus subregion of the hippocampus across three distinct contexts in male mice. We found that there were differential amounts of light-induced freezing depending on the size of the context in which reactivation occurred: mice demonstrated robust light-induced freezing in the most spatially restricted of the three contexts but not in the largest. We then utilized graph theoretical analyses to identify brain-wide alterations in cFos expression during engram reactivation across the smallest and largest contexts. Our manipulations induced positive interregional cFos correlations that were not observed in control conditions. Additionally, regions spanning putative "fear" and "defense" systems were recruited as hub regions in engram reactivation networks. Lastly, we compared the network generated from engram reactivation in the small context with a natural fear memory retrieval network. Here, we found shared characteristics such as modular composition and hub regions. By identifying and manipulating the circuits supporting memory function, as well as their corresponding brain-wide activity patterns, it is thereby possible to resolve systems-level biological mechanisms mediating memory's capacity to modulate behavioral states.

Keywords: engram; fear; hippocampus; learning; memory; networks.


Conflict of interest statement

The authors declare no competing financial interests.

Figures
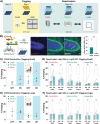
Figure 1.
Figure 1.
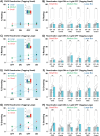
Light-induced freezing is contingent on both tagging and reactivation environments. A, Behavioral schedule for activity-dependent tagging of a hippocampal CFC engram and reactivation across environments. Mice are taken off of DOX 2 d prior to hippocampal CFC engram tagging. During the CFC session, mice are able to freely explore the environment (small or large chamber) for a handful of minutes before shocks are delivered (4 shocks, 0.5 mA, 2 s). Mice are placed back on the DOX diet after CFC. The tagged hippocampal CFC engram is optogenetically reactivated across 3 d while the mice are exploring novel environments of different sizes (SB, MB, LB). B, Schematic representation of the activity-dependent tagging of engram ensembles in the DG (left). Representative 20× image of the tagged-GFP + CFC engram (green), endogenous cFos (red), and ensemble overlap (merge, arrows) from a ChR2 animal conditioned in the large chamber (middle). The total number of GFP + and cFos + overlapping cells was divided by the total number of GFP + cells to calculate a reactivation profile (right). There was significantly greater engram reactivation in ChR2 animals when compared to controls. The scale bar represents 50 μm. C, % Freezing levels for all ChR2 animals conditioned in the small chamber (n = 9) binned across 2 min epochs during CFC engram reactivation sessions across all three environments. There was a significant increase in the amount of light-induced freezing in the SB compared to the LB (inset). D, Average % freezing across light epochs were compared within ChR2 (n = 9) and control (n = 14) animals that were conditioned in the small chamber across reactivation environments. The greatest difference in light-induced freezing was observed in ChR2 animals in the SB condition. Additionally, there was a significant difference in light-induced freezing in ChR2 animals in the MB, but no significant light-induced freezing in the LB. There was no significant difference in freezing across epochs in control animals during all three reactivation days. E, % Freezing levels for all ChR2 animals conditioned in the large chamber (n = 10) binned across 2 min epochs during CFC engram reactivation sessions across all three environments. There was no difference in light-induced freezing in any reactivation environment (inset). F, Average % freezing across light epochs were compared within ChR2 (n = 10) and control (n = 10) animals that were conditioned in the large chamber across reactivation environments. There was no significant difference in freezing across epochs and environments in any group. Data are presented as mean ± SEM. Significant differences are reported as **p < 0.01 and *p < 0.05.
Figure 2.
Figure 2.
CFC in either small or large environments increases freezing behavior. A, Average % freezing across time during CFC for ChR2 mice conditioned in the small chamber (n = 9; red triangle), Control mice conditioned in the small chamber (n = 14; dark gray triangle), ChR2 mice conditioned in the large chamber (n = 10; blue circle), and control mice conditioned in the large chamber (n = 10; light gray circle). Data are presented as mean ± SEM.
Figure 3.
Figure 3.
Active behaviors such as avoidance and distance are not affected by hippocampal CFC engram reactivation in the LB. A, % Time in center of the LB binned across 2 min epochs during CFC engram reactivation in ChR2 animals conditioned in the small chamber (n = 9) and control animals conditioned in the small chamber (n = 14). % Time in the center of the LB was further averaged across light epochs in the inset. There was a trending, but nonsignificant, decrease in the % time in center during light-ON in the ChR2 animals (inset). B, % Time in center of the LB binned across 2 min epochs during CFC engram reactivation in ChR2 animals conditioned in the large chamber (n = 10) and control animals conditioned in the large chamber (n = 10). % Time in the center of the LB was further averaged across light epochs in the inset. There was a trending, but nonsignificant decrease in the % time in center during light-ON in the control animals (inset). C, Distance traveled in the LB binned across 2 min epochs during CFC engram reactivation in ChR2 animals conditioned in the small chamber (n = 9) and control animals conditioned in the small chamber (n = 14). Distance traveled in the LB was further averaged across light epochs in the inset. There was no difference in distance traveled across all groups and light epochs (inset). D, Distance traveled in the LB binned across 2 min epochs during CFC engram reactivation in ChR2 animals conditioned in the large chamber (n = 10) and control animals conditioned in the large chamber (n = 10). The distance traveled in the LB was further averaged across light epochs in the inset. There was no difference in distance traveled across all groups and light epochs (inset). Data are presented as mean ± SEM.
Figure 4.
Figure 4.
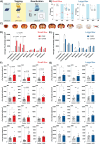
Hippocampal CFC engram manipulation differentially alters rearing and grooming behavior across environments. A, % Rearing levels for all ChR2 animals conditioned in the small chamber (n = 9) binned across 2 min epochs during CFC engram reactivation sessions across all three environments. On average, there was no significant difference in the amount of light-induced rearing during light-ON across all three environments (inset). B, Average % rearing across light epochs was compared within ChR2 (n = 9) and control (n = 14) animals that were conditioned in the small chamber across reactivation environments. C, % Rearing levels for all ChR2 animals conditioned in the large chamber (n = 10) binned across 2 min epochs during CFC engram reactivation sessions across all three environments. On average, there was a trending, but nonsignificant, difference in light-induced rearing during light-ON across reactivation environments with post hoc comparisons revealing a difference in rearing in the SB and MB (inset). D, Average % rearing across light epochs was compared within ChR2 (n = 10) and control (n = 10) animals that were conditioned in the large chamber across reactivation environments. E, % Grooming levels for all ChR2 animals conditioned in the small chamber (n = 9) binned across 2 min epochs during CFC engram reactivation sessions across all three environments. On average, there was a significant difference in the amount of grooming during light-ON in the SB and LB when compared to the MB (inset). F, Average % grooming across light epochs was compared within ChR2 (n = 9) and control (n = 14) animals that were conditioned in the small chamber across reactivation environments. G, % Grooming levels for all ChR2 animals conditioned in the large chamber (n = 10) binned across 2 min epochs during CFC engram reactivation sessions across all three environments. On average, there was no difference in grooming during light-ON across all three reactivation environments (inset). H, Average % grooming across light epochs was compared within ChR2 (n = 10) and control (n = 10) animals that were conditioned in the large chamber across reactivation environments. Data are presented as mean ± SEM. Significant differences are reported as **p < 0.01 and *p < 0.05.
Figure 5.
Figure 5.
Engram reactivation in the SB increases brain-wide cFos density in areas mediating memory and behavior. A, Schematic of the experimental paradigm. Animals experience activity-dependent tagging of a CFC engram, but reactivation for only 1 d after the DOX window is closed. They are perfused 90 min after the last light-ON epoch to capture peak endogenous cFos expression. B, % Freezing levels for ChR2 animals (n = 8) and control animals (n = 8) for the SB condition across light epochs. There is a significant increase in the amount of light-induced freezing in only ChR2 animals (inset). % Freezing for separate groups of ChR2 animals (n = 8) and control animals (n = 8) for the LB condition across light epochs. There is no difference in the amount of freezing of the chamber across groups (inset). **p < 0.01. C, Example heatmap of rodent brain-wide cFos density (cells/mm3) from a ChR2-injected animal in the SB condition. D, Aggregation of the average cFos density in 10 parent brain areas registered to the Allen Brain Atlas in the SB condition. The observed q-values that are considered “discoveries” after the FDR correction are reported. E, Aggregation of the average cFos density in 10 parent brain areas registered to the Allen Brain Atlas in the LB condition. The observed q-values that are considered “discoveries” after the FDR correction are reported. F, cFos density for 12 individual ROIs were compared between ChR2 and Control animals in the SB condition using multiple unpaired Welch-corrected t tests with a Benjamini–Hochberg correction of 5%. Observed q-values that are considered discoveries after the FDR are reported. G, cFos density for 12 individual ROIs were compared between ChR2 and Control animals in the LB condition using multiple unpaired Welch-corrected t tests corrected with a Benjamini–Hochberg correction of 5%. Data are presented as mean ± SEM. In all panels, # is indicative of statistical significance before the FDR correction was applied, yet failed to be considered an FDR-corrected discovery.
Figure 6.
Figure 6.
Enhanced DG cFos density in ChR2 SB animals relates to light-induced freezing. A, cFos density measurements in the DG in ChR2 and Control animals across both the SB and the LB (n = 8 animals/group). *p < 0.05. B, Linear regression analyses comparing cFos density expression to % freezing during hippocampal CFC engram reactivation in the SB condition. There is a positive relationship between DG cFos and % freezing only in ChR2 animals (top) that is not observed in control animals (bottom). C, Ensemble overlap between endogenous cFos and the ChR2-eYFP engram is greater than chance in ChR2 SB animals (n = 8) as revealed by a one-sample t test (t = 6.860, p = 0.0002). Representative images of endogenous cFos (red), the tagged hippocampal CFC engram (green), and ensemble overlap (merge, arrows) (right). The scale bar represents 50 μm.
Figure 7.
Figure 7.
Hippocampal CFC engram reactivation differentially increases cFos correlations across environments. A, cFos interregional Spearman's correlation matrix generated from ChR2 SB (n = 8) animals across 147 brain ROIs organized by anatomical location (Table 1). Warmer colors are indicative of more positive correlations and cooler colors for more negative correlations. B, cFos interregional Spearman's correlation matrix generated from control SB (n = 8) animals across 147 brain ROIs organized by anatomical location (Table 1). Warmer colors are indicative of more positive correlations and cooler colors for more negative correlations. C, cFos interregional Spearman's correlation matrix generated from the natural retrieval group (n = 12) across 147 brain ROIs organized by anatomical location (Table 1). Warmer colors are indicative of more positive correlations and cooler colors for more negative correlations. D, cFos interregional Spearman's correlation matrix generated from ChR2 LB (n = 8) animals across 147 brain ROIs organized by anatomical location (Table 1). Warmer colors are indicative of more positive correlations and cooler colors for more negative correlations. E, cFos interregional Spearman's correlation matrix generated from Control LB (n = 8) animals across 147 brain ROIs organized by anatomical location (Table 1). Warmer colors are indicative of more positive correlations and cooler colors for more negative correlations. F, Color key (left) for parent regions based on the Allen Brain Atlas (cyan, cerebellum; yellow, cortical plate; lilac, cortical subplate; red, hypothalamus; blue, medulla; orange, midbrain; green, pallidum; pink, pons; gray, striatum; purple, thalamus). Color key (right) for Spearman's correlation values ranging from −1 to 1. Warmer colors (i.e., yellows and reds) are indicative of positive values and cooler colors (i.e., greens and blues) are indicative of negative values. G, Distributions of all Spearman's correlation values for all experimental conditions. Both ChR2 SB and ChR2 LB have a greater average Spearman correlation than either the control group or the natural retrieval condition. H, UMAP representations of all experimental conditions. Each point in UMAP space represents all cross-correlation values of an individual brain region reduced in two-dimensional space. All conditions are separate in linear space, yet both control groups were closer in space than either of the ChR2 groups, showing that these states are inherently distinct. Additionally, the natural retrieval condition clustered between the ChR2 and control groups. I, UMAP representations of brain regions spanning Allen Brain Atlas parent regions. Each point in UMAP space represents all cross-correlation values of an individual brain region reduced in two-dimensional space. Brain regions do not show distinct segregation, as all of these colors are intermingled, suggesting that engram stimulation does not bias particular brain regions into separable linear spaces.
Figure 8.
Figure 8.
Natural retrieval of a fear memory produces similar freezing levels to hippocampal CFC engram reactivation in the SB. A, Schematic of the behavioral schedule for a group of naive mice (n = 12) that do not have engram tagging and, therefore, do not need to be on the DOX diet. Mice are conditioned as other groups (four shocks, 2 s each, 0.5 mA) and are placed back in the original context in which they got shocked 24 h after CFC for a 3 min retrieval session. B, % Freezing levels for the natural retrieval group (n = 12) and the average light-ON % freezing levels for all animals conditioned in the small chamber and underwent reactivation in the ChR2 SB condition (n = 8). An unpaired t test determined that the amount of freezing during these two experimental conditions was statistically insignificant (t = 1.184, p = 0.2519).
Figure 9.
Figure 9.
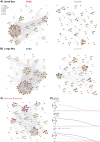
Engram reactivation creates unique network topologies. A, ChR2 (left) and control (right) networks generated in the SB condition. B, ChR2 (left) and control (right) networks generated in the LB condition. C, Natural retrieval network generated in the original fear conditioning context. D, Degree rank plot for all 147 nodes across all experimental conditions. There were significantly higher-degree nodes in ChR2 networks across both the SB (top) and LB (middle) environments when compared to controls. Additionally, both ChR2 groups had greater high-degree nodes than the natural retrieval group and the LB ChR2 had a significantly greater distribution of high-degree nodes than the ChR2 SB group (bottom). +Gray-colored edges are positive correlations whereas red edges are negative. Edges were only kept if the Spearman correlation coefficient survived a 5% FDR correction. ++Nodes are colored by their respective Figure 7F ‘Parent Region’ (Fig. 4A, legend). Communities are denoted by their spatial proximity, i.e., communities are clustered together in circular shapes within the networks. Communities were discovered using the Leiden algorithm.
Figure 10.
Figure 10.
The network structure is not comparable across experimental conditions. A, The number of edges in each network. There are more significant edges left after the 5% FDR correction in both ChR2 networks relative to the Control and natural retrieval groups. B, The number of island nodes (i.e., nodes with zero connections) for each network. There are higher island nodes in the control networks relative to both ChR2 networks. C, # of modules as a result of applying the Leiden community detection algorithm for each network. There are more modules in both Control and natural retrieval networks than there are in both ChR2 networks. D, Average module size for each network. Although the ChR2 group had fewer modules, the average size of their respective modules was much greater than the average size of the modules in the control and natural retrieval groups.
Figure 11.
Figure 11.
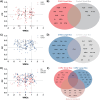
Regions involving memory and defensive behavior act as central hubs in ChR2 and natural retrieval networks. A, The distribution of 50 nodes along five centrality metrics (degree, betweenness, closeness, clustering coefficient, and eigenvector) for the ChR2 SB network. “Hub scores” were generated for all 147 nodes in the network. Nodes falling into the top 20% (degree, betweenness, closeness, eigenvector) or bottom 20% (clustering coefficient) received a + 1. Nodes that fell in these distributions were assigned colors based on their anatomical location. B, Central hubs for both ChR2 and control groups in the SB and LB conditions. We define central hubs as having a score of three or greater. Shared hubs lie in the intersection of the two groups. C, Central hubs for both ChR2 groups and the natural retrieval condition. We define central hubs as having a score of three or greater. Shared hubs lie in the intersection of the two groups.
Figure 12.
Figure 12.
Regions involving memory and behavior act as modular hubs in ChR2 conditions and natural retrieval conditions. A, WMDz and participation coefficient (PC) were generated for all 147 regions for the ChR2 and control groups in the SB environment. Classification of a modular hub would pass a WMDz threshold of 1.0 and a PC threshold of 0.5. B, There were no shared modular hubs across groups in the SB condition. Yet, regions implicated in memory and behavior still serve as unique modular hubs in the ChR2 group. C, WMDz and PC were generated for all 147 regions for the ChR2 and control groups in the LB environment. Classification of a modular hub would pass a WMDz threshold of 1.0 and a PC threshold of 0.5. D, The CLA was the only shared hub across the ChR2 and Control groups in the LB. The ChR2 group also contained unique modular hubs implicated in memory and behavior. E, WMDz and PC were generated for all 147 regions for the ChR2 groups and the natural retrieval group. Classification of a modular hub would pass a WMDz threshold of 1.0 and a PC threshold of 0.5. F, The CLA was the only shared modular hub region between both ChR2 groups, yet there were also no shared modular hubs with the natural retrieval group. Unique modular hubs in the natural retrieval condition are also implicated in memory and defensive behavior.

References

    1. Aggleton JP, Christiansen K (2015) Chapter 4: The subiculum: the heart of the extended hippocampal system. In: Progress in brain research (O’Mara S, Tsanov M, ed), pp 65–82: Elsevier. The connected hippocampus. - PubMed
    1. Aktas ME, Akbas E, Fatmaoui AE (2019) Persistence homology of networks: methods and applications. Appl Netw Sci 4:1–28. 10.1007/s41109-019-0179-3 - DOI
    1. Amano T, Duvarci S, Popa D, Pare D (2011) The fear circuit revisited: contributions of the basal amygdala nuclei to conditioned fear. J Neurosci 31:15481–15489. 10.1523/JNEUROSCI.3410-11.2011 - DOI - PMC - PubMed
    1. Basile GA, Quartu M, Bertino S, Serra MP, Boi M, Bramanti A, Anastasi GP, Milardi D, Cacciola A (2021) Red nucleus structure and function: from anatomy to clinical neurosciences. Brain Struct Funct 226:69–91. 10.1007/s00429-020-02171-x - DOI - PMC - PubMed
    1. Benjamini Y, Hochberg Y (1995) Controlling the false discovery rate: a practical and powerful approach to multiple testing. J R Stat Soc Ser B Methodol 57:289–300.

Publication types

LinkOut - more resources