

Identification of Immune-Related Genes as Biomarkers for Uremia
- PMID: 38050489
- PMCID: PMC10693762
- DOI: 10.2147/IJGM.S435732
Identification of Immune-Related Genes as Biomarkers for Uremia
Abstract
Purpose: Uremia, which is characterized by immunodeficiency, is associated with the deterioration of kidney function. Immune-related genes (IRGs) are crucial for uremia progression.
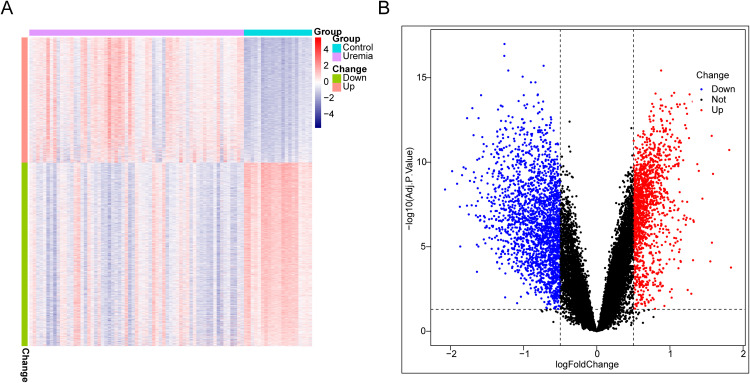
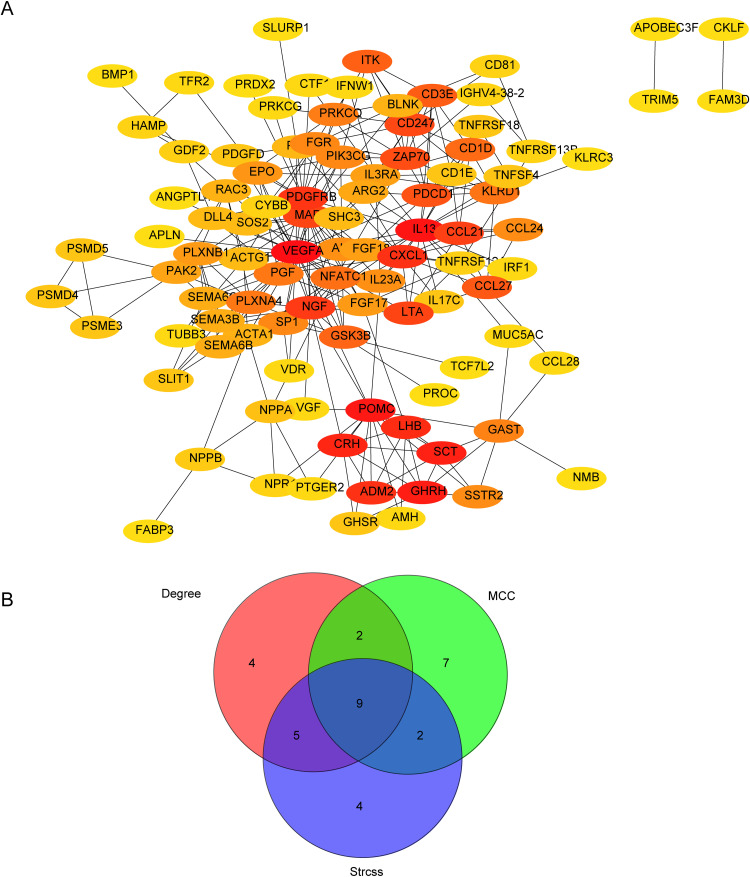
Methods: The co-expression network was constructed to identify key modular genes associated with uremia. IRGs were intersected with differentially expressed genes (DEGs) between uremia and control groups and key modular genes to obtain differentially expressed IRGs (DEIRGs). DEIRGs were subjected to functional enrichment analysis. The protein-protein interaction (PPI) network was constructed. The candidate genes were identified using the cytoHubba tool. The biomarkers were identified using various machine learning algorithms. The diagnostic value of the biomarkers was evaluated using receiver operating characteristic (ROC) analysis. The immune infiltration analysis was implemented. The biological pathways of biomarkers were identified using gene set enrichment analysis and ingenuity pathway analysis. The mRNA expression of biomarkers was validated using blood samples of patients with uremia and healthy subjects with quantitative real-time polymerase chain reaction (qRT-PCR).
Results: In total, four biomarkers (PDCD1, NGF, PDGFRB, and ZAP70) were identified by machine learning methods. ROC analysis demonstrated that the area under the curve values of individual biomarkers were > 0.9, indicating good diagnostic power. The nomogram model of biomarkers exhibited good predictive power. The proportions of six immune cells significantly varied between the uremia and control groups. ZAP70 expression was positively correlated with the proportions of resting natural killer (NK) cells, naïve B cells, and regulatory T cells. Functional enrichment analysis revealed that the biomarkers were mainly associated with translational function and neuroactive ligand-receptor interaction. ZAP70 regulated NK cell signaling. The PDCD1 and NGF expression levels determined using qRT-PCR were consistent with those determined using bioinformatics analysis.
Conclusion: PDCD1, NGF, PDGFRB, and ZAP70 were identified as biomarkers for uremia, providing a theoretical foundation for uremia diagnosis.
Keywords: WGCNA; diagnosis; differential expression analysis; immune infiltration; nomogram.
© 2023 Lyu et al.
Conflict of interest statement
The authors report no conflicts of interest in this work.
Figures


Similar articles
-
Immune-associated biomarkers identification for diagnosing carotid plaque progression with uremia through systematical bioinformatics and machine learning analysis.Eur J Med Res. 2023 Feb 23;28(1):92. doi: 10.1186/s40001-023-01043-4. Eur J Med Res. 2023. PMID: 36823662 Free PMC article.
-
Identification and Analysis of Potential Immune-Related Biomarkers in Endometriosis.J Immunol Res. 2023 Jan 10;2023:2975581. doi: 10.1155/2023/2975581. eCollection 2023. J Immunol Res. 2023. PMID: 36660246 Free PMC article.
-
Identification of key immune genes of drug-induced liver injury induced by tolvaptan based on bioinformatics.Naunyn Schmiedebergs Arch Pharmacol. 2025 Apr 3. doi: 10.1007/s00210-025-04084-0. Online ahead of print. Naunyn Schmiedebergs Arch Pharmacol. 2025. PMID: 40178603
-
Differentially Infiltrated Identification of Novel Diagnostic Biomarkers Associated with Immune Infiltration in Nasopharyngeal Carcinoma.Dis Markers. 2022 Nov 17;2022:3934704. doi: 10.1155/2022/3934704. eCollection 2022. Dis Markers. 2022. PMID: 36438903 Free PMC article.
-
Integrated identification of key immune related genes and patterns of immune infiltration in calcified aortic valvular disease: A network based meta-analysis.Front Genet. 2022 Sep 21;13:971808. doi: 10.3389/fgene.2022.971808. eCollection 2022. Front Genet. 2022. PMID: 36212153 Free PMC article.
References
LinkOut - more resources
Full Text Sources
Research Materials
Miscellaneous
