. 2024 Feb;115(2):369-384.
doi: 10.1111/cas.16023. Epub 2023 Dec 4.

Cross-talk between gastric cancer and hepatic stellate cells promotes invadopodia formation during liver metastasis

Affiliations

Cross-talk between gastric cancer and hepatic stellate cells promotes invadopodia formation during liver metastasis

Chuanfu Ren et al. Cancer Sci. 2024 Feb.

Abstract

In gastric cancer (GC), the liver is a common organ for distant metastasis, and patients with gastric cancer with liver metastasis (GCLM) generally have poor prognosis. The mechanism of GCLM is unclear. Invadopodia are special membrane protrusions formed by tumor cells that can degrade the basement membrane and ECM. Herein, we investigated the role of invadopodia in GCLM. We found that the levels of invadopodia-associated proteins were significantly higher in liver metastasis than in the primary tumors of patients with GCLM. Furthermore, GC cells could activate hepatic stellate cells (HSCs) within the tumor microenvironment of liver metastases through the secretion of platelet-derived growth factor subunit B (PDGFB). Activated HSCs secreted hepatocyte growth factor (HGF), which activated the MET proto-oncogene, MET receptor of GC cells, thereby promoting invadopodia formation through the PI3K/AKT pathway and subsequently enhancing the invasion and metastasis of GC cells. Therefore, cross-talk between GC cells and HSCs by PDGFB/platelet derived growth factor receptor beta (PDGFRβ) and the HGF/MET axis might represent potential therapeutic targets to treat GCLM.

Keywords: HGF/MET; gastric cancer; hepatic stellate cell; invadopodia; liver metastasis.


Conflict of interest statement

The authors declare no conflict of interest.

Figures
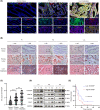
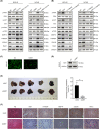
FIGURE 1
FIGURE 1
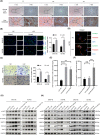
Invadopodia‐associated proteins are upregulated in liver metastases of patients with gastric cancer with liver metastasis (GCLM) and correlates with the prognosis of patients with GCLM. (A) Multiplexed fluorescent immunohistochemistry (IHC) of invadopodia‐related proteins N‐WASP, MMP14, CDC42, and RAC1 in normal tissues, primary tumors, and liver metastases from patients with GCLM (magnification, ×400). (B) IHC of N‐WASP in normal tissues, primary tumors, and corresponding liver metastases of patients with GCLM (magnification, ×100 and ×400). (C) IHC scores of N‐WASP in normal tissues, primary tumors, and corresponding liver metastases from patients with GCLM. (D) Western blot analysis of invadopodia‐associated protein (N‐WASP, MMP14, CDC42, and RAC1) levels in normal tissues (N), primary tumors (T), and corresponding liver metastases (M) of patients with GCLM. (E) Overall survival in patients with GCLM with different N‐WASP expression levels. Results are shown as mean ± SD of three independent experiments, each experiment was carried out in triplicate. ***p < 0.001; ****p < 0.0001.
FIGURE 2
FIGURE 2
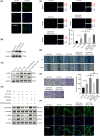
Hepatic stellate cells promote invadopodia formation in gastric cancer (GC) cells through the hepatocyte growth factor (HGF)/MET pathway. (A) Immunohistochemistry of α‐smooth muscle actin in normal liver tissue and liver metastases of patients with gastric cancer with liver metastasis (GCLM) (magnification, ×100 and ×400). (B) EdU assay to detect the proliferation of GC cells and GC cells cocultured with LX2. (C) Transwell assay to detect cell migration. (D) Colocalization of cortactin (green) and phalloidin (red) to observe the formation of invadopodia (white arrow) in Hs746t cells. Nuclei were stained with DAPI and observed under a confocal fluorescence microscope. (E) ELISA for the HGF concentration in supernatant of LX2 cells (NC) and LX2 cocultured with MKN‐45 and Hs746t cells. (F) ELISA for the HGF concentration in the serum of healthy controls, patients with GC, and patients with GCLM. (G) Western blot analysis of invadopodia‐associated protein levels in GC cells treated with control conditioned medium (Ctrl CM), conditioned medium from LX2 cells (LX2 CM), and coculture with LX2 in the presence or absence of recombinant HGF (40 ng/mL) or HGF‐Ab (neutralizing Ab against HGF; GTX10678, 0.5 μg/mL) for 48 h. (H) Western blot analysis of phospho‐ (p)‐MET, MET, and invadopodia‐associated proteins in GC cells treated with Ctrl CM and LX2 CM in the presence or absence of recombinant HGF (40 ng/mL) or foretinib (MET inhibitor; 1 μmol/mL) for 48 h. Results are shown as the mean ± SD of three independent experiments. Each experiment was performed in triplicate. **p < 0.01; ***p < 0.001; ****p < 0.0001. ns, not significant.
FIGURE 3
FIGURE 3
Gastric cancer (GC) cells activate hepatic stellate cells (HSCs) through the platelet‐derived growth factor subunit B (PDGFB)/platelet‐derived growth factor receptor beta (PDGFRβ) pathway. (A) Immunofluorescence detection of α‐smooth muscle actin (α‐SMA) expression in LX2 cells and in LX2 cocultured with GC cells. (B) Western blot analysis of α‐SMA levels in LX2 and LX2 cocultured with MKN‐45 and Hs746t cells for 48 h. (C) EdU assay. (D) Wound healing experiment. (E) Transwell assay. (F) Cellular immunofluorescence. (G) Western blot analysis of α‐SMA and fibroblast activation protein alpha (FAP) (markers of HSC activation) of control conditioned medium (CM), GC cells CM, and anoikis‐resistant GC (GCAR) cells CM cultivating LX2 cells, and LX2 cells in the presence of neutralizing Ab against PDGFB (PDGFB‐Ab) or neutralizing antibody against C‐X‐C motif chemokine ligand 11 (CXCL11‐Ab) for 48 h. (H) Western blot analysis of proteins in LX2 cells treated with CM obtained from GC cells in the presence or absence of recombinant PDGFB or PDGFRβ inhibitor (SU‐16f), GCAR cells in the presence or absence of PDGFB‐Ab or PDGFRβ inhibitor for 48 h. Results are shown as the mean ± SD of three independent experiments, each experiment was carried out in triplicate. *p < 0.05; **p < 0.01. ns, not significant.
FIGURE 4
FIGURE 4
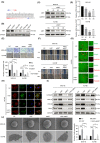
MET expression is increased in liver metastases of patients with gastric cancer with liver metastasis (GCLM) and is associated with poor prognosis. (A) Representative immunohistochemical (IHC) staining of MET in normal tissues, primary tumors, and liver metastases from patients with GCLM (magnification, ×100 and ×400). (B) Immunohistochemical score of MET in normal tissues, primary tumors, and liver metastases from patients with GCLM. (C) Western blot analysis of invadopodia‐associated protein levels in normal tissues (N), primary tumors (T), and corresponding liver metastases (M) of patients with GCLM. (D) Overall survival of 54 patients with GCLM with different MET expression levels. Results were shown as the mean ± SD of three independent experiments, each experiment was carried out in triplicate. **p < 0.01,***p < 0.001.
FIGURE 5
FIGURE 5
MET regulates the migration, invasion, and invadopodia formation of gastric cancer (GC) cells. (A) MET mRNA expression data of the GC cell line were downloaded from the Broad Institute Cancer Cell Line Encyclopedia and analyzed using Morpheus. (B) Western blot analysis of MET in six GC cell lines. (C) Western blot detection of the knockdown efficiency of siMET in GC cells at the protein level. (D) Quantitative RT‐PCR detection of the knockdown efficiency of siMET in GC cells at the mRNA level. (E) Transwell assay and (F) wound healing assay detection of GC cell migration. (G) Gelatin invasion assay to detect the invasion of Hs746t cells. (H) Colocalization of cortactin (green) and phalloidin (red) to observe the formation of invadopodia (white arrow) in Hs746t cells. Nuclei were stained with DAPI and observed under a confocal fluorescence microscope. (I) Western blot analysis of invadopodia‐associated protein expression in MKN‐45 and Hs746t cells with hepatocyte growth factor (HGF; 40 ng/mL) stimulation for 48 h or MET knockdown. (J) Observation of MKN‐45 and Hs746t cells with HGF stimulation or MET knockdown by scanning electron microscope. Results are shown as the mean ± SD of three independent experiments, each experiment was carried out in triplicate. *p < 0.05; **p < 0.01.***p < 0.001; ****p < 0.0001. NC, negative control.
FIGURE 6
FIGURE 6
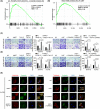
MET regulates invadopodia formation of gastric cancer (GC) cells through the PI3K/AKT pathway. (A, B) Gene Set Enrichment Analysis evaluating MET expression and the PI3K/AKT_SIGNALING pathway in GC. (C) Transwell migration assay detection of the migration of GC cells with MET knockdown or 740‐YP (20 μg/mL), hepatocyte growth factor (HGF; 40 ng/mL) or LY294002 (10 mmol/mL) treatment for 48 h. (D) Transwell invasion assay detection of the invasion of GC cells with MET knockdown or 740‐YP, HGF, or LY294002 treatment for 48 h. (E) Colocalization of cortactin (green) and phalloidin (red) to observe the formation of invadopodia in Hs746t cells with MET knockdown or 740‐YP, HGF, or LY294002 treatment for 48 h. Nuclei were stained with DAPI and observed under a confocal fluorescence microscope. Results are shown as the mean ± SD of three independent experiments, each experiment was carried out in triplicate. *p < 0.05; **p < 0.01.***p < 0.001; ****p < 0.0001. FDR, false discovery rate; NES, normalized enrichment score.
FIGURE 7
FIGURE 7
Knockdown of MET inhibits gastric cancer with liver metastasis (GCLM) in vivo. (A, B) Western blot analysis of phospho‐ (p)‐PI3K/PI3K, p‐AKT/AKT, p‐mTOR/mTOR, and invadopodia‐associated proteins in Hs746t and MKN‐45 cells with MET knockdown or 740‐YP (20 μg/mL), hepatocyte growth factor (HGF; 40 ng/mL), or LY294002 (10 mmol/mL) for 48 h. (C) Verification of the infection efficiency in MKN‐45 cells by fluorescence microscopy (magnification, ×200). (D) Western blotting was used to detect the infection efficiency of shMET in MKN‐45 cells. (E) Images of liver metastases in mice in the shMET and shNC (negative control) groups and the graph shows the percentage of liver metastases volume (liver metastases volume / liver volume). (F) H&E, MET, N‐WASP, MMP14, CDC42, and RAC1 staining in xenograft tissues of shNC and shMET groups (magnification, ×400). Results are shown as the mean ± SD of three independent experiments, each experiment was carried out in triplicate. **p < 0.01.
FIGURE 8
FIGURE 8
Schematic illustration of the potential mechanism of gastric cancer with liver metastasis (GCLM). First, metastatic gastric cancer (GC) cells activate hepatic stellate cells (HSCs) through the platelet‐derived growth factor subunit B (PDGFB)/ platelet‐derived growth factor receptor beta (PDGFRβ) pathway. Then, hepatocyte growth factor (HGF) secreted by activated HSCs acts on MET receptors of GC cells after metastasis. Finally, PI3K/AKT signaling induced by MET facilitates the invadopodia formation of GC cells, which is responsible for the development of GCLM.

References

    1. Sung H, Ferlay J, Siegel RL, et al. Global cancer statistics 2020: GLOBOCAN estimates of incidence and mortality worldwide for 36 cancers in 185 countries. CA Cancer J Clin. 2021;71(3):209‐249. - PubMed
    1. Polkowska‐Pruszynska B, Rawicz‐Pruszynski K, Cisel B, et al. Liver metastases from gastric carcinoma: a case report and review of the literature. Curr Probl Cancer. 2017;41(3):222‐230. - PubMed
    1. Zhang Y, Lin Y, Duan J, Xu K, Mao M, Wang X. A population‐based analysis of distant metastasis in stage IV gastric cancer. Med Sci Monit. 2020;26:e923867. - PMC - PubMed
    1. Granieri S, Altomare M, Bruno F, et al. Surgical treatment of gastric cancer liver metastases: systematic review and meta‐analysis of long‐term outcomes and prognostic factors. Crit Rev Oncol Hematol. 2021;163:103313. - PubMed
    1. Zhang H, Deng T, Liu R, et al. Exosome‐delivered EGFR regulates liver microenvironment to promote gastric cancer liver metastasis. Nat Commun. 2017;8:15016. - PMC - PubMed

MeSH terms

Substances