. 2024 May;20(5):1072-1097.
doi: 10.1080/15548627.2023.2286128. Epub 2023 Dec 5.

Circ-0000953 deficiency exacerbates podocyte injury and autophagy disorder by targeting Mir665-3p-Atg4b in diabetic nephropathy

Affiliations

Circ-0000953 deficiency exacerbates podocyte injury and autophagy disorder by targeting Mir665-3p-Atg4b in diabetic nephropathy

Xueqi Liu et al. Autophagy. 2024 May.

Abstract

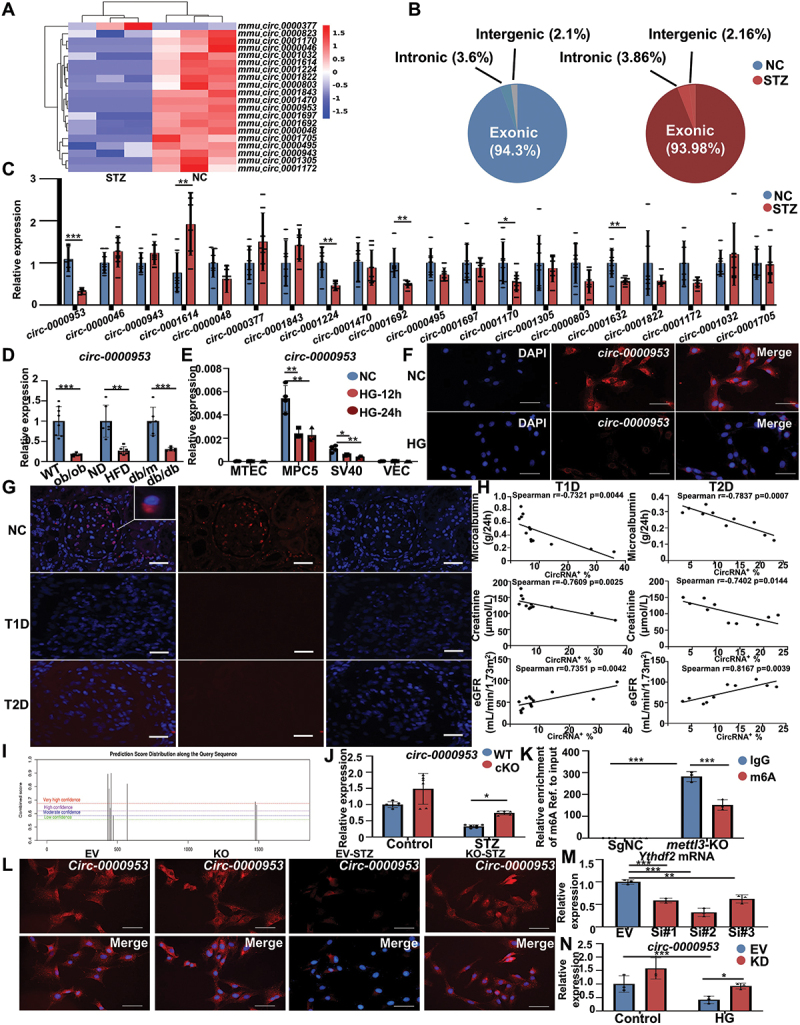
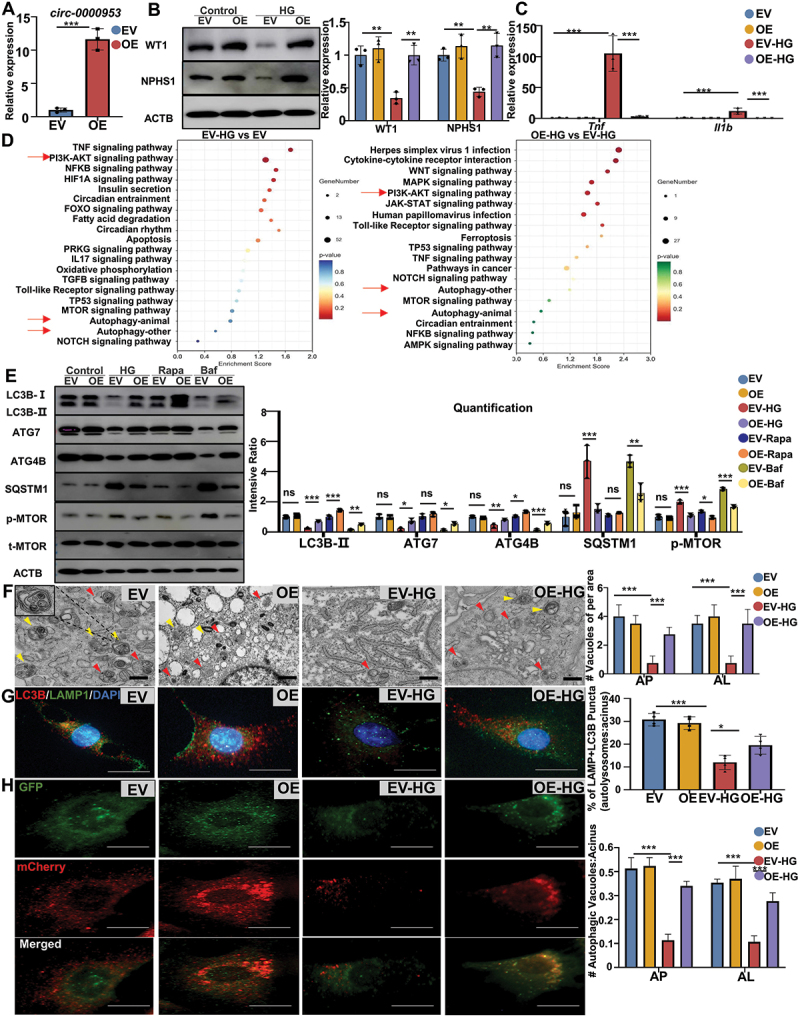
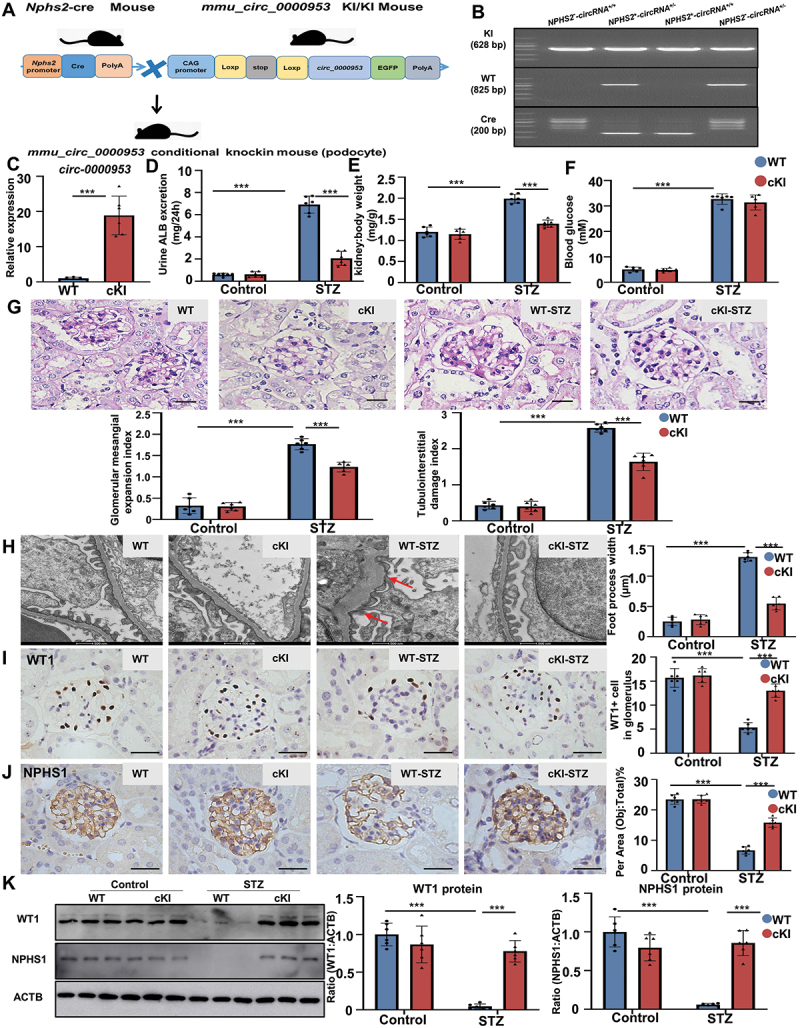
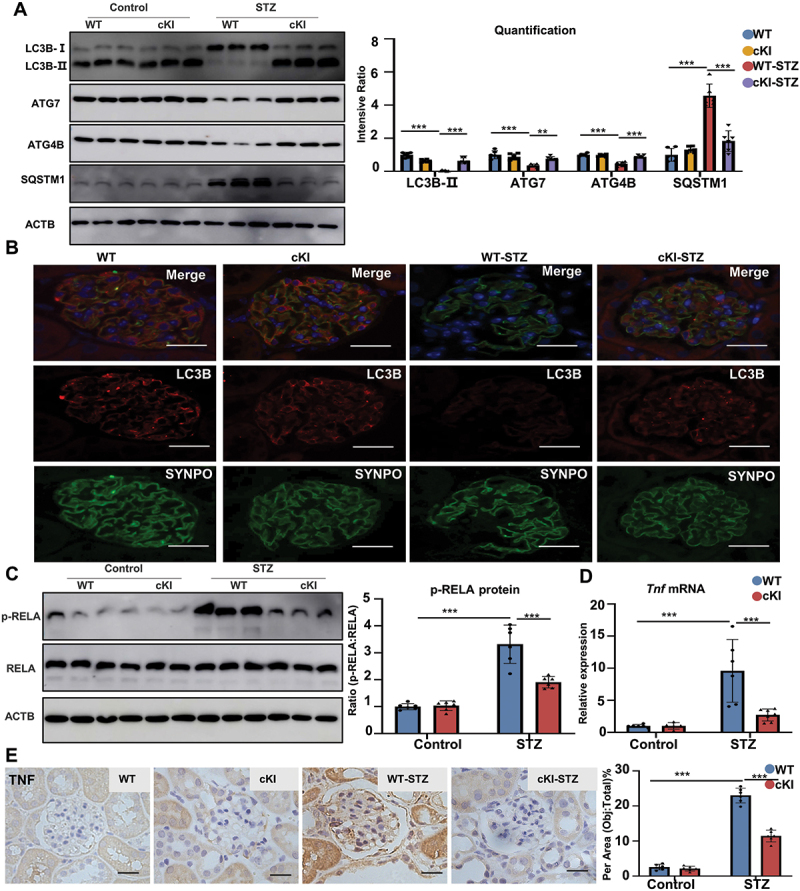
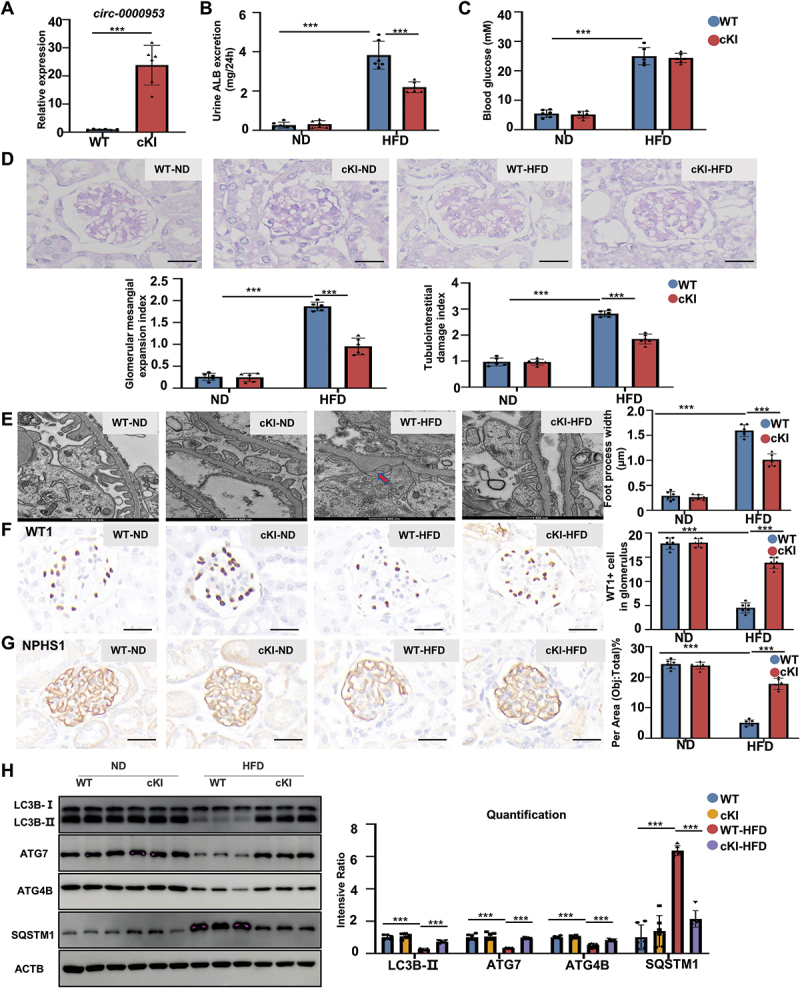
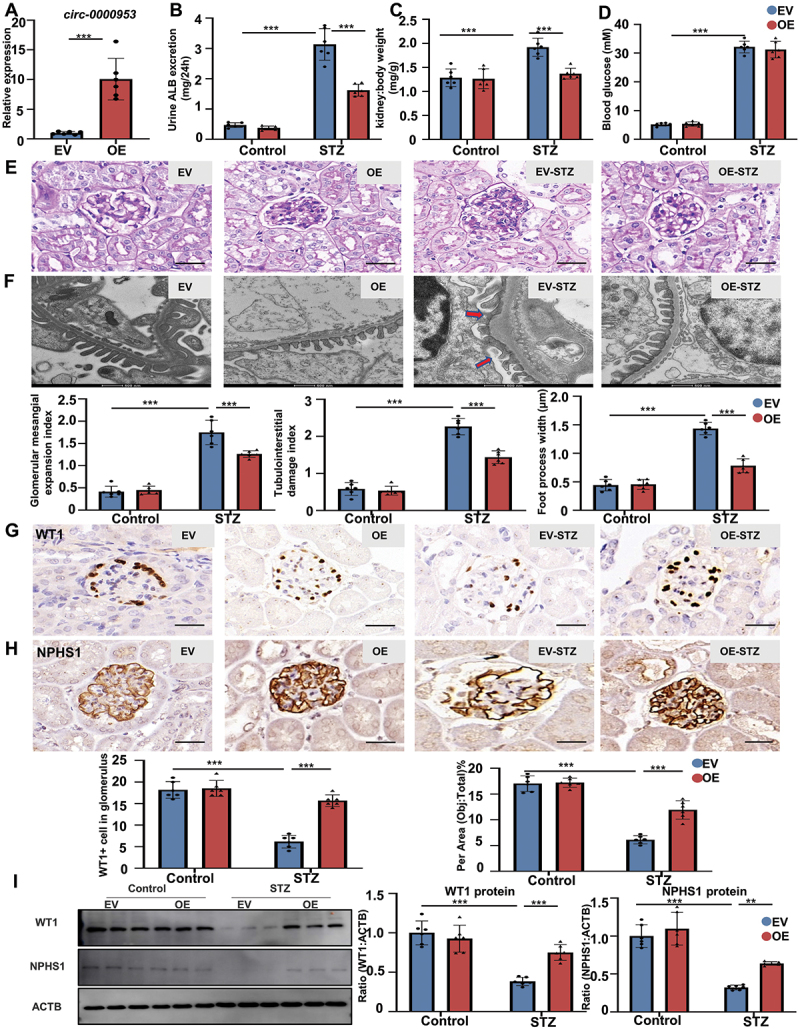
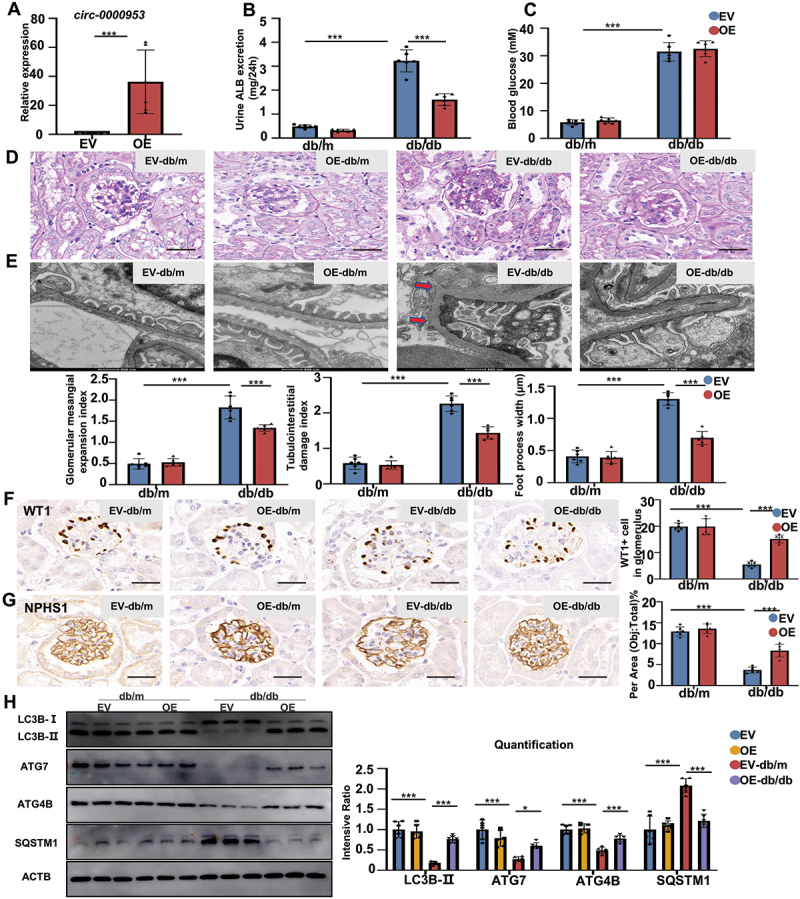
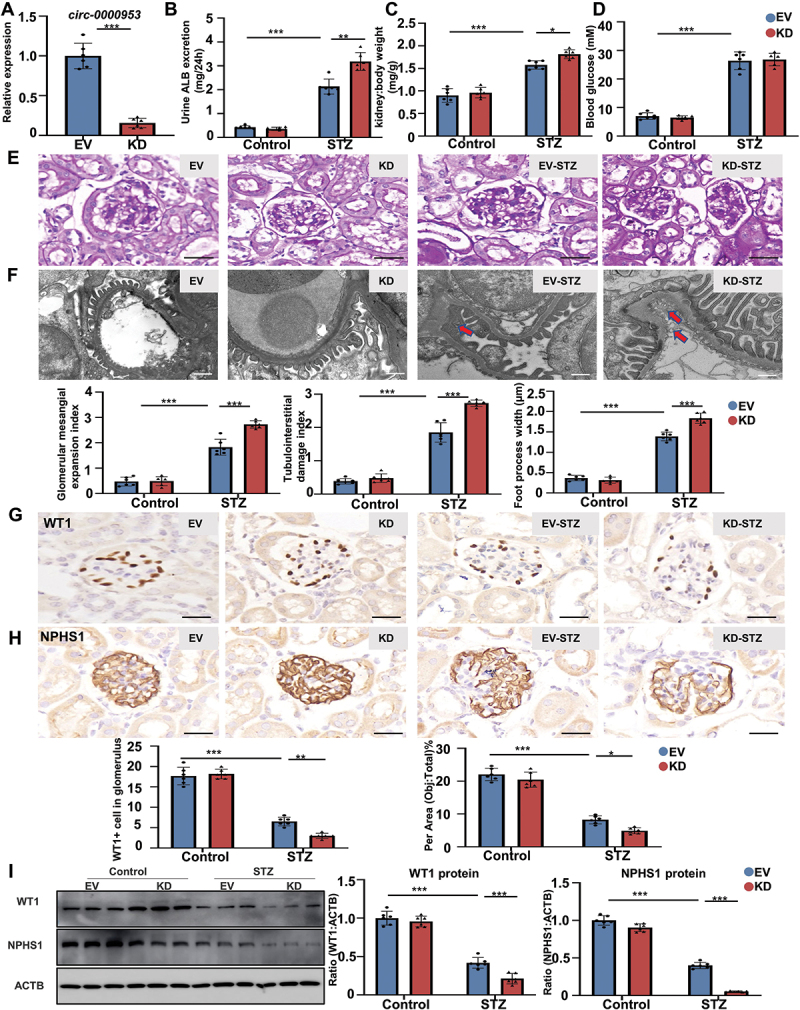
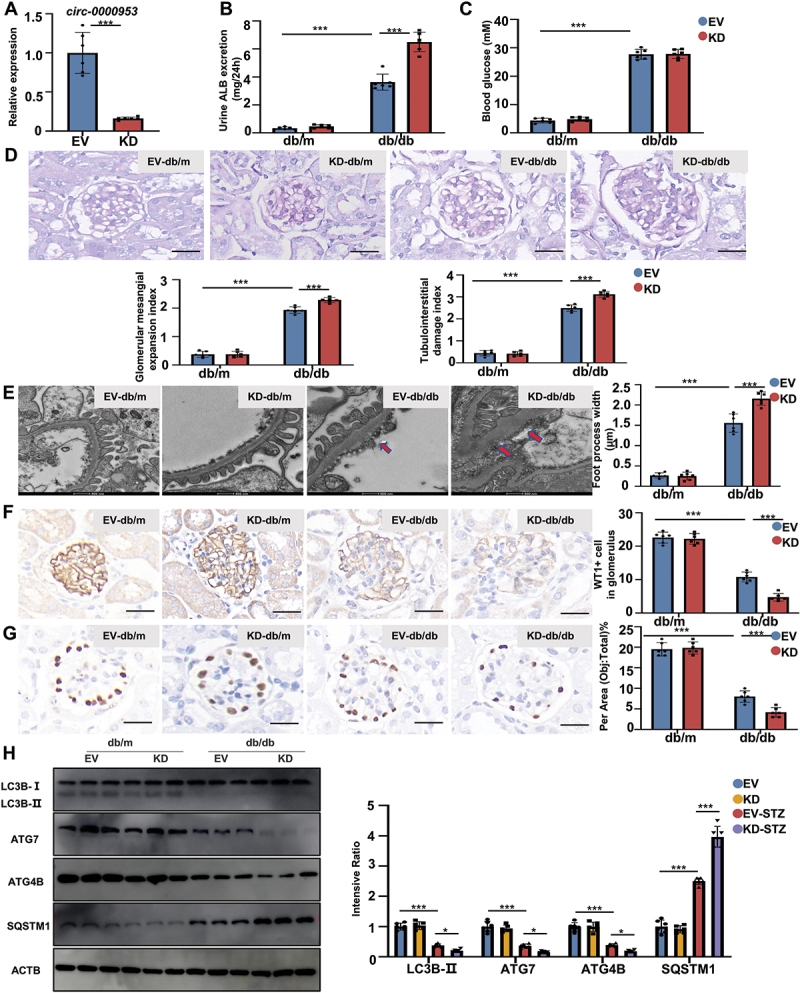
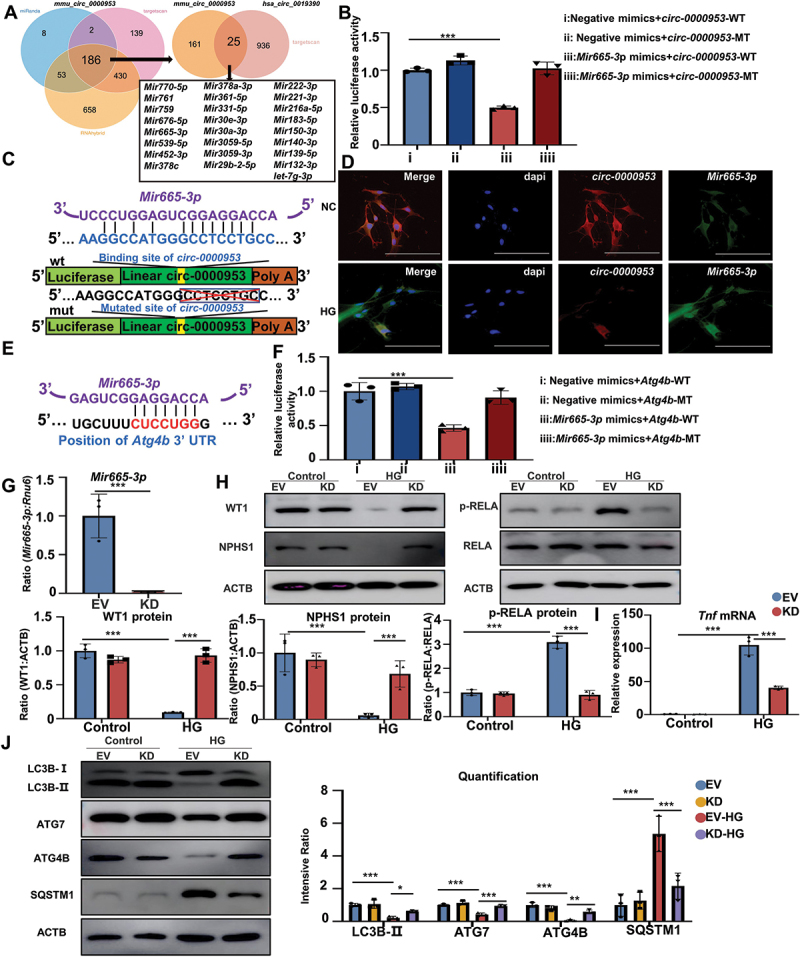
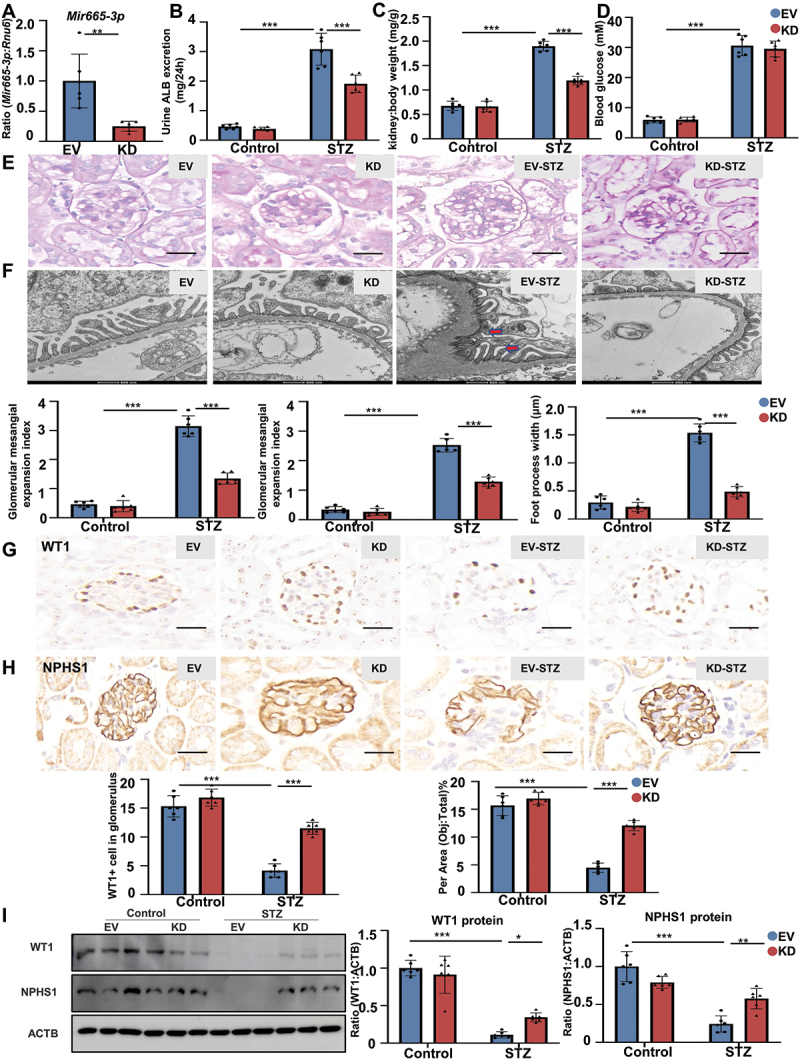
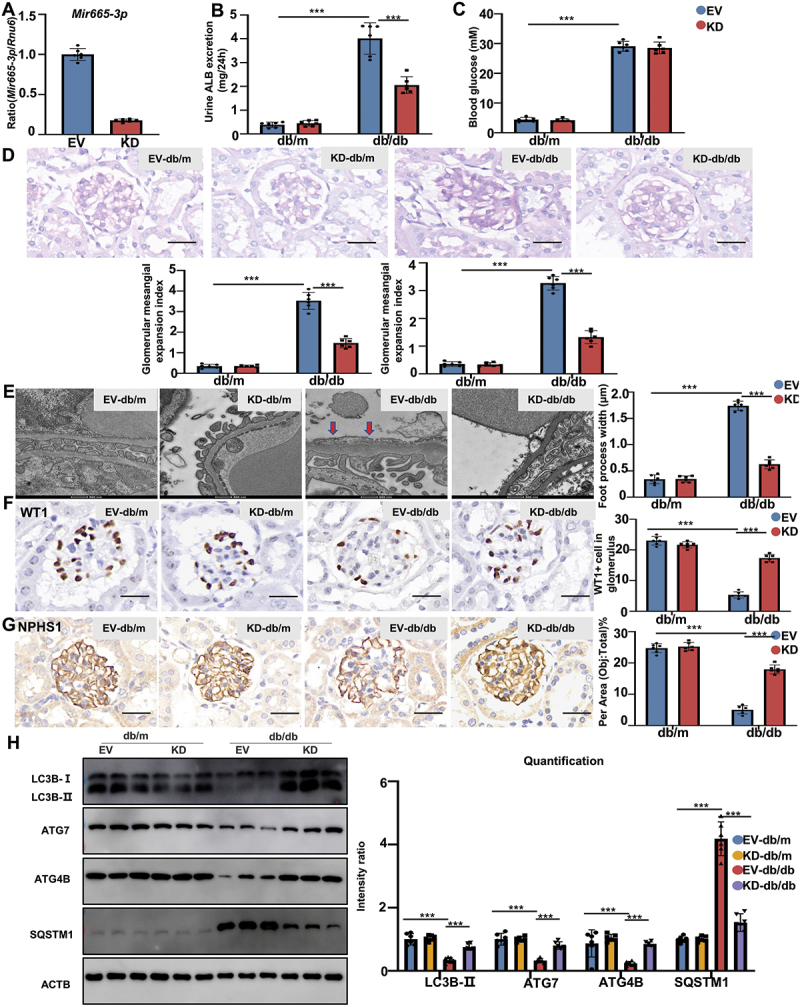
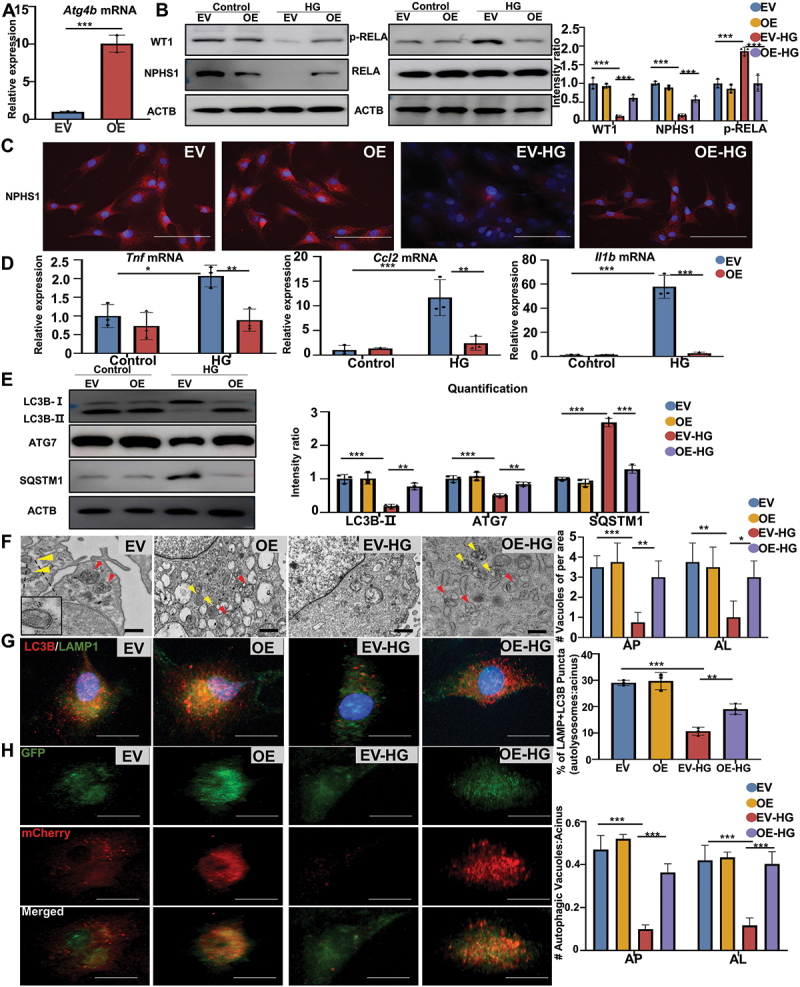
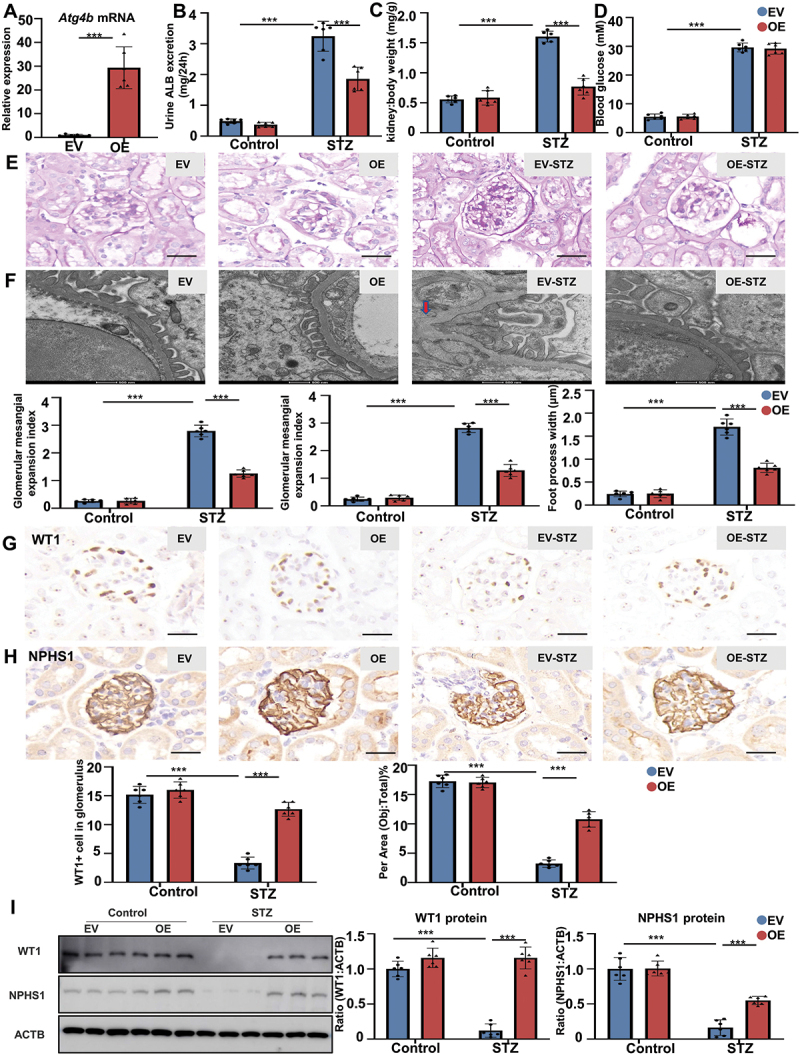
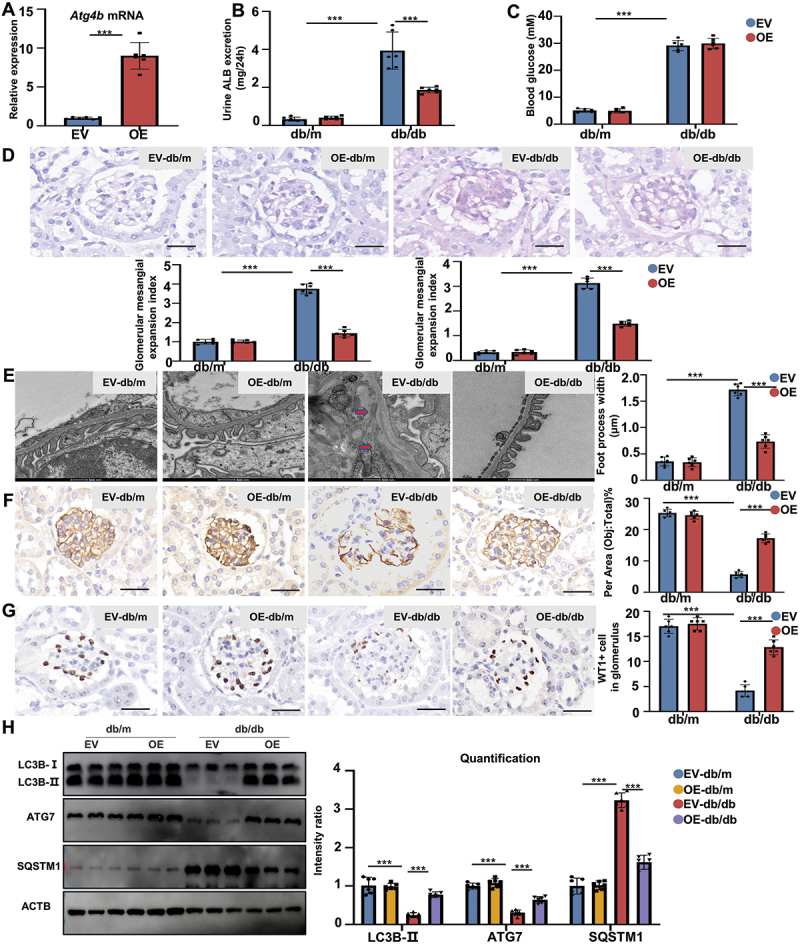
Circular RNAs (circRNAs) are special non-coding RNA (ncRNA) molecules that play a significant role in many diseases. However, the biogenesis and regulation of circRNAs in diabetic nephropathy (DN) are largely unknown. Here, we investigated the expression profile of circRNAs in kidney of DN mice through circular RNA sequencing (circRNA-seq). The renal biopsy samples of patients with DN had low circ -0,000,953 expression, which was significantly associated with renal function. Furthermore, loss-of-function and gain-of-function experiments were carried out to prove the role of circ -0,000,953 in DN. Podocyte conditional knockin (cKI) or systemic overexpression of circ -0,000,953 alleviated albuminuria and restored macroautophagy/autophagy in kidney of diabetic mice. However, circ -0,000,953 knockdown exacerbated albuminuria and podocyte injury. Mechanistically, we found circ -0,000,953 directly binds to Mir665-3p-Atg4b to perform its function. Silencing of Mir665-3p or overexpression of Atg4b recovered podocyte autophagy both in vitro and in vivo. To examine the cause of circ -0,000,953 downregulation in DN, bioinformatics prediction found that circ -0,000,953 sequence has a high possibility of containing an m6A methylation site. Additionally, METTL3 was proved to regulate the expression and methylation level of circ -0,000,953 through YTHDF2 (YTH N6-methyladenosine RNA binding protein 2). In conclusion, this study revealed that circ -0,000,953 regulates podocyte autophagy by targeting Mir665-3p-Atg4b in DN. Therefore, circ -0,000,953 is a potential biomarker for prevention and cure of DN.Abbreviation: CCL2/MCP-1: C-C motif chemokine ligand 2; ceRNA: competing endogenous RNA; circRNA: circular RNA; cKI: conditional knockin; cKO: conditional knockout; CRE: creatinine; DM: diabetes mellitus; DN: diabetic nephropathy; ESRD: end-stage renal disease; HG: high glucose; IF: immunofluorescence; MAP1LC3/LC3B: microtubule-associated protein 1 light chain 3 beta; MPC5: mouse podocyte clone 5; MTECs: mouse tubular epithelial cells; MTOR: mechanistic target of rapamycin kinase; NC: normal control; ncRNA: non-coding RNA; NPHS1: nephrosis 1, nephrin; NPHS2: nephrosis 2, podocin; PAS: periodic acid-Schiff; RELA/p65: v-rel reticuloendotheliosis viral oncogene homolog A (avian); SDs: slit diaphragm proteins; Seq: sequencing; STZ: streptozotocin; SV40: SV40-MES13-cells, mouse mesangial cell line; T1D: type 1 diabetes mellitus; T2D: type 2 diabetes mellitus; TEM: transmission electron microscopy; TNF/TNF-α: tumor necrosis factor; VECs: vascular endothelial cells; WT1: WT1 transcription factor; YTHDF2: YTH N6-methyladenosine RNA binding protein 2.

Keywords: Atg4b; autophagy; circRNA; diabetic nephropathy; m6A; podocytes.


Conflict of interest statement

No potential conflict of interest was reported by the authors.

Figures

Figure 1.
Figure 1.
Circ -0,000,953 was downregulated in DN mice and patients. (A) the heat map reflected the top 20 circRNAs with high homology and the most significant variation. (B) distribution composition of differentially changed circRNAs. (C) the expression level of circ -0,000,953 in the glomerulus of STZ-induced T1D mice was detected by real-time PCR. (D) circ -0,000,953 expression level in T2D mice glomerulus was detected by real-time PCR. (E) circ -0,000,953 expression levels in intrinsic renal cells were detected by real-time PCR. (F) validation of circRNA localization in podocytes by FISH experiments. Scale: 50 μm. (G) FISH experiments demonstrated the expression level of circ -0,000,953 in renal biopsy specimens and paracancer kidneys of patients with T1D and T2D. Scale: 20 μm. (H) correlation analysis between circ -0,000,953 and clinical indexes of diabetic patients. (I) bioinformatics prediction of circ -0,000,953 methylation modification sites. (J) the expression level of circ -0,000,953 was detected by real-time PCR. (K) the METTL3-mediated m6A modification of circ -0,000,953 was detected by MeRIP-qPCR. (L) the expression level of circ -0,000,953 was verified by FISH experiment. Scale: 50 μm. (M) the silencing efficiency of Ythdf2 was verified by real-time PCR. (N) the effect of Ythdf2 silencing on circ -000,953 expression was verified by real-time PCR. Abbreviations: MTEC: mouse renal tubular epithelial cells, MPC5: mouse podocyte cell line; SV40: SV40-MES13-cells, VEC: vascular endothelial cells, NC: normal control, HG: high glucose, EV: empty vector, KD: knockdown, cKO: conditional knockout, STZ: streptozotocin, T1D: type 1 diabetes mellitus, T2D: type 2 diabetes mellitus. *p < 0.05, **p < 0.01, ***p < 0.001.
Figure 2.
Figure 2.
Overexpression of circ -0,000,953 alleviated podocyte injury and promoted podocyte autophagy in vitro. (A) the overexpression effect of circ -0,000,953 was detected by real-time PCR. (B) Western blot showed that circ -0,000,953 reversed HG-induced podocyte marker proteins. (C) overexpression of circ -0,000,953 reduced the expression of inflammatory cytokine Tnf and Il1b by real-time PCR. (D) KEGG showed that circ -0,000,953 overexpression regulated signal pathway. (E) Western blot showed that circ -0,000,953 overexpression regulated key proteins in autophagy. (F) transmission electron microscope (TEM) showed the effect of circ -0,000,953 overexpression on autophagosome (yellow triangles) and autolysosome (red triangles) in podocytes. Scale: 500 nm. (G) immunofluorescence showed the effect of circ -0,000,953 overexpression on LC3B with LAMP1 in HG-induced podocytes. Scale: 10 μm. (H) Representative images of MPC5 transfected ad-mCherry-GFP-LC3B adenovirus. Yellow puncta indicated autophagosomes, red puncta indicated autolysosomes. The number of red and yellow LC3 dots per cell were counted. Scale: 10 μm. Abbreviations: EV: empty vector, OE: overexpression, HG: high glucose, Rapa: rapamycin, Baf: bafilomycin A1, AP: autophagosome, AL: autolysosome, ns: no significance. *p < 0.05, **p < 0.01, ***p < 0.001.
Figure 3.
Figure 3.
Conditional knockin circ -0,000,953 significantly alleviated kidney injury and podocyte injury in STZ-induced diabetic mice. (A) schematic illustrating the genetic approach used to generate circ -0,000,953 cKI mice. (B) circ -0,000,953 cKI was confirmed by assessing genomic DNA. (C) real-time PCR showed the effect of conditional knockin circ -0,000,953 in glomerulus. (D) mouse urinary ALB ELISA showed that circ -0,000,953 cKI reduced 24 h urinary ALB excretion rate in STZ-induced diabetic mice. (E) podocytes conditional knockin circ -0,000,953 reduced kidney weight:body weight of mice. (F) circ -0,000,953 cKI had no significant effect on blood glucose level. (G) PAS staining showed typical glomerular structural changes in different groups of mice. Scale: 25 μm. (H) the mean thickness of glomerular basement membrane (GBM) and the mean width of foot process of mice were detected by TEM. Scale: 500 nm. (I and J) immunohistochemistry showed that circ -0,000,953 cKI reversed the content of podocyte makers. Scale: 25 μm. (K) Western blot detected the expression of podocyte marker protein in glomerulus. Abbreviations: WT: wild type, cKI: conditional knockin. ***p < 0.001.
Figure 4.
Figure 4.
Conditional knockin circ -0,000,953 of podocyte significantly reduced the autophagy and inflammatory level disorders in STZ-induced type 1 diabetes mice. (A) Western blot showed the expression levels of autophagy related proteins in glomerulus. (B) immunofluorescence showed the expression of autophagy key protein LC3B. Scale: 25 μm. (C) Western blot of RELA/p65 phosphorylation in NFKB pathway. (D) the expression levels of inflammatory factors were detected by real-time PCR. (E) the expression level of inflammatory cytokine TNF was determined by immunohistochemistry. Scale: 25 μm. Abbreviations: WT: wild type, cKI: conditional knockin. **p < 0.01, ***p < 0.001.
Figure 5.
Figure 5.
Podocyte conditional knockin circ -0,000,953 ameliorated renal injury in HFD-induced type 2 diabetic mice. (A) real-time PCR was performed to validate the expression of circ -0,000,953 in the glomerulus. (B) the 24 h urinary ALB excretion rate was markedly decreased in cKI mice. (C) circ -0,000,953 cKI did not reduce blood glucose levels in the type 2 DM model. (D) PAS staining showed typical glomerular structural changes in different groups of mice. Scale: 25 μm. (E) the mean thickness of GBM and the mean width of foot process of mice were analyzed by TEM. Scale bar: 500 nm. (F and G) immunohistochemistry showed the expression of WT1 and NPHS1. Scale: 25 μm. (H) Western blot detected the expressions of ATG7, ATG4B, SQSTM1/p62 and LC3B-II in the kidney tissues. Abbreviations: WT: wild type, cKI: conditional knockin, HFD: high-fat diet. **p < 0.01, ***p < 0.001.
Figure 6.
Figure 6.
Systemic overexpression of circ -0,000,953 ameliorated renal injury in STZ-induced type 1 diabetic mice. (A) real-time PCR showed the efficiency of overexpression circ -0,000,953 in the kidney. (B) circ -0,000,953 overexpression reduced the 24 h urinary ALB excretion rate of STZ-induced diabetic mice. (C) overexpression of circ -0,000,953 reduced kidney weight:body weight of mice. (D) overexpression of circ -0,000,953 had no significant effect on blood glucose. (E) PAS staining showed typical glomerular structural changes in different groups of mice. Scale: 25 μm. (F) the mean thickness of GBM and the mean width of foot process of mice were analyzed by TEM. Scale: 500 nm. (G and H) immunohistochemistry showed that circ -0,000,953 reversed the expression of WT1 and NPHS1. Scale: 25 μm. (I) Western blot of glomerulus showed the expression level of podocyte marker. Abbreviations: EV: empty vector, OE: overexpression. **p < 0.01, ***p < 0.001.
Figure 7.
Figure 7.
Systemic overexpression of circ -0,000,953 significantly ameliorated renal injury in db/db type 2 diabetic mice. (A) real-time PCR showed the efficiency of circ -0,000,953 overexpression in kidney. (B) circ -0,000,953 overexpression could significantly reduce the 24 h urinary ALB excretion rate of db/db type 2 diabetic mice. (C) overexpression of circ -0,000,953 had no significant effect on blood glucose. (D) PAS staining showed typical glomerular structural changes in different groups of mice. Scale: 25 μm. (E) the mean thickness of GBM and the mean width of foot process of mice were measured by TEM. Scale: 500 nm. (F and G) immunohistochemistry showed that circ -0,000,953 reversed the expression of WT1 and NPHS1. Scale: 25 μm. (H) Western blot showed the expression of autophagy related proteins in glomerulus. Abbreviations: EV: empty vector, OE: overexpression. *p < 0.05, ***p < 0.001.
Figure 8.
Figure 8.
Silencing circ -0,000,953 aggravated kidney injury and podocyte injury in STZ-induced type 1 diabetes mice. (A) real-time PCR validated the silencing efficiency of circ -0,000,953. (B) silencing circ -0,000,953 could decrease the 24 h urinary ALB excretion rate of STZ-induced diabetic mice. (C) silencing circ -0,000,953 increased the kidney weight:body weight of mice. (D) silencing circ -0,000,953 had no significant effect on blood glucose. (E) PAS staining showed typical glomerular structural changes in different groups of mice. Scale: 25 μm. (F) the mean thickness of GBM and the mean width of foot process of mice were detected by TEM. Scale: 500 nm. (G and H) immunohistochemistry showed that silencing circ -0,000,953 deteriorated the loss of WT1 and NPHS1. Scale: 25 μm. (I) Western blot detected the expression of podocyte marker. Abbreviation: EV: empty vector, KD: knockdown. *p < 0.05, **p < 0.01, ***p < 0.001.
Figure 9.
Figure 9.
Silencing circ -0,000,953 significantly aggravated renal injury in db/db mice. (A) real-time PCR validated the silencing efficiency of circ -0,000,953. (B) silencing circ -0,000,953 decreased the 24 h urinary ALB excretion rate of db/db mice. (C) knockdown of circ -0,000,953 had no significant effect on blood glucose level. (D) PAS staining showed typical glomerular structural changes in different groups of mice. Scale: 25 μm. (E) the mean thickness of GBM and the mean width of foot process of mice were measured by TEM. Scale: 500 nm. (F and G) immunohistochemistry showed the expression of WT1 and NPHS1. Scale: 25 μm. (H) Western blot showed the expression levels of autophagy related proteins in the kidney. Abbreviation: EV: empty vector, KD: knockdown. *p < 0.05, ***p < 0.001.
Figure 10.
Figure 10.
Identification of the interaction between circ -0,000,953-Mir665-3p-Atg4b. (A) venn diagram showing the intersection analysis of public prediction sites for circ -0,000,953 targeted miRNAs. (B) dual luciferase assay demonstrated the interaction of circ -0,000,953 with Mir665-3p. (C) circ -0,000,953 sequence binding site of Mir665-3p. (D) FISH experiments demonstrated that circ -0,000,953 co-localized with Mir665-3p in the cytoplasm of podocytes. Scale: 100 μm. (E) binding site of Mir665-3p to Atg4b. (F) luciferase reports demonstrate that Mir665-3p interacts with Atg4b. (G) real-time PCR detected the effect of silencing Mir665-3p. (H) Western blot showed that silencing Mir665-3p reversed the loss of WT1 and NPHS1, and reduced the phosphorylation of RELA/p65. (I) the effect of silencing Mir665-3p on inflammatory factors were detected by real-time PCR. (J) Western blot showed the regulation of silenced Mir665-3p on key proteins of autophagy. Abbreviation: EV: empty vector, KD: knockdown, HG: high glucose. *p < 0.05, **p < 0.01, ***p < 0.001.
Figure 11.
Figure 11.
Silencing Mir665-3p mitigated kidney damage in STZ-induced diabetic mice. (A) real-time PCR showed the effect of Mir665-3p silencing in the kidney. (B) silencing Mir665-3p reduced the 24 h urinary ALB excretion rate of STZ-induced diabetic mice. (C) Mir665-3p silencing reduced kidney weight:body weight of mice. (D) Mir665-3p silencing had no significant effect on blood glucose level. (E) PAS staining showed typical glomerular structural changes in different groups of mice. Scale: 25 μm. (F) the mean thickness of GBM and the mean width of foot process of mice were detected by TEM. Scale: 500 nm. (G and H) immunohistochemistry showed that Mir665-3p silencing reversed the expression of WT1 and NPHS1. Scale: 25 μm. (I) Western blot detected the expression of podocyte marker protein in glomerulus. Abbreviation: EV: empty vector, KD: knockdown. *p < 0.05, **p < 0.01, ***p < 0.001.
Figure 12.
Figure 12.
Silencing Mir665-3p mitigated kidney damage in db/db type 2 diabetic mice. (A) real-time PCR validated the silencing efficiency of Mir665-3p. (B) silencing Mir665-3p could reverse the 24 h urinary ALB excretion rate of db/db mice. (C) knockdown of Mir665-3p had no significant effect on blood glucose level. (D) PAS staining showed typical glomerular structural changes in different groups of mice. Scale: 25 μm. (E) the mean thickness of GBM and the mean width of foot process of mice were measured by TEM. Scale: 500 nm. (F and G) immunohistochemistry showed the expression of WT1 and NPHS1. Scale: 25 μm. (H) Western blot showed the expression of autophagy related proteins in the kidney. Abbreviation: EV: empty vector, KD: knockdown. *p < 0.05, **p < 0.01, ***p < 0.001.
Figure 13.
Figure 13.
Overexpression of Atg4b significantly reduced HG-induced podocytes injury. (A) the efficiency of Atg4b overexpression was detected by real-time PCR. (B) Western blot showed that overexpression of Atg4b reversed the loss of WT1 and NPHS1, and reduced the phosphorylation of RELA/p65. (C) overexpression of Atg4b reversed the loss of HG-induced podocyte marker by immunofluorescence. Scale: 100 μm. (D) real-time PCR confirmed that overexpression of Atg4b reduced the expression of inflammatory cytokines. (E) Western blot showed the regulation of key autophagy proteins by overexpression of Atg4b. (F) TEM showed the effect of Atg4b overexpression on autophagosome and autolysosome in podocytes. Scale: 500 nm. (G) immunofluorescence showed the effect of Atg4b overexpression on LC3B with LAMP1 in HG-induced podocytes. Scale: 10 μm. (H) Representative images of MPC5 transfected ad-mCherry-GFP-LC3B adenovirus. Yellow puncta indicated autophagosomes, red puncta indicated autolysosomes. Scale: 10 μm. Abbreviation: EV: empty vector, OE: overexpression, HG: high glucose. *p < 0.05, **p < 0.01, ***p < 0.001.
Figure 14.
Figure 14.
Overexpression of Atg4b mitigated kidney damage in STZ-induced diabetic mice. (A) real-time PCR showed the efficiency of overexpression Atg4b in the kidney. (B) overexpression of Atg4b reduced the 24 h urinary ALB excretion rate of STZ-induced diabetic mice. (C) overexpression of Atg4b reduced kidney weight:body weight of mice. (D) Atg4b overexpression had no significant effect on blood glucose. (E) PAS staining showed typical glomerular structural changes in different groups of mice. Scale: 25 μm. (F) the mean thickness of GBM and the mean width of foot process were analyzed by TEM. Scale: 500 nm. (G and H) immunohistochemistry showed that overexpression of Atg4b reversed the expression of podocyte markers. Scale: 25 μm. (I) Western blot detected the expression of podocyte marker protein in glomerulus. Abbreviation: EV: empty vector, OE: overexpression. ***p < 0.001.
Figure 15.
Figure 15.
Overexpression of Atg4b mitigated kidney damage in db/db type 2 diabetic mice. (A) real-time PCR validated the overexpression efficiency of Atg4b. (B) overexpression Atg4b could reverse the 24 h urinary ALB excretion rate of db/db mice. (C) overexpression of Atg4b had no significant effect on blood glucose. (D) PAS staining showed typical glomerular structural changes in different groups of mice. Scale: 25 μm. (E) the mean thickness of GBM and the mean width of foot process of mice were measured by TEM. Scale: 500 nm. (F and G) immunohistochemistry showed the expression of WT1 and NPHS1. Scale: 25 μm. (H) Western blot showed the expression of autophagy related proteins in the kidney. Abbreviation: EV: empty vector, OE: overexpression. **p < 0.01, ***p < 0.001.

Similar articles

Cited by

References

    1. Azushima K, Gurley SB, Coffman TM.. Modelling diabetic nephropathy in mice. Nat Rev Nephrol. 2018. Jan;14(1):48–56. doi: 10.1038/nrneph.2017.142 - DOI - PubMed
    1. Jiang L, Liu X, Hu X, et al. METTL3-mediated m(6)A modification of TIMP2 mRNA promotes podocyte injury in diabetic nephropathy. Mol Ther. 2022. Apr 6;30(4):1721–1740. doi: 10.1016/j.ymthe.2022.01.002 - DOI - PMC - PubMed
    1. Liu M, Liang K, Zhen J, et al. Sirt6 deficiency exacerbates podocyte injury and proteinuria through targeting notch signaling. Nat Commun. 2017. Sep 4;8(1):413. doi: 10.1038/s41467-017-00498-4 - DOI - PMC - PubMed
    1. Yasuda-Yamahara M, Kume S, Tagawa A, et al. Emerging role of podocyte autophagy in the progression of diabetic nephropathy. Autophagy. 2016;11(12):2385–2386. doi: 10.1080/15548627.2015.1115173 - DOI - PMC - PubMed
    1. Lenoir O, Jasiek M, Henique C, et al. Endothelial cell and podocyte autophagy synergistically protect from diabetes-induced glomerulosclerosis. Autophagy. 2015;11(7):1130–1145. doi: 10.1080/15548627.2015.1049799 - DOI - PMC - PubMed

Publication types

MeSH terms