. 2024 Jan 25;52(2):724-737.
doi: 10.1093/nar/gkad1139.

Differential roles of positive and negative supercoiling in organizing the E. coli genome

Affiliations

Differential roles of positive and negative supercoiling in organizing the E. coli genome

Ziqi Fu et al. Nucleic Acids Res. .

Abstract

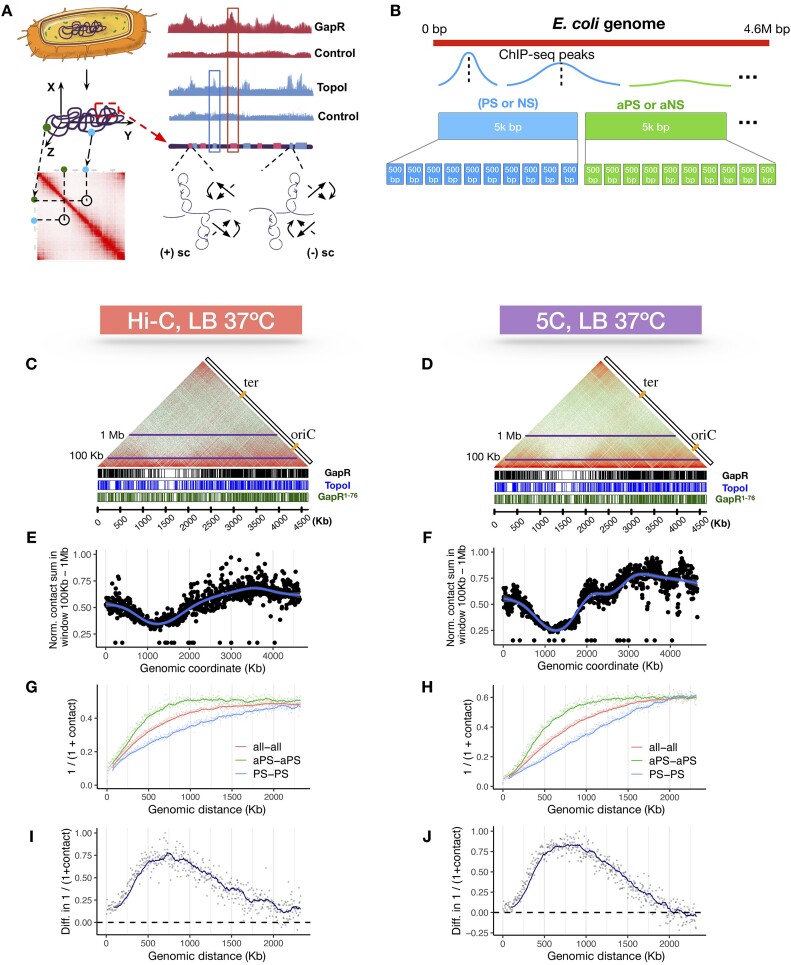
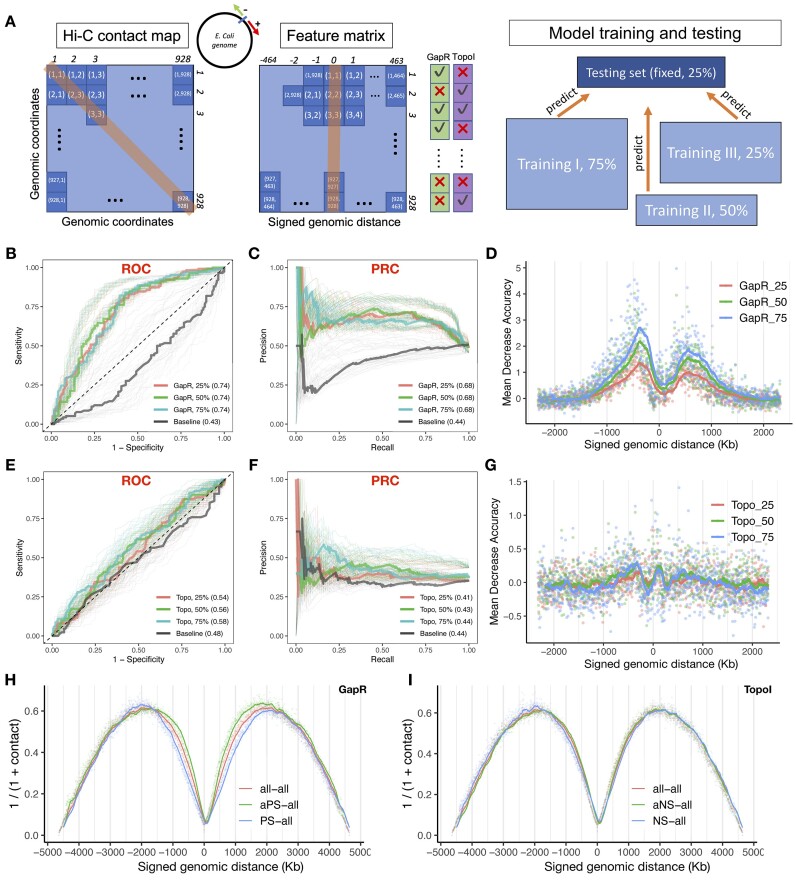
This study aims to explore whether and how positive and negative supercoiling contribute to the three-dimensional (3D) organization of the bacterial genome. We used recently published Escherichia coli GapR ChIP-seq and TopoI ChIP-seq (also called EcTopoI-seq) data, which marks positive and negative supercoiling sites, respectively, to study how supercoiling correlates with the spatial contact maps obtained from chromosome conformation capture sequencing (Hi-C and 5C). We find that supercoiled chromosomal loci have overall higher Hi-C contact frequencies than sites that are not supercoiled. Surprisingly, positive supercoiling corresponds to higher spatial contact than negative supercoiling. Additionally, positive, but not negative, supercoiling could be identified from Hi-C data with high accuracy. We further find that the majority of positive and negative supercoils coincide with highly active transcription units, with a minor group likely associated with replication and other genomic processes. Our results show that both positive and negative supercoiling enhance spatial contact, with positive supercoiling playing a larger role in bringing genomic loci closer in space. Based on our results, we propose new physical models of how the E. coli chromosome is organized by positive and negative supercoils.


Figures

Graphical Abstract
Graphical Abstract
Figure 1.
Figure 1.
E. coli chromosomal loci containing positive supercoiling sites exhibit higher-than-average spatial contacts in Hi-C maps. (A) A cartoon illustration of the study design. We correlate the spatial contact frequency of any two E. coli chromosomal loci (green and cyan dots on the wiggle lines) as depicted in the Hi-C map (red square, bottom) with the supercoiling states of the two loci as identified by GapR (indicating positively supercoiled DNA) or TopoI (indicating negatively supercoiled DNA) chromatin-immunoprecipitation sequencing data (ChIP-seq, right). (B) A cartoon illustration of GapR/TopoI ChIP-seq data bin assignment. The 4.6 Mb E. coli genome is divided into 5 or 0.5 kb bins, with each bin assigned as PS (positive supercoiling site marked by GapR-peak), aPS (absent of a positive supercoiling site, no GapR peak), NS (negative supercoiling site marked by TopoI-peak), or aNS (absent of a negative supercoiling site, no TopoI peak), based on GapR-Seq and TopoI-seq data. A bin can contain either one, both, or none. (C, D) Comparison of genomic locations of GapR and TopoI peaks with respect to their spatial contacts with other genomic locations in the Hi-C contact heatmaps of E. coli MG 1655. Normalized (log2) contact map is plotted as symmetric halves from the Hi-C data set (LB, 37°C, 5 kb resolution) generated in this study (C) and the 5C data set (LB, 37 °C, 5 kb resolution) generated by Lioy et al. (D), with a 45% counterclockwise rotation. Vertical bars at the bottom of the contact maps mark the ChIP-seq peaks for GapR (black), GapR1–76 (green) and TopoI (blue). The two horizontal lines in purple (10 kb, 1 Mb) represent the window used to compute the contact sum (in E, F) at each genomic locus in the contact map (5 Kb bin). The two reference rules provide the E. coli genomic coordinates (bottom, increment = 500 Kb) and locations of OriC and terC. (E, F) Normalized (log2) sum of the total contact counts in the 100 kb and 1 Mb window of the contact map (C or D) at each locus (black dots) is plotted along the E. coli genomic coordinates. Blue curve shows the moving average (window size = 15) of the normalized contact sum and peaks near ∼3–4 Mb where OriC resides. (GH) Inversed average contact frequencies of two genomic loci (y-axis) at each linear genomic separation distance (x-axis) with simple moving averages (colored curves, window size = 15) for loci pairs both containing positive supercoiling sites (PS–PS, blue), not containing positive supercoiling sites (aPS–aPS, green), and all loci pairs (all–all, red) show that PS–PS loci pairs have on average lowest inversed average contact frequencies (highest spatial contact) at all linear genomic distances than aPS–aPS or all-all loci pairs. (IJ) Numeric difference in the inversed average contact frequencies (y-axis) between PS–PS loci and aPS–aPS loci at each genomic separation distance (x-axis) reaches maximum in the range of 500– 1000 kb.
Figure 2.
Figure 2.
E. coli chromosomal loci containing negative supercoiling sites exhibit higher-than-average but lower spatial contacts in Hi-C maps than loci containing positive supercoiling. (AB) Inversed average contact frequencies of two genomic loci (y-axis) at each linear genomic separation distance (x-axis) with simple moving averages (colored curves, window size = 15) for loci pairs both containing negative supercoiling sites (NS–NS, blue), not containing positive supercoiling sites (aNS–aNS, green), and all loci pairs (all-all, red) show that NS–NS loci pairs have on average lowest inversed average contact frequencies (highest spatial contact) at all linear genomic distances than aNS–aNS or all-all loci pairs. (C, D) Numeric difference in the inversed average contact frequencies (y-axis) between NS–NS loci and aNS–aNS loci at each genomic separation distance (x-axis) reaches maximum in the range of 500–1000 kb. (E, F) Inversed average contact frequencies of two genomic loci (y-axis) at each linear genomic separation distance (x-axis) with simple moving averages (colored curves, window size = 15) for loci pairs containing positive supercoiling site only (PS only–PS only, blue), negative supercoiling site only (NS only–NS only, green), and none (aa–aa, red) show that PS only–PS only loci pairs have on average lowest inversed average contact frequencies (G, H) Numeric difference in the inversed average contact frequencies (y-axis) between PS only–PS only loci and aa-aa loci at each genomic separation distance (x-axis) reaches maximum in the range of 500–1000 kb.
Figure 3.
Figure 3.
Machine learning models can predicate positive but not negative supercoiling sites accurately from Hi-C contact map. (A) A cartoon illustration of the machine learning model design. The input matrix is a rearrangement of the conventional contact matrix7 (left), in which each input feature (row) is the contact frequency of a genomic locus (one 5 kb bin, brown) with flanking chromosome on both sides (–464 to +463 bins, blue). The responses, or whether this 5 kb bin contains any Gap (green) or TopoI (purple) peaks, are indicated by the check and error marks (middle). A set of randomly chosen loci (25% out of 928 bins) is preserved as a fixed testing set for all random forests models (right). (B, C) ROC and PR curves of 10 independent experiments (light-shaded curves) with 25% (red), 50% (green), and 75% (blue) training data predicted positive supercoiling (marked by GapR peaks) locations robustly with similar AUROC (0.74) and AUPRC (0.68) values, while the baseline models (black), trained with randomized peak labels, are at ∼0.43 and 0.44 respectively. (D) Average feature importance (over 10 independent experiments) measured in mean decrease accuracy (colored dots, with simple moving averages of window size = 15 as solid curves) from experiments with 25% (red), 50% (green) and 75% (blue) training data peaked at ∼500 kb genomic separation distance, indicating that these features contribute the most to the effective classification of GapR peak-containing bins. (E, F) ROC and PR curves of 10 independent experiments (light-shaded curves) with 25% (red), 50% (green) and 75% (blue) training data did not predicate negative supercoiling (marked by TopoI peaks) locations robustly. The AUROC (0.54–0.58) and AUPRC (0.41–0.44) values are not significantly different from those of the baseline models (black curves), indicating that the models cannot effectively recover negative supercoiling spatial patterns from Hi-C contact maps. (G) Average feature importance (over 10 independent experiments) measured in mean decrease accuracy (colored dots, with simple moving averages of window size = 15 as solid curves) from experiments with 25% (red), 50% (green) and 75% (blue) training data showed uniform patterns across different genomic separation distances (H) The average contact frequencies (y-axis, inversed contact counts representing the apparent spatial separation between two loci) at each signed genomic separation distance (x-axis) are plotted (colored dots) with simple moving averages (colored curves, window size = 15). Different colors indicate the interaction between loci pairs with at least one containing positive supercoiling site (PS-all, blue) and that with at least one containing no positive supercoiling site (aPS-all, green). The average contact frequencies at each genomic separation are plotted in red as a reference. (H) The inverse average contact frequencies among PS-all (blue), aPS-all (green), and all-all (red) loci pairs in the range of ±500–1000 kb are significantly different from each other, explaining the effective prediction of positive supercoiling sites on E. coli genome using Hi-C contacts as the input. (I) The inverse average contact frequencies among NS-all (blue), aNS-all (green), and all-all (red) loci pairs in all ranges are not significantly different from each other, explaining the ineffective prediction of negative supercooling sites on E. coli genome using Hi-C contacts as the input.
Figure 4.
Figure 4.
Transcription is a strong driving force for supercoiling generation. (A) 2D-histrogram showing the distribution of supercoiling sites (hexagon bins colored by density) with respect to the distance (bp, y-axis) to their nearest upstream transcription end site (TES) and the normalized (log2) transcription activity (x-axis, RPK) of that transcription unit (TU). Orange vertical line indicates the 75th percentile of all TU activities (x-intercept = 29.34). Orange horizontal line indicates 1 kb away from the nearest TES (y-intercept = 1000 bp). Positive supercoiling sites located in the purple block are 1 kb away from the nearest TES and the associated TUs have transcription activities below the 75th percentile, suggesting that those sites are not associated with transcription. (B) The negative supercoiling counterpart of (A). (C, D) Control experiments repeating the analysis in (A and B) by randomly generating a set of genomic locations matching the number of PS and NS sites. More randomized sites reside within the purple blocks (>1 kb away from TUs of low transcription activities) than those in (A, B). (E) PS sites (colored dots) greater than 1 kb away from their nearest TES (x-axis) are plotted to visualize their location along the E. coli chromosome (y-axis). Position of OriC and TerC are indicated by two horizontal lines. Positive supercoiling sites are colored in red if they associate with a highly transcribed TU (top 25% percentile) and in green otherwise. (F) The NS counterpart of (E). (GH) Control experiments repeating the analysis in (E) using the randomly generated sets of genomic sites.
Figure 5.
Figure 5.
Cartoon illustration of two chromosome organization models. (A) The static model. Positively supercoiled DNA (+SC, twisted and tightly packed lines under the light blue shade, with two representative loci shown in blue) are spatially closest to each other, reminiscent of the heterochromatin in eukaryotes. Negatively supercoiled DNA (–SC, twisted and loosely packed lines, with two representative loci shown in green) are closer to each than relaxed DNA (RLX, untwisted and extended lines, with two representative loci shown in red), and may reflect open chromatin conformations that are reminiscent of the euchromatin in eukaryotes, where genomic processes such transcription and replication occur without topological hindrance. (B) The dynamic model. Positively supercoiled DNA may be more mobile (indicated by the motion-blurred, twisted lines) than negative supercoiled (twisted lines) and relaxed DNA (extended lines, both in sharp focus), the motions of which are restricted by the presence of DNA-binding proteins such as RNA polymerase and NAPs (black dots along the lines). The higher mobility of positively supercoiled DNA allows them to interact with each other more frequently (indicated by the light-blue shaded area) and hence contribute to their higher-than-average Hi-C contact frequencies.

References

    1. Cavalli G., Misteli T.. Functional implications of genome topology. Nat. Struct. Mol. Biol. 2013; 20:290–299. - PMC - PubMed
    1. Ali Azam T., Iwata A., Nishimura A., Ueda S., Ishihama A. Growth phase-dependent variation in protein composition of the escherichia coli nucleoid. J. Bacteriol. 1999; 181:6361–6370. - PMC - PubMed
    1. Lioy V.S., Cournac A., Marbouty M., Duigou S., Mozziconacci J., Espéli O., Boccard F., Koszul R.. Multiscale structuring of the E. coli chromosome by nucleoid-associated and condensin proteins. Cell. 2018; 172:771–783. - PubMed
    1. Cockram C., Thierry A., Koszul R.. Generation of gene-level resolution chromosome contact maps in bacteria and archaea. STAR Protoc. 2021; 2:100512. - PMC - PubMed
    1. van Berkum N.L., Lieberman-Aiden E., Williams L., Imakaev M., Gnirke A., Mirny L.A., Dekker J., Lander E.S.. Hi-C: a method to study the three-dimensional architecture of genomes. J. Vis. Exp. 2010; 39:1869. - PMC - PubMed

MeSH terms