. 2024 Jan 11;12(1):e0498122.
doi: 10.1128/spectrum.04981-22. Epub 2023 Dec 5.

Salmonella actively modulates TFEB in murine macrophages in a growth-phase and time-dependent manner

Affiliations

Salmonella actively modulates TFEB in murine macrophages in a growth-phase and time-dependent manner

Subothan Inpanathan et al. Microbiol Spectr. .

Abstract

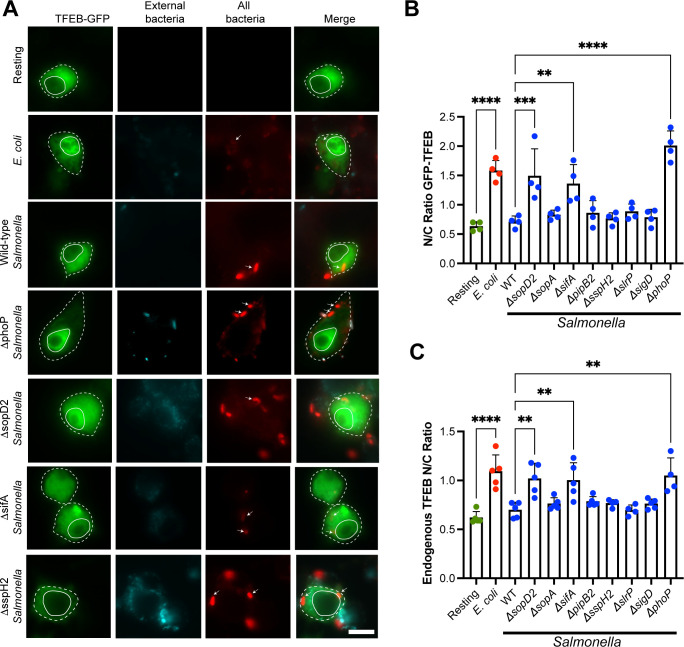
Activation of the host transcription factor TFEB helps mammalian cells adapt to stresses such as starvation and infection by upregulating lysosome, autophagy, and immuno-protective gene expression. Thus, TFEB is generally thought to protect host cells. However, it may also be that pathogenic bacteria like Salmonella orchestrate TFEB in a spatio-temporal manner to harness its functions to grow intracellularly. Indeed, the relationship between Salmonella and TFEB is controversial since some studies showed that Salmonella actively promotes TFEB, while others have observed that Salmonella degrades TFEB and that compounds that promote TFEB restrict bacterial growth. Our work provides a path to resolve these apparent discordant observations since we showed that stationary-grown Salmonella actively delays TFEB after infection, while late-log Salmonella is permissive of TFEB activation. Nevertheless, the exact function of this manipulation remains unclear, but conditions that erase the conditional control of TFEB by Salmonella may be detrimental to the microbe.

Keywords: Salmonella; bacteria; cell adaptation; culture; innate immunity; lysosomes; macrophages; transcription factors.


Conflict of interest statement

The authors declare no conflict of interest.

Figures

Fig 1
Fig 1
Stationary-grown Salmonella delays TFEB nuclear translocation after phagocytosis. (A) Epifluorescence micrographs of fixed RAW macrophages transiently expressing GFP-TFEB and that were given no bacteria (resting) or incubated for 1 h with living E. coli, or with living or heat-killed Salmonella grown to stationary phase. Samples were stained for external (before permeabilization) and all bacteria (after permeabilization) using anti-E. coli or anti-Salmonella antibodies. Arrows indicate internalized bacteria. Scale bar = 10µm. (B) The nuclear to cytosolic (N/C) fluorescence ratio of GFP-TFEB in macrophages was quantified for the indicated conditions after 1 h of uptake. Means ± SEM was tested using one-way ANOVA test and post hoc Tukey’s test, where *** indicates P < 0.001. (C and D) GFP-TFEB transfected RAW macrophages engulfed live stationary E. coli or Salmonella for 1, 4, or 6 h. The N/C fluorescence ratio of GFP-TFEB was then quantified. (C and D) are different representations of the same data. Data are shown as mean ± SEM from three independent (B) or four independent (C, D) experiments, scoring at least 50 cells for each condition per experiment. For (C and D), mean ± SEM are shown and tested using two-way ANOVA test and post hoc Tukey’s test, where *, **, and *** indicate P values of 0.05–0.01, P values of 0.01–0.001, or P < 0.001, respectively.
Fig 2
Fig 2
Stationary-grown Salmonella but not log-phase Salmonella delays TFEB activation in macrophages. (A) Confocal micrographs of RAW cells expressing GFP-TFEB before, 1 h, or 4 h after engulfing living E. coli and Salmonella grown to stationary or late log-phase. After uptake, cells were fixed and stained with DAPI and with anti-bacteria antibodies to detect the nucleus and bacteria, respectively. (B) The N/C fluorescence ratio of GFP-TFEB in macrophages 1 h after engulfment of stationary- or late-log bacteria. (C) The N/C fluorescence ratio of GFP-TFEB in macrophages 1 or 4 h after engulfment of stationary-grown E. coli or Salmonella. (D) The N/C fluorescence ratio of GFP-TFEB in macrophages 1 or 4 h after engulfment of log-phase grown E. coli or Salmonella. For (B–D), data are shown as mean ± SEM from three independent experiments, scoring 70 cells for each condition per experiment. Means were tested using matched two-way ANOVA test and post hoc Tukey’s test, where *, **, and *** indicate P values of 0.05–0.01, P values of 0.01–0.001, or P < 0.001, respectively.
Fig 3
Fig 3
The distribution of endogenous TFEB in macrophages after uptake of viable and non-viable E. coli and Salmonella. (A) Confocal micrographs of RAW macrophages incubated with living or heat-killed stationary-grown E. coli or living or heat-killed Salmonella grown to either stationary or late-logarithmic phase. After 1 h, cells were fixed and stained with DAPI (blue) to identify the nucleus, anti-TFEB antibodies (green), and anti-LPS antibodies to identify all bacteria (red). Scale bar = 10 µm. (B) N/C fluorescence ratio of endogenous TFEB in macrophages subject to indicated conditions. Data are shown as mean ± SEM from three independent experiments, scoring 80 cells for each condition and experiment. Means were tested using one-way ANOVA test with matched data and post hoc Dunnett’s test, where *, **, ***, and **** indicate P values of 0.05–0.01, 0.01–0.001, 0.001–0.0001, or P < 0.0001, respectively.
Fig 4
Fig 4
TFEB distribution in HeLa cells after infection with Salmonella. (A) Confocal images of HeLa cells incubated with living stationary or late-log grown Salmonella. After 1 and 4 h post-infection, cells were fixed and stained for external Salmonella with anti-Salmonella serum and far-red secondary antibodies, followed by permeabilization and stained with DAPI (blue) to identify the nucleus, anti-TFEB antibody (green), and anti-Salmonella antiserum (red bacteria are internal; yellow are external). Images represent summed Z stack images. Scale bar = 10 µm. (B) N/C ratio of endogenous TFEB fluorescence in HeLa cells. Data shown represent mean values ± SEM. Statistical analysis was preformed using matched one-way ANOVA and post hoc Tukey’s test, where * and ** indicate P values of 0.05–0.01 and 0.01–0.001, respectively.
Fig 5
Fig 5
TFEB phosphorylation and protein levels in macrophages after Salmonella infection. (A and C) Macrophages engulfed E. coli or Salmonella grown to stationary or log-phase for 1 or 4 h. Macrophages were then lysed and lysates separated on a Phos-tag SDS-PAGE (A) or standard SDS-PAGE (C), followed by blotting with anti-TFEB antibodies. The loading control was β-actin for both types of electrophoresis. (B and D). The migration front of TFEB separated in Phos-tag gels was measured as indicator of phosphorylation status of TFEB (B) and normalized total TFEB levels relative to β-actin (D). Shown is the mean ± SD analyzed from five independent experiments. Data in (B) were analyzed by a matched one-way ANOVA and Dunnett post hoc test, while data in (D) were tested by Friedman one-way ANOVA test and the Dunn’s post hoc test. * and ** indicate a P value of <0.05 and <0.01, respectively.
Fig 6
Fig 6
SPI-I and SPI-II-deficient Salmonella do not stall TFEB activation in macrophages. (A) Confocal images of RAW cells expressing GFP-TFEB (green) 1 h after engulfing wild-type or invA ssaR Salmonella grown to stationary or late log-phase. After uptake, cells were fixed and stained with DAPI (blue) and with anti-bacteria antibodies (red). (B) The N/C fluorescence ratio of GFP-TFEB in macrophages after 1 h engulfment of Salmonella strains and grown to indicated phases. Data are shown as mean ± SEM from three independent experiments, scoring at least 70 cells for each condition per experiment. Means were tested using two-way ANOVA test and post hoc Tukey’s test, where * and ** indicate P values of 0.05–0.01 and 0.01–0.001, respectively.
Fig 7
Fig 7
Identification of Salmonella mutants that cannot suppress TFEB nuclear translocation in RAW macrophages. (A) Epifluorescence micrographs of RAW cells expressing GFP-TFEB 1 h after engulfment of indicated bacteria strains. Cells were fixed and stained for external (cyan) and internal bacteria (red) bacteria with anti-E. coli or anti-Salmonella antibodies. Arrows point to specific internal bacteria, while full and dotted outlines indicate nucleus and individual cell boundaries. Scale bar represents 10 µm. (B) N/C ratio of GFP-TFEB in macrophages after engulfment of indicated bacterial strains. (C) N/C ratio of endogenous TFEB in macrophages after engulfment of indicated bacterial strains. For (B and C), data are shown as mean ± SEM from four independent experiments with approximately 50 cells counted per condition per experiment. Means were tested using one-way ANOVA test and post hoc Tukey’s test, where *, **, and *** indicate P values of 0.05–0.01, P values of 0.01–0.001, or P < 0.001, respectively.
Fig 8
Fig 8
mRNA levels of LAMP1, cathepsin D, and LC3 during Salmonella infection. (A) Basal expression of LAMP1, cathepsin D, and LC3 genes across wildtype, tfeb−/− , and tfeb−/− tfe3−/− RAW macrophages normalized to wildtype. (B, D, and F) Relative LAMP1 (B), cathepsin D (D), and LC3 (F) mRNA expression within each cell type infected with either stationary or late-log grown Salmonella at indicated times post-infection. (C, E, and G) Comparison of LAMP1 (C), cathepsin D (E), and LC3 (G) mRNA expression at 20 h post-infection between wild-type, tfeb−/− , and tfeb−/− tfe3−/− . Data in (C, E, and G) are the same as 20 h from (B, D, and F). Data plotted represent means of individual replicates ± SD. Statistical analysis was preformed using matched one-way ANOVA and post hoc Tukey’s test, where *, **, and *** indicate P values of 0.05–0.01, 0.01–0.001, and 0.001–0.0001, respectively.
Fig 9
Fig 9
Autophagy in RAW macrophages during stationary and late-log Salmonella infection. (A, B, and C) Confocal images of wildtype (A), tfeb−/− (B), and tfeb−/−/tfe3−/− (C)RAW macrophages transfected with mCherry-GFP-LC3. Cells were subject to stationary or late-log Salmonella infection and were fixed at 2, 4, and 6 h post-infection. Cells were also immunofluorescently stained for Salmonella using an anti-Salmonella antiserum. Panel shows 2 and 6 h post-infection images. Scale bar = 12 µm. (D) Quantification of autophagosomes in resting wildtype, tfeb−/− , and tfeb−/−/tfe3−/− RAW macrophage. (E, F and G) Comparison of autophagosome numbers between stationary and late-log Salmonella infected macrophages over time for each respective cell type. tfeb−/− and tfeb−/−/tfe3−/− values are normalized against wild-type resting condition. Plotted values represent mean values per replicate and ± SEM. For (D), statistical analysis was done using one-way ANOVA and Friedman’s multiple comparisons. Statistical analysis for (E and G) was preformed using matched two-way ANOVA and post hoc Tukey’s test, where *, **, and *** indicate P values of 0.05–0.01, 0.01–0.001, and 0.001–0.0001, respectively.
Fig 10
Fig 10
Autophagosome maturation and xenophagy bacterial capture in RAW macrophages during Salmonella infection. (A) Ratio of mature over total autophagosomes in resting wildtype, tfeb−/−, and tfeb−/−-/tfe3−/ RAW macrophages normalized to wildtype. (B) Ratio of mature to total autophagosomes during stationary or late-log infection in wildtype, tfeb−/−, and tfeb−/−/tfe3−/− RAW macrophages. (C) Ratio of LC3-labeled bacteria over total bacteria during infection in each macrophage genotype. Data plotted represent mean values and ±SEM from n = 5 independent experiments. Statistical analysis was preformed using matched one-way ANOVA and post hoc Tukey’s test.
Fig 11
Fig 11
E. coli and Salmonella survival in wild-type, tfeb −/− macrophages, and HeLA-TKO cells. (A and B) Wild-type and tfeb −/− RAW macrophages were allowed to phagocytose live E. coli (A) or Salmonella (B) for 1 h, followed with gentamycin to kill external bacteria. One macrophage population was immediately lysed and bacteria were plated to count CFUs as an estimate of bacterial uptake. A second population of macrophages was incubated for 4 h with low gentamycin, then lysed, and bacteria plated to count CFUs as indicator of acute bacterial survival in macrophages. Data are shown as percent survival by taking the ratio of CFUs after 4 h of incubation relative to CFUs formed after 1 h incubation (uptake). (C) Wild-type and tfeb−/− tfe3−/− RAW macrophages were allowed to engulf stationary and late-logarithmic grown Salmonella. (D) Infection of wild-type HeLa and tfeb−/− tfe3−/− mitf−/− HeLa (HeLa-TKO) cells as described in (C). Infections were followed for 4 and 20 h pos-infection. Percent survival was determined as described above. Data are shown as the mean ± SD from four (C) or six (D) independent experiments. Data in (A and B) were statistically analyzed by paired Student’s t test, while data in (C and D) were tested by matched two-way ANOVA and Šidák post hoc test. P values are disclosed for survival assays.
Fig 12
Fig 12
Ectopic activation of TFEB enhances Salmonella killing in macrophages in a TFEB-dependent manner. (A and B) Wild-type and tfeb −/− RAW macrophages were left untreated or pre-activated with IgG-opsonized beads as described in Materials and Methods and then allowed to engulf live E. coli (A) or Salmonella (B). Percent survival of E. coli (A) or Salmonella (B) was determined by comparing number of CFUs between initial uptake and 3 h post uptake. Shown is the average ± STD from n = 8 independent experiments. (C) Cells were pre-treated with 20 nM apilimod or DMSO vehicle for 1 h and maintained through the infection with stationary or late-logarithmic Salmonella. Percent survival of bacteria was measured by comparing the number of CFU at the end of 4 h chase with CFUs from initial uptake (1 h) as described in Materials and Methods. Shown is the mean and standard deviation from n = 3 independent experiments. (A–C) Data were analyzed by matched two-way ANOVA and Šidák’s post hoc test. Actual P values are shown for survival experiments

References

    1. Flannagan RS, Jaumouillé V, Grinstein S. 2012. The cell biology of phagocytosis. Annu Rev Pathol 7:61–98. doi:10.1146/annurev-pathol-011811-132445 - DOI - PubMed
    1. Levin R, Grinstein S, Canton J. 2016. The life cycle of phagosomes: formation, maturation, and resolution. Immunol Rev 273:156–179. doi:10.1111/imr.12439 - DOI - PubMed
    1. Nguyen JA, Yates RM. 2021. Better together: current insights into phagosome-lysosome fusion. Front Immunol 12:636078. doi:10.3389/fimmu.2021.636078 - DOI - PMC - PubMed
    1. Fountain A, Inpanathan S, Alves P, Verdawala MB, Botelho RJ. 2021. Phagosome maturation in macrophages: eat, digest, adapt, and repeat. Adv Biol Regul 82:100832. doi:10.1016/j.jbior.2021.100832 - DOI - PubMed
    1. Bouvier G, Benoliel AM, Foa C, Bongrand P. 1994. Relationship between phagosome acidification, phagosome-lysosome fusion, and mechanism of particle ingestion. J Leukoc Biol 55:729–734. doi:10.1002/jlb.55.6.729 - DOI - PubMed

Substances

LinkOut - more resources