. 2023;43(12):675-692.
doi: 10.1080/10985549.2023.2282349. Epub 2023 Dec 20.

Fission Yeast TORC1 Promotes Cell Proliferation through Sfp1, a Transcription Factor Involved in Ribosome Biogenesis

Affiliations

Fission Yeast TORC1 Promotes Cell Proliferation through Sfp1, a Transcription Factor Involved in Ribosome Biogenesis

Yen Teng Tai et al. Mol Cell Biol. 2023.

Abstract

Target of rapamycin complex 1 (TORC1) is activated in response to nutrient availability and growth factors, promoting cellular anabolism and proliferation. To explore the mechanism of TORC1-mediated proliferation control, we performed a genetic screen in fission yeast and identified Sfp1, a zinc-finger transcription factor, as a multicopy suppressor of temperature-sensitive TORC1 mutants. Our observations suggest that TORC1 phosphorylates Sfp1 and protects Sfp1 from proteasomal degradation. Transcription analysis revealed that Sfp1 positively regulates genes involved in ribosome production together with two additional transcription factors, Ifh1/Crf1 and Fhl1. Ifh1 physically interacts with Fhl1, and the nuclear localization of Ifh1 is regulated in response to nutrient levels in a manner dependent on TORC1 and Sfp1. Taken together, our data suggest that the transcriptional regulation of the genes involved in ribosome biosynthesis by Sfp1, Ifh1, and Fhl1 is one of the key pathways through which nutrient-activated TORC1 promotes cell proliferation.

Keywords: Sfp1; TORC1; fission yeast; rapamycin; ribosome; transcription factor.


Conflict of interest statement

No potential conflict of interest was reported by the author(s).

Figures

FIG 1
FIG 1
The sfp1+ gene is a multicopy suppressor of TORC1 hypomorphic alleles. (A) Growth assessment of wild-type (WT) and tor2 mutant strains carrying the indicated vectors. Serial dilutions of the indicated cells were spotted onto solid EMM medium with or without rapamycin (100 ng/mL), followed by incubation at the specified temperatures. (B) Schematic representation comparing Sfp1 in S. pombe and S. cerevisiae. (C) Growth assessment of wild-type and tor2-287 mutant strains carrying either an empty vector, pALSK53, or pSNP-Sfp1-FLAG expressing FLAG-tagged Sfp1 under its native promoter. (D) Growth assessment of wild-type and tor2-287 mutant strains carrying either an empty vector or pSNP vectors expressing various forms of Sfp1 including the full-length protein and truncated versions with one (Δ84-105) or two (ΔC150) of the zinc finger domains removed. (E) TORC1 activity in wild-type and tor2-287 mutant strains carrying either an empty vector or pSNP-Sfp1-FLAG. Cells were cultured in liquid EMM medium at 25 °C and shifted to 36 °C. TORC1 activity was assessed by detecting TORC1-dependent phosphorylation of Psk1 (Psk1-P). Samples were probed with an anti-Spc1 MAPK antibody as a loading control. (F) TORC1 activity in wild-type and Δsfp1 cells was monitored as in (E). Cells were grown in liquid EMM medium and shifted to the same medium without nitrogen. (G and H) Serial dilutions of wild-type and Δsfp1 cells were spotted onto solid YES medium with or without 100 ng/mL rapamycin (G) or onto solid medium with 3% glucose or glycerol as the carbon source (H). (I) The indicated strains were spotted in serial dilutions onto solid YES medium. (J) TORC1 activity during nitrogen starvation was monitored in wild-type and indicated mutant strains as described in (F).
FIG 2
FIG 2
TORC1 facilitates stable expression of Sfp1. (A) C-terminal FLAG-tagged Sfp1 was expressed from its native chromosomal locus and analyzed by immunoblotting. The indicated strains were grown in liquid YES medium at 25 °C and then shifted to 36 °C. TORC1 activity was assessed as in Fig. 1E. (B) The indicated strains were grown in liquid YES medium and shifted to the same medium with 200 ng/mL rapamycin. (C and D) Cells expressing Sfp1-FLAG were grown in liquid EMM medium and shifted to the same medium without nitrogen (C) or glucose (D). After 60 min of starvation, ammonium (C) or glucose (D) was added. (E) Cells expressing Sfp1 tagged with C-terminal mNeonGreen (mNG) from its native chromosomal locus were subjected to microscopy analysis. Z-axial images were collected, and mid-section images after deconvolution were shown. The number of cells exhibiting Sfp1 nuclear signal under nitrogen-rich and nitrogen-deficient conditions was quantified. Scale bars, 5 μm. (F) The indicated strains were grown in liquid EMM medium and shifted to the same medium without nitrogen. (G and H) Sfp1 protein levels during prolonged nitrogen (G) or glucose (H) starvation. (I and J) The indicated strains were grown in liquid EMM medium and shifted to the same medium without nitrogen. LE, long exposure. (K) Wild-type and mts3-1 cells were incubated at 36 °C for 2 h before nitrogen starvation and analyzed as in (F). (L) Sfp1 protein degradation during nitrogen starvation was monitored in the presence or absence of the proteasome inhibitor bortezomib (1 mM), with the degradation of the proteasome target Cut8 as a control. (M) In vitro TORC1 kinase assay. TORC1 was immunoprecipitated from cells expressing FLAG-tagged Mip1 and incubated with recombinant His64E-BP1, GST, or GST-Sfp1. Phosphorylation and proteins were visualized by autoradiography and Coomassie staining (CBB), respectively.
FIG 3
FIG 3
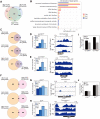
Sfp1 is a transcription factor that regulates genes involved in ribosome production. (A) GO functional analysis of genes that are downregulated in the Δsfp1 mutant in comparison to the wild-type strain. The x axis (in logarithmic scale) represents adjusted P values. Gene ratio is defined as cluster frequency over genome frequency associated with a GO term. (B and C) Box (B) and MA (C) plots depicting the fold change of the downregulated RP (n = 141) and Ribi (n = 292) genes in the Δsfp1 mutant relative to the wild type. Significant differences between the wild type and the mutant are denoted by asterisks (P < 0.05).
FIG 4
FIG 4
Sfp1 acts with the Ifh1-Fhl1 complex in the regulation of ribosome production. (A) Comparison of Ifh1/Crf1 and Fhl1 in S. pombe and S. cerevisiae. The schematic highlights the forkhead binding (green), FHA (pink), and forkhead (orange) domains. CK2-dependent phosphorylation sites in S. cerevisiae Ifh1 and Crf1, along with similar sequences identified in S pombe Ifh1, are labeled. (B and C) The indicated strains were spotted in serial dilutions onto solid YES medium. (D–F) The interaction between Ifh1 and Fhl1 was examined by immunoprecipitation. Ifh1 and Fhl1, each tagged with C-terminal FLAG and myc tags, respectively, were expressed from their native chromosomal loci in the indicated strains. Anti-FLAG immunoprecipitation was performed, followed by anti-FLAG and anti-myc immunoblotting. To assess the function of the FHA domain, full-length (FL) Fhl1 was compared with a version lacking the N-terminal 150 amino acids (ΔN150) (E). (G) GO functional analysis of genes downregulated in the Δifh1 and Δfhl1 mutants. The x axis (in logarithmic scale) represents adjusted P values. Gene ratio is defined as cluster frequency over genome frequency associated with a GO term. (H and I) Box and MA plots illustrating the fold change of the RP and Ribi genes that are downregulated in the Δifh1 (H) and Δfhl1 (I) mutants. Asterisks indicate a significant difference compared to wild type (P < 0.05). (J) Venn diagram depicting the overlap of the downregulated RP and Ribi genes among the Δifh1, Δfhl1, and Δsfp1 mutants. (K) Relative expression levels of representative RP (rps403+, rps1402+, and rps2501+) and Ribi (rlp7+ and cms1+) genes in the indicated strains, as determined by RT-PCR. Data represent the mean ± SD (n = 3). Asterisks denote a significant difference relative to wild type (P < 0.05).
FIG 5
FIG 5
Sfp1, Ifh1, and Fhl1 bind to the RP and Ribi genes. (A) Venn diagram representing the overlap of ChIP-seq target genes among Sfp1, Ifh1, and Fhl1. (B) GO functional analysis of target genes for Sfp1, Ifh1, and Fhl1. The x axis (in logarithmic scale) represents adjusted P values. (C) Venn diagram representing the overlap between the RP genes and target genes for Ifh1, Fhl1, or Sfp1. (D and E) Bar graphs indicate fold enrichment of Ifh1, Fhl1, and Sfp1 at representative RP genes relative to prp3+ (left). Data represent the mean ± SEM (n = 3). IGV tracks depict binding peaks of Ifh1, Fhl1, and Sfp1 at the indicated gene loci (right). Y axes represent log2 ratio of immunoprecipitation to input (IP/input), and x axes mark chromosome regions. Black boxes represent corresponding genes, with white arrows signifying the direction of transcription. (F) Venn diagram indicating the overlap between the Ribi genes and target genes for Ifh1, Fhl1, or Sfp1. (G and H) Assessment of Ifh1, Fhl1, and Sfp1 binding to representative Ribi genes, conducted as described in (D). (I and J) Fold enrichment of Sfp1 at the indicated gene loci relative to prp3+ in wild-type and Δifh1 cells. The data for wild type are the same as those for Sfp1 in (D), (E), (G), and (H). Data represent the mean ± SEM (n = 3).
FIG 6
FIG 6
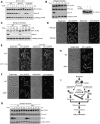
Ifh1 is under the regulation of TORC1. (A) The indicated strains expressing FLAG-tagged Ifh1 from its native chromosomal locus were cultured in liquid YES medium at 25 °C and shifted to 36 °C. (B and C) The indicated strains expressing C-terminal FLAG-tagged Ifh1 and myc-tagged Fhl1 from their native chromosomal loci were cultured in liquid EMM medium and then shifted to the same medium lacking nitrogen. Phosphorylation of Ifh1 was verified by lambda phosphatase (PPase) treatment in the presence (+) or absence (–) of phosphatase inhibitors (B). (D-F) The indicated strains expressing mEGFP-tagged Ifh1 or Fhl1 were analyzed by microscopy. Z axial images were collected and mid-section images after deconvolution are shown. Scale bars, 5 μm. (G) The indicated strains were subjected to nitrogen starvation and immunoblotting as in (B). (H) The indicated strains expressing mEGFP-tagged Ifh1 were analyzed as in (F). Scale bars, 5 μm. (I) Proposed mechanism of TORC1-mediated control of cell proliferation via Sfp1-regulated ribosome biogenesis.

References

    1. Wullschleger S, Loewith R, Hall MN.. TOR signaling in growth and metabolism. Cell. 2006;124:471–484. doi:10.1016/j.cell.2006.01.016. - DOI - PubMed
    1. Loewith R, Hall MN.. Target of rapamycin (TOR) in nutrient signaling and growth control. Genetics. 2011;189:1177–1201. doi:10.1534/genetics.111.133363. - DOI - PMC - PubMed
    1. Yang H, Jiang X, Li B, Yang HJ, Miller M, Yang A, Dhar A, Pavletich NP.. Mechanisms of mTORC1 activation by RHEB and inhibition by PRAS40. Nature. 2017;552:368–373. doi:10.1038/nature25023. - DOI - PMC - PubMed
    1. Inoki K, Li Y, Xu T, Guan K-L.. Rheb GTPase is a direct target of TSC2 GAP activity and regulates mTOR signaling. Genes Dev. 2003;17:1829–1834. doi:10.1101/gad.1110003. - DOI - PMC - PubMed
    1. Inoki K, Li Y, Zhu T, Wu J, Guan K-L.. TSC2 is phosphorylated and inhibited by Akt and suppresses mTOR signalling. Nat Cell Biol. 2002;4:648–657. doi:10.1038/ncb839. - DOI - PubMed

Publication types

MeSH terms

Substances