. 2024 Feb 2;12(2):247-260.
doi: 10.1158/2326-6066.CIR-23-0440.

Engagement of CD99 Activates Distinct Programs in Ewing Sarcoma and Macrophages

Affiliations

Engagement of CD99 Activates Distinct Programs in Ewing Sarcoma and Macrophages

Maria Cristina Manara et al. Cancer Immunol Res. .

Abstract

Ewing sarcoma (EWS) is the second most common pediatric bone tumor. The EWS tumor microenvironment is largely recognized as immune-cold, with macrophages being the most abundant immune cells and their presence associated with worse patient prognosis. Expression of CD99 is a hallmark of EWS cells, and its targeting induces inhibition of EWS tumor growth through a poorly understood mechanism. In this study, we analyzed CD99 expression and functions on macrophages and investigated whether the concomitant targeting of CD99 on both tumor and macrophages could explain the inhibitory effect of this approach against EWS. Targeting CD99 on EWS cells downregulated expression of the "don't eat-me" CD47 molecule but increased levels of the "eat-me" phosphatidyl serine and calreticulin molecules on the outer leaflet of the tumor cell membrane, triggering phagocytosis and digestion of EWS cells by macrophages. In addition, CD99 ligation induced reprogramming of undifferentiated M0 macrophages and M2-like macrophages toward the inflammatory M1-like phenotype. These events resulted in the inhibition of EWS tumor growth. Thus, this study reveals what we believe to be a previously unrecognized function of CD99, which engenders a virtuous circle that delivers intrinsic cell death signals to EWS cells, favors tumor cell phagocytosis by macrophages, and promotes the expression of various molecules and cytokines, which are pro-inflammatory and usually associated with tumor regression. This raises the possibility that CD99 may be involved in boosting the antitumor activity of macrophages.


Figures

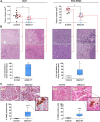
Figure 1. The human anti-CD99 dAbd C7 inhibits tumor growth and increases macrophages infiltration. A, Tumor volume after treatment with the anti-CD99 dAbd C7 in xenografts derived from injection of 6647 cells in nude mice. Control, n = 10; dAbd C7, n = 6 (left) or PDX-EW#2 tumors developed in NSG mice; control, n = 4; dAbd C7, n = 5 (right). Dots represent single tumor volumes, mean ± SD are displayed. Mann–Whitney U test, *, P < 0.05. B, Representative H&E images of 6647 (left) or PDX-EW#2 (right) xenografts treated or not with dAbd C7 (scale bar, 50 μm). The tumor regions with nuclear condensation and the total area of the samples were identified by manually marking with Image J software. Histogram represents the percentage of tumor area with nuclear condensation (vs. total tumor area). Data are expressed as the median and range (minimum–maximum). Mann–Whitney U test, *, P < 0.05. C, Representative images of double staining IHC for F4/80 murine macrophages (brown) and CD99 EWS cells (red) in 6647 (left) or PDX-EW#2 (right) xenografts after treatment with dAbd C7 (scale bar, 50 μm). The enlarged box shows a mouse macrophage with engulfed EWS cells; the histograms represent the percentage of F4/80-positive cells calculated after evaluation of at least ten fields. Data are expressed as the median and range (minimum–maximum. Mann–Whitney U test; ***, P < 0.001.
Figure 1.
The human anti-CD99 dAbd C7 inhibits tumor growth and increases macrophages infiltration. A, Tumor volume after treatment with the anti-CD99 dAbd C7 in xenografts derived from injection of 6647 cells in nude mice. Control, n = 10; dAbd C7, n = 6 (left) or PDX-EW#2 tumors developed in NSG mice; control, n = 4; dAbd C7, n = 5 (right). Dots represent single tumor volumes, mean ± SD are displayed. Mann–Whitney U test, *, P < 0.05. B, Representative H&E images of 6647 (left) or PDX-EW#2 (right) xenografts treated or not with dAbd C7 (scale bar, 50 μm). The tumor regions with nuclear condensation and the total area of the samples were identified by manually marking with Image J software. Histogram represents the percentage of tumor area with nuclear condensation (vs. total tumor area). Data are expressed as the median and range (minimum–maximum). Mann–Whitney U test, *, P < 0.05. C, Representative images of double staining IHC for F4/80 murine macrophages (brown) and CD99 EWS cells (red) in 6647 (left) or PDX-EW#2 (right) xenografts after treatment with dAbd C7 (scale bar, 50 μm). The enlarged box shows a mouse macrophage with engulfed EWS cells; the histograms represent the percentage of F4/80-positive cells calculated after evaluation of at least ten fields. Data are expressed as the median and range (minimum–maximum. Mann–Whitney U test; ***, P < 0.001.
Figure 2. Macrophage-mediated phagocytosis and cytotoxicity of EWS cells after anti-CD99 antibodies treatment. A, Phagocytic index of M0-like macrophages cocultured for 6 hours with TC-EGFP cells being exposed to anti-CD99 antibodies (12E7 mAb; 0662 mAb; dAbd C7 or to irrelevant MOPC21 antibody used as isotype control) for 30 minutes. Phagocytic index indicated the number of EWS cells phagocytosed per 100 macrophages. Dots represent single fields and data are expressed as the median and range (minimum–maximum) of at least three independent experiments. One-way ANOVA: *, P < 0.05; **, P < 0.01; ***, P < 0.001. B, Representative images of M0-like macrophages phagocytosing EWS cells after treatment with anti-CD99 antibodies. Arrows point to phagocytosed tumor cells (scale bar, 50 μm). C, EWS cell survival in the presence or not of M0-like macrophages (Mφ) detected by Trypan blue vital counting. Data are expressed as percentage compared with untreated TC-71 cells. Bars represent the mean ± SD of at least three independent experiments. Mann–Whitney U test: *, P < 0.05; **, P < 0.01.
Figure 2.
Macrophage-mediated phagocytosis and cytotoxicity of EWS cells after anti-CD99 antibodies treatment. A, Phagocytic index of M0-like macrophages cocultured for 6 hours with TC-EGFP cells being exposed to anti-CD99 antibodies (12E7 mAb; 0662 mAb; dAbd C7 or to irrelevant MOPC21 antibody used as isotype control) for 30 minutes. Phagocytic index indicated the number of EWS cells phagocytosed per 100 macrophages. Dots represent single fields and data are expressed as the median and range (minimum–maximum) of at least three independent experiments. One-way ANOVA: *, P < 0.05; **, P < 0.01; ***, P < 0.001. B, Representative images of M0-like macrophages phagocytosing EWS cells after treatment with anti-CD99 antibodies. Arrows point to phagocytosed tumor cells (scale bar, 50 μm). C, EWS cell survival in the presence or not of M0-like macrophages (Mφ) detected by Trypan blue vital counting. Data are expressed as percentage compared with untreated TC-71 cells. Bars represent the mean ± SD of at least three independent experiments. Mann–Whitney U test: *, P < 0.05; **, P < 0.01.
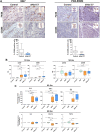
Figure 3. Modulation of ‘eat-me’ and ‘don't eat-me’ molecules on EWS cell surface after CD99 engagement. A, Cytofluorimetric profile of PS and CALR expression in EWS cells treated with anti-CD99 antibodies (expressed as percentage of positive cells). B, MFI of CD47 expression in EWS cells treated with anti-CD99 antibodies. All cells are 100% positive to CD47 even after treatments. Bars indicated the mean ± SD of at least three independent experiments. One-way ANOVA: *, P < 0.05; **, P < 0.01; ***, P < 0.001. Gating strategy and representative profiles of each type of experiment (A–B), are reported in Supplementary Figs. S4 and S5. C, Confocal microscopy images of CD47 in TC-71 cells treated with 0662 mAb (10 μg/mL), indicating intracellular localization of CD47 (arrows). Enlarged views of the boxed regions are also displayed (scale bar, 50 μm, representative images of two independent experiments are shown). D, Western blot analysis of CD47 on total cell lysates from 6647 and TC-71 cells treated with anti-CD99 antibodies (0662 mAb; dAbd C7) in the presence or absence of the proteasome inhibitor MG132. Data are representative of at least three independent experiments. Beta-tubulin was included as loading control. E, Representative images of IHC staining of CD47 in 6647 (left) or PDX-EW#2 (right) xenografts after treatment with dAbd C7 (scale bar, 50 μm). Histograms represent the percentage of CD47 positive cells calculated after evaluation of at least ten fields. Data are presented as the median and range (minimum–maximum). Mann–Whitney U test: *, P < 0.05; ***, P < 0.001.
Figure 3.
Modulation of ‘eat-me’ and ‘don't eat-me’ molecules on EWS cell surface after CD99 engagement. A, Cytofluorimetric profile of PS and CALR expression in EWS cells treated with anti-CD99 antibodies (expressed as percentage of positive cells). B, MFI of CD47 expression in EWS cells treated with anti-CD99 antibodies. All cells are 100% positive to CD47 even after treatments. Bars indicated the mean ± SD of at least three independent experiments. One-way ANOVA: *, P < 0.05; **, P < 0.01; ***, P < 0.001. Gating strategy and representative profiles of each type of experiment (AB), are reported in Supplementary Figs. S4 and S5. C, Confocal microscopy images of CD47 in TC-71 cells treated with 0662 mAb (10 μg/mL), indicating intracellular localization of CD47 (arrows). Enlarged views of the boxed regions are also displayed (scale bar, 50 μm, representative images of two independent experiments are shown). D, Western blot analysis of CD47 on total cell lysates from 6647 and TC-71 cells treated with anti-CD99 antibodies (0662 mAb; dAbd C7) in the presence or absence of the proteasome inhibitor MG132. Data are representative of at least three independent experiments. Beta-tubulin was included as loading control. E, Representative images of IHC staining of CD47 in 6647 (left) or PDX-EW#2 (right) xenografts after treatment with dAbd C7 (scale bar, 50 μm). Histograms represent the percentage of CD47 positive cells calculated after evaluation of at least ten fields. Data are presented as the median and range (minimum–maximum). Mann–Whitney U test: *, P < 0.05; ***, P < 0.001.
Figure 4. The presence of CD99 on EWS cell surface influences CD47 status. A, Expression of CD47 in CD99-silenced cells. Bars indicate MFI. Mean ± SD of at least three independent experiments, Kruskal–Wallis test: *, P < 0.05. B, Cytofluorimetric profile of CD47 expression in TC-CD99-shRNA#2 EWS cells treated with anti-CD99 antibodies. Bars indicate the mean ± SD of at least three independent experiments. Gating strategy and representative profiles of each type of experiment (A and B), are reported in Supplementary Fig. S7. C, Immunoprecipitation of CD99 with CD47 in 6647, TC-71, and TC-CD99-shRNA#2 EWS cells. Blots are representative of at least three independent experiments.
Figure 4.
The presence of CD99 on EWS cell surface influences CD47 status. A, Expression of CD47 in CD99-silenced cells. Bars indicate MFI. Mean ± SD of at least three independent experiments, Kruskal–Wallis test: *, P < 0.05. B, Cytofluorimetric profile of CD47 expression in TC-CD99-shRNA#2 EWS cells treated with anti-CD99 antibodies. Bars indicate the mean ± SD of at least three independent experiments. Gating strategy and representative profiles of each type of experiment (A and B), are reported in Supplementary Fig. S7. C, Immunoprecipitation of CD99 with CD47 in 6647, TC-71, and TC-CD99-shRNA#2 EWS cells. Blots are representative of at least three independent experiments.
Figure 5. Ex vivo undifferentiated M0-like macrophages switch to M1-like phenotype when cocultured with EWS cells treated with agonistic anti-CD99 antibodies. A, Representative IHC images of murine F4/80+ and CD206+ macrophages in 6647 (left) and PDX-EW#2 (right) xenografts after treatment with dAbd C7 (scale bar, 50 μm). Low magnifications are inserted to show tumor morphology, and the box represents the field of view of the 40× images displayed for each antigen. Quantification of IHC staining of tumor tissue samples in each group were quantified by ImageJ software. Data are expressed as median and range (minimum–maximum). Mann–Whitney U test: *, P < 0.05; ***, P < 0.001. B, The relative expression of CD80, CD86, CD163, CD206 was analyzed by qPCR in M0-like macrophages cocultured with TC-EGFP cells treated with 0662 mAb or dAbd C7 as indicated in material and methods. Data are expressed as the median and range (minimum–maximum). Kruskal–Wallis test: *, P < 0.05; **, P < 0.01; ***, P < 0.001. C, Multiplex cytokine assay analysis of IL1β, IL6, TNFα, CCL18, TGFβ1, and IL4 release in M0-like macrophages cocultured with TC-71 EGFP cells treated with 0662 mAb or dAbd C7 as indicated in material and methods. Data are expressed as the median and range (minimum–maximum) of the fold increase versus control = 1. Kruskal–Wallis test: *, P < 0.05; **, P < 0.01; ***, P < 0.001.
Figure 5.
Ex vivo undifferentiated M0-like macrophages switch to M1-like phenotype when cocultured with EWS cells treated with agonistic anti-CD99 antibodies. A, Representative IHC images of murine F4/80+ and CD206+ macrophages in 6647 (left) and PDX-EW#2 (right) xenografts after treatment with dAbd C7 (scale bar, 50 μm). Low magnifications are inserted to show tumor morphology, and the box represents the field of view of the 40× images displayed for each antigen. Quantification of IHC staining of tumor tissue samples in each group were quantified by ImageJ software. Data are expressed as median and range (minimum–maximum). Mann–Whitney U test: *, P < 0.05; ***, P < 0.001. B, The relative expression of CD80, CD86, CD163, CD206 was analyzed by qPCR in M0-like macrophages cocultured with TC-EGFP cells treated with 0662 mAb or dAbd C7 as indicated in material and methods. Data are expressed as the median and range (minimum–maximum). Kruskal–Wallis test: *, P < 0.05; **, P < 0.01; ***, P < 0.001. C, Multiplex cytokine assay analysis of IL1β, IL6, TNFα, CCL18, TGFβ1, and IL4 release in M0-like macrophages cocultured with TC-71 EGFP cells treated with 0662 mAb or dAbd C7 as indicated in material and methods. Data are expressed as the median and range (minimum–maximum) of the fold increase versus control = 1. Kruskal–Wallis test: *, P < 0.05; **, P < 0.01; ***, P < 0.001.
Figure 6. Engagement of CD99 on ex vivo undifferentiated M0-like macrophages induces M1-like polarization and increases their phagocytosis capabilities against EWS cells. A, Phagocytic index of M0-like macrophages exposed to anti-CD99 antibodies (0662 mAb; dAbd C7) or to irrelevant MOPC21 antibody (used as isotype control) for 3 hours and then cocultured with TC-EGFP cells for an additional 3 hours as indicated in the Materials and Methods. The phagocytic index indicates the number of EWS cells phagocytosed per 100 macrophages. Dots represent single fields, and data are expressed as the median and range (minimum–maximum) of at least three independent experiments. Kruskal–Wallis test: *, P < 0.05; **, P < 0.01. B, TC-EGFP cell survival in the presence of M0-like macrophages exposed to anti-CD99 antibodies. Trypan blue vital cell count was used. Data are expressed as percentages compared with untreated EWS cells. Bars indicate mean ± SD from at least three independent experiments. Kruskal–Wallis test: *, P < 0.05; **, P < 0.01. C, Relative expression of CD80, CD86, CD163, and CD206 was analyzed by qPCR in M0-like macrophages treated with anti-CD99 0662 mAb or dAbd C7 for 1 to 6 hours. Data are expressed as the mean ± SD. Two-way ANOVA test: *, P < 0.05; **, P < 0.01; ***, P < 0.001. D, Multiplex cytokine assay analysis of IL1β, IL6, TNFα, and IL4 release in M0-like macrophages treated with anti-CD99 0662 mAb or dAbd C7 as indicated in the Materials and Methods. Data are expressed as mean ± SD of the fold increase versus control M0-like = 1. Two-way ANOVA test: *, P < 0.05; **, P < 0.01; ***, P < 0.001. E, Western blot analysis of intracellular signaling molecules in M0-like macrophages treated as indicated. GAPDH was used as the loading control. Representative blots from three independent experiments are shown.
Figure 6.
Engagement of CD99 on ex vivo undifferentiated M0-like macrophages induces M1-like polarization and increases their phagocytosis capabilities against EWS cells. A, Phagocytic index of M0-like macrophages exposed to anti-CD99 antibodies (0662 mAb; dAbd C7) or to irrelevant MOPC21 antibody (used as isotype control) for 3 hours and then cocultured with TC-EGFP cells for an additional 3 hours as indicated in the Materials and Methods. The phagocytic index indicates the number of EWS cells phagocytosed per 100 macrophages. Dots represent single fields, and data are expressed as the median and range (minimum–maximum) of at least three independent experiments. Kruskal–Wallis test: *, P < 0.05; **, P < 0.01. B, TC-EGFP cell survival in the presence of M0-like macrophages exposed to anti-CD99 antibodies. Trypan blue vital cell count was used. Data are expressed as percentages compared with untreated EWS cells. Bars indicate mean ± SD from at least three independent experiments. Kruskal–Wallis test: *, P < 0.05; **, P < 0.01. C, Relative expression of CD80, CD86, CD163, and CD206 was analyzed by qPCR in M0-like macrophages treated with anti-CD99 0662 mAb or dAbd C7 for 1 to 6 hours. Data are expressed as the mean ± SD. Two-way ANOVA test: *, P < 0.05; **, P < 0.01; ***, P < 0.001. D, Multiplex cytokine assay analysis of IL1β, IL6, TNFα, and IL4 release in M0-like macrophages treated with anti-CD99 0662 mAb or dAbd C7 as indicated in the Materials and Methods. Data are expressed as mean ± SD of the fold increase versus control M0-like = 1. Two-way ANOVA test: *, P < 0.05; **, P < 0.01; ***, P < 0.001. E, Western blot analysis of intracellular signaling molecules in M0-like macrophages treated as indicated. GAPDH was used as the loading control. Representative blots from three independent experiments are shown.

References

    1. Pasello M, Manara MC, Scotlandi K. CD99 at the crossroads of physiology and pathology. J Cell Commun Signal 2018;12:55–68. - PMC - PubMed
    1. Grunewald TGP, Cidre-Aranaz F, Surdez D, Tomazou EM, de Alava E, Kovar H, et al. . Ewing sarcoma. Nat Rev Dis Primers 2018;4:5. - PubMed
    1. Rocchi A, Manara MC, Sciandra M, Zambelli D, Nardi F, Nicoletti G, et al. . CD99 inhibits neural differentiation of human Ewing sarcoma cells and thereby contributes to oncogenesis. J Clin Invest 2010;120:668–80. - PMC - PubMed
    1. Balestra T, Manara MC, Laginestra MA, Pasello M, De Feo A, Bassi C, et al. . Targeting CD99 compromises the oncogenic effects of the chimera EWS-FLI1 by inducing reexpression of zyxin and inhibition of GLI1 activity. Mol Cancer Ther 2022;21:58–69. - PubMed
    1. Manara MC, Pasello M, Scotlandi K. CD99: a cell surface protein with an oncojanus role in tumors. Genes 2018;9:159. - PMC - PubMed

Publication types