. 2024 Jan 23;9(2):e169512.
doi: 10.1172/jci.insight.169512.

Senotherapeutic drug treatment ameliorates chemotherapy-induced cachexia

Affiliations

Senotherapeutic drug treatment ameliorates chemotherapy-induced cachexia

Davis A Englund et al. JCI Insight. .

Abstract

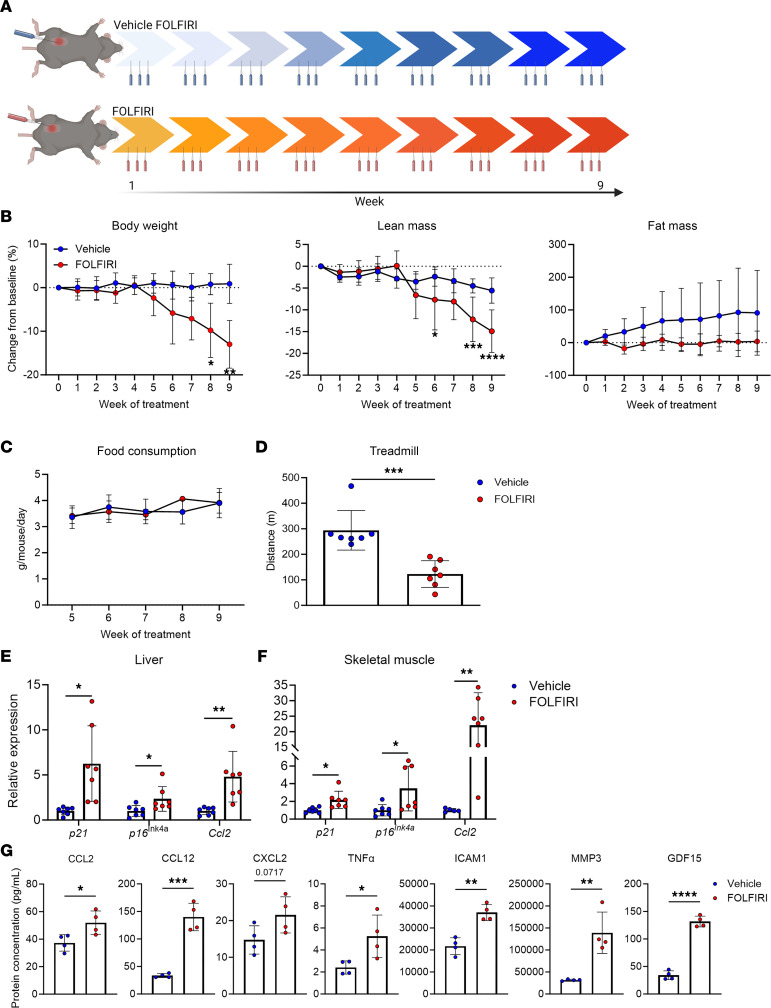
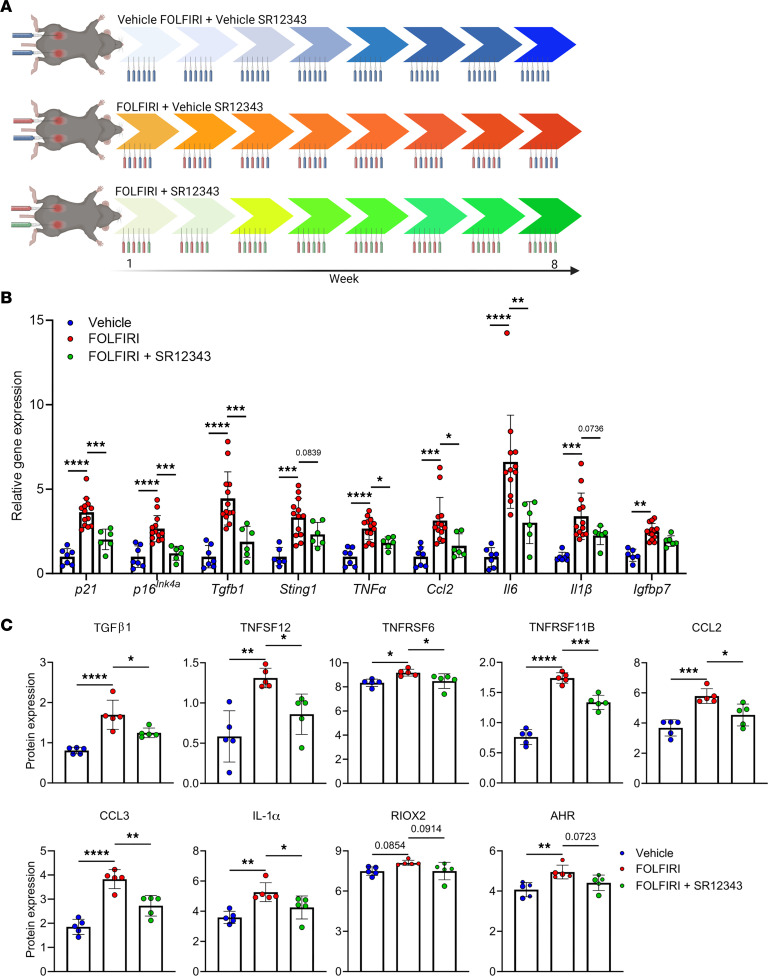
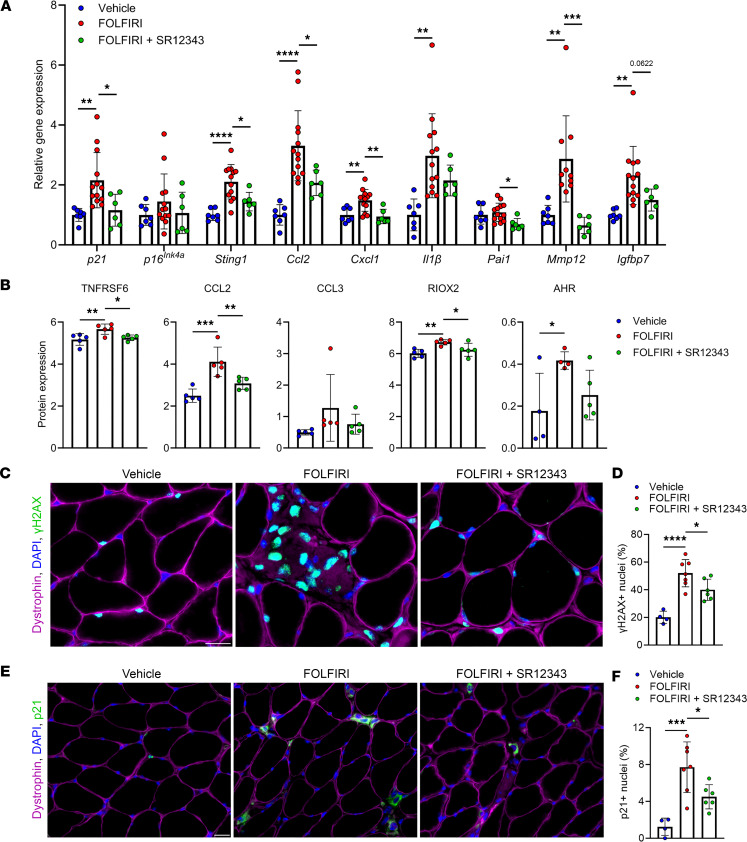
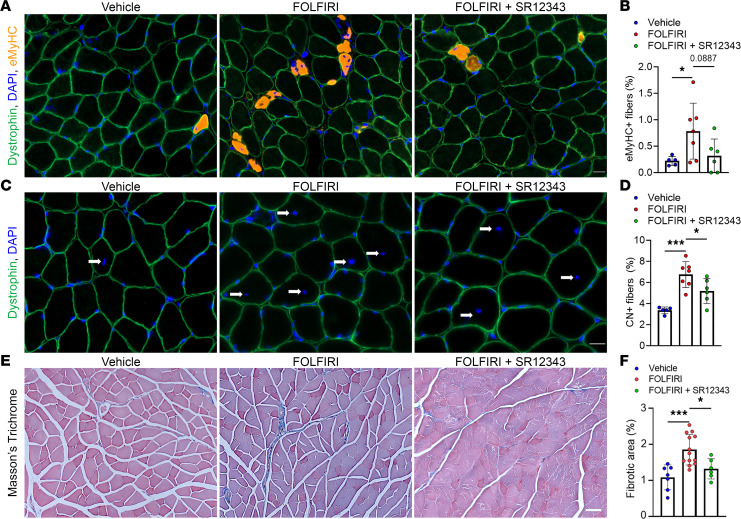
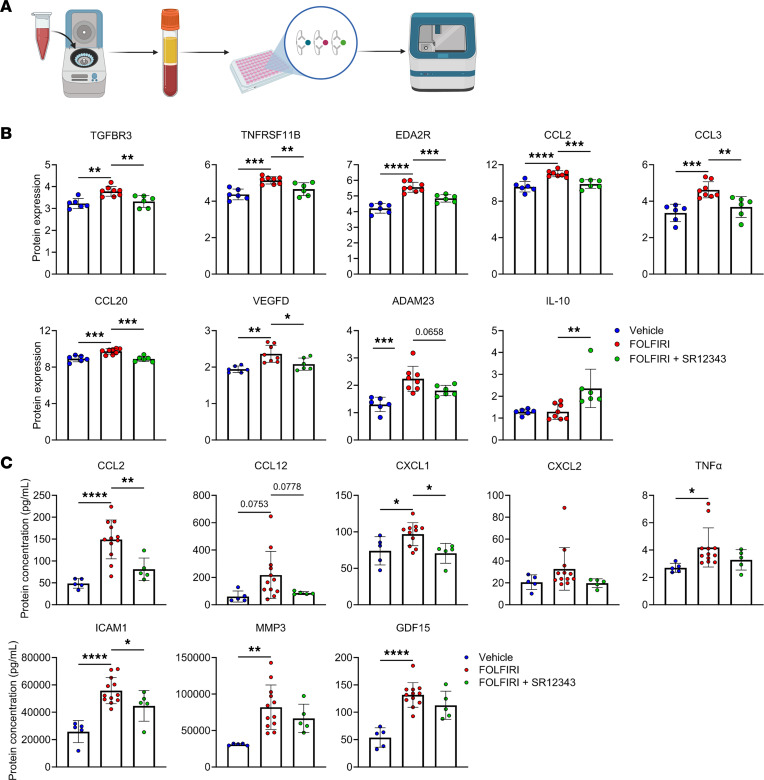
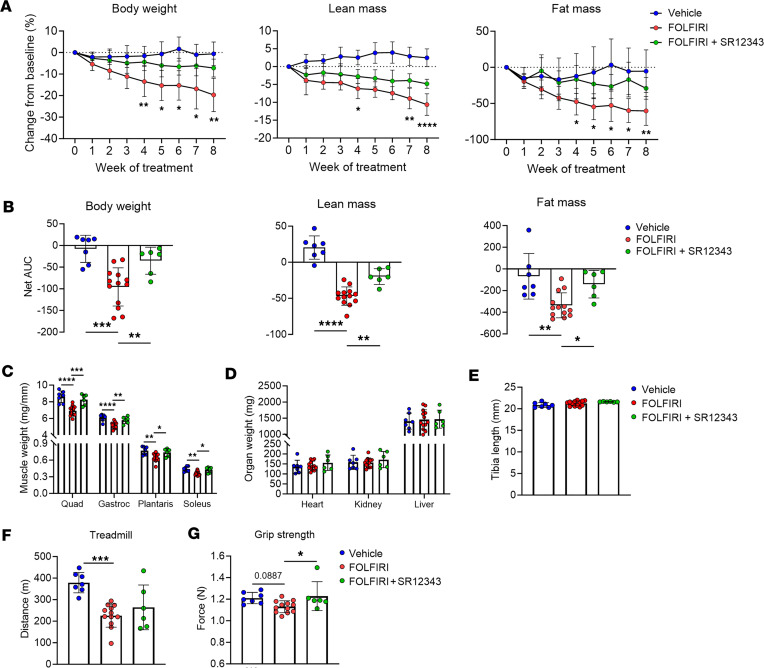
Cachexia is a debilitating skeletal muscle wasting condition for which we currently lack effective treatments. In the context of cancer, certain chemotherapeutics cause DNA damage and cellular senescence. Senescent cells exhibit chronic activation of the transcription factor NF-κB, a known mediator of the proinflammatory senescence-associated secretory phenotype (SASP) and skeletal muscle atrophy. Thus, targeting NF-κB represents a logical therapeutic strategy to alleviate unintended consequences of genotoxic drugs. Herein, we show that treatment with the IKK/NF-κB inhibitor SR12343 during a course of chemotherapy reduces markers of cellular senescence and the SASP in liver, skeletal muscle, and circulation and, correspondingly, attenuates features of skeletal muscle pathology. Lastly, we demonstrate that SR12343 mitigates chemotherapy-induced reductions in body weight, lean mass, fat mass, and muscle strength. These findings support senescent cells as a promising druggable target to counteract the SASP and skeletal muscle wasting in the context of chemotherapy.

Keywords: Cellular senescence; Inflammation; Muscle Biology; Skeletal muscle.


Conflict of interest statement

Conflict of interest: Mayo Clinic and NKL have intellectual property related to this work (PCT/US2021/037816). This research was reviewed by the Mayo Clinic Conflict of Interest Review Board and was conducted in compliance with Mayo Clinic conflict of interest policies.

Figures

Figure 1
Figure 1. FOLFIRI induces cachexia and hallmarks of cellular senescence and inflammation.
(A) Study design schematic: 4-month-old mice (n = 14) were treated with vehicle (F = 4, M = 3) or FOLFIRI (F = 3, M = 4) 3 times per week for 9 weeks. (B) Longitudinal measurements of body weight, lean mass, and fat mass. (C) Longitudinal measurements of food consumption. (D) Distance run-to-exhaustion on a treadmill test. (E and F) Senescence-associated markers in (E) liver and (F) skeletal muscle assessed by RT-qPCR. (G) Protein concentrations of circulating SASP factors measured with the Ella and MAGPIX multiplex platforms. Data represent mean ± SD. *P < 0.05; **P < 0.01; ***P < 0.001; ****P < 0.0001, as assessed by repeated measures 2-way ANOVA with Šidák’s correction (B and C) or unpaired 2-tailed Student’s t test (DF).
Figure 2
Figure 2. SR12343 reduces the expression of proinflammatory genes and proteins.
(A) Study design schematic: 7- to 10-month-old mice (n = 26) were treated with vehicle (F = 3, M = 4), FOLFIRI (F = 5, M = 8), or FOLFIRI and SR12343 (F = 3, M = 3) 3 times per week for 8 weeks. (B and C) Markers of inflammation and cellular senescence in liver assessed by (B) RT-qPCR and the (C) Olink multiplex immunoassay. Data represent mean ± SD. *P < 0.05; **P < 0.01; ***P < 0.001; ****P < 0.0001, as assessed by 1-way ANOVA with Šidák’s correction.
Figure 3
Figure 3. SR12343 suppresses markers of senescence in skeletal muscle.
(A and B) Markers of cellular senescence and inflammation in skeletal muscle assessed by (A) RT-qPCR and the (B) Olink multiplex immunoassay. (C) Representative immunofluorescence images of skeletal muscle cross sections stained with anti-dystrophin, DAPI, and anti-γH2AX. Scale bar: 20 μm. (D) Quantification of the percentage of γH2AX+ myonuclei. (E) Representative immunofluorescence images of skeletal muscle cross sections stained with anti-dystrophin, DAPI, and anti-p21. Scale bar: 20 μm. (F) Quantification of the percentage of p21+ nuclei. Data represent mean ± SD. *P < 0.05; **P < 0.01; ***P < 0.001; ****P < 0.0001, as assessed by 1-way ANOVA with Šidák’s correction.
Figure 4
Figure 4. SR12343 is protective against signs of skeletal muscle pathogenesis.
(A) Representative immunofluorescence images of skeletal muscle cross sections stained for dystrophin, embryonic myosin heavy chain (eMyHC), and with DAPI. Scale bar: 20 μm. (B) Quantification of the percentage of eMyHC+ muscle fibers. (C) Representative immunofluorescence images of skeletal muscle cross sections stained with anti-dystrophin and DAPI. Scale bar: 20 μm. (D) Quantification of the percentage of centrally nucleated (CN) muscle fibers. (E) Representative Masson’s trichrome–stained skeletal muscle cross sections. Arrows indicate centrally located nuclei. Scale bar: 50 μm. (F) Quantification of the relative area positive for fibrosis. Data represent mean ± SD. *P < 0.05; ***P < 0.001, as assessed by 1-way ANOVA with Šidák’s correction.
Figure 5
Figure 5. SR12343 diminishes a FOLFIRI-induced proinflammatory circulatory profile.
(A) Schematic showing the steps involved in quantifying plasma proteins. (B and C) Circulating markers of inflammation and the SASP assessed by the (B) Olink multiplex immunoassay and (C) Ella and MAGPIX multiplex platforms. Data represent mean ± SD. *P < 0.05; **P < 0.01; ***P < 0.001; ****P < 0.0001, as assessed by 1-way ANOVA with Šidák’s correction.
Figure 6
Figure 6. SR12343 is protective against the hallmarks of cachexia.
(A) Longitudinal measurements of body weight, lean mass, and fat mass. (B) Net area under the curve (AUC) quantified for body weight, lean mass, and fat mass. (C) Quadriceps (Quad), gastrocnemius (Gastroc), plantaris, and soleus weights. (D) Organ weights. (E) Tibia length. (F) Distance run-to-exhaustion on a treadmill test. (G) Grip strength test. Data represent mean ± SD. *P < 0.05; **P < 0.01; ***P < 0.001; ****P < 0.0001, as assessed by repeated measures 2-way ANOVA with Tukey’s correction (A) or 1-way ANOVA with Šidák’s correction (BG).

References

    1. Tisdale MJ. Cachexia in cancer patients. Nat Rev Cancer. 2002;2(11):862–871. doi: 10.1038/nrc927. - DOI - PubMed
    1. Langstein HN, et al. The roles of gamma-interferon and tumor necrosis factor alpha in an experimental rat model of cancer cachexia. Cancer Res. 1991;51(9):2302–2306. - PubMed
    1. Strassmann G, et al. Evidence for the involvement of interleukin 6 in experimental cancer cachexia. J Clin Invest. 1992;89(5):1681–1684. doi: 10.1172/JCI115767. - DOI - PMC - PubMed
    1. Rupert JE, et al. Tumor-derived IL-6 and trans-signaling among tumor, fat, and muscle mediate pancreatic cancer cachexia. J Exp Med. 2021;218(6):e20190450. doi: 10.1084/jem.20190450. - DOI - PMC - PubMed
    1. Bekaii-Saab T, et al. Multi-institutional phase II study of selumetinib in patients with metastatic biliary cancers. J Clin Oncol. 2011;29(17):2357–2363. doi: 10.1200/JCO.2010.33.9473. - DOI - PMC - PubMed

Publication types