. 2023 Dec 5;134(4):e172963.
doi: 10.1172/JCI172963.

ACSS2 gene variants determine kidney disease risk by controlling de novo lipogenesis in kidney tubules

Affiliations

ACSS2 gene variants determine kidney disease risk by controlling de novo lipogenesis in kidney tubules

Dhanunjay Mukhi et al. J Clin Invest. .

Abstract

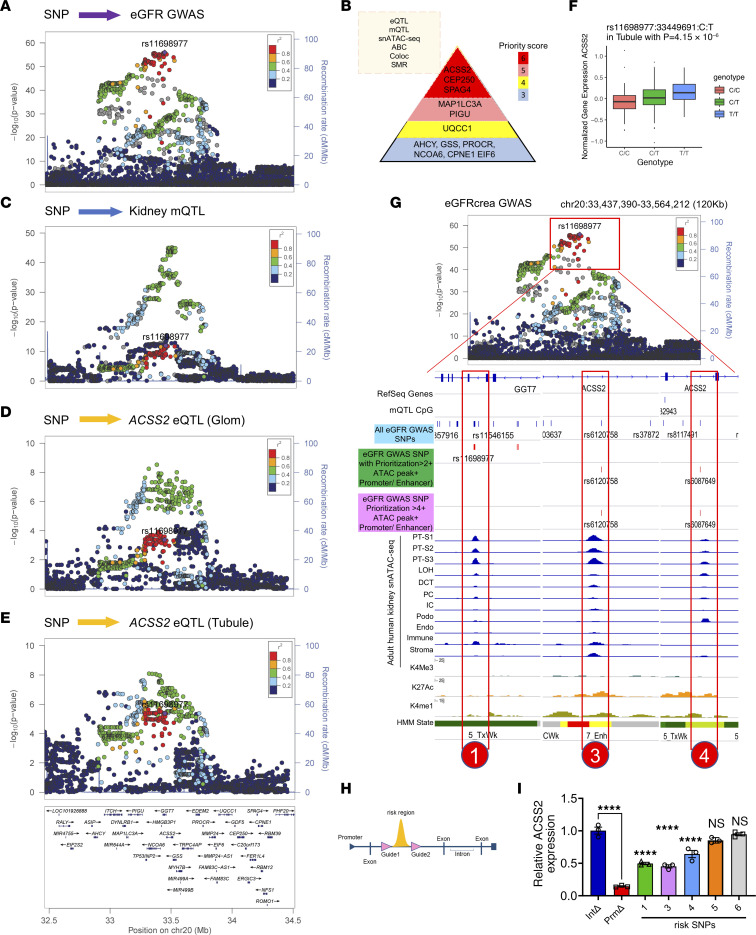
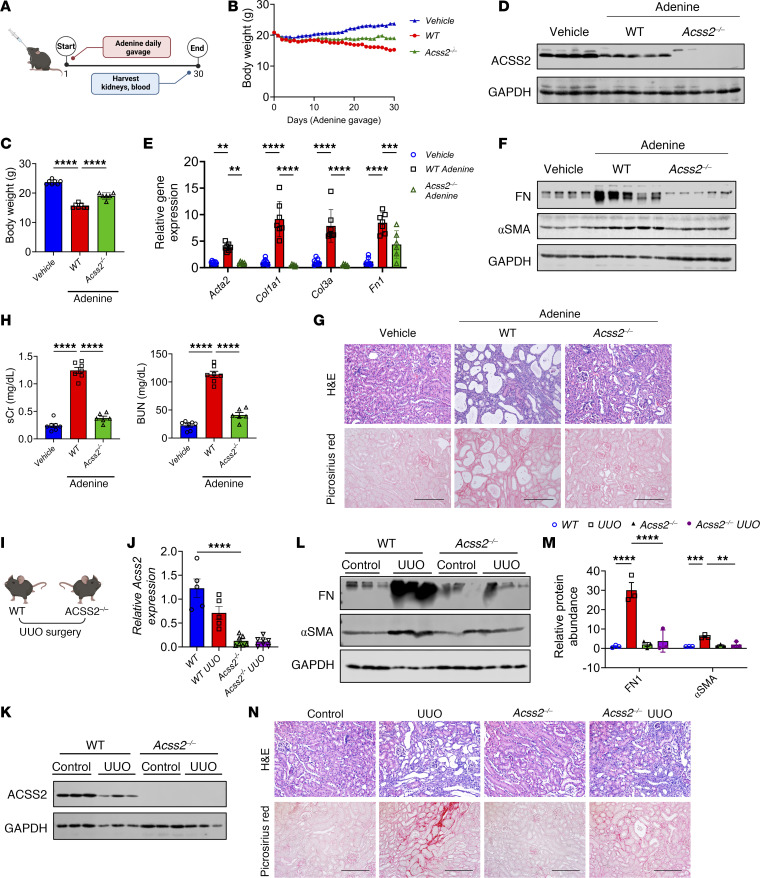
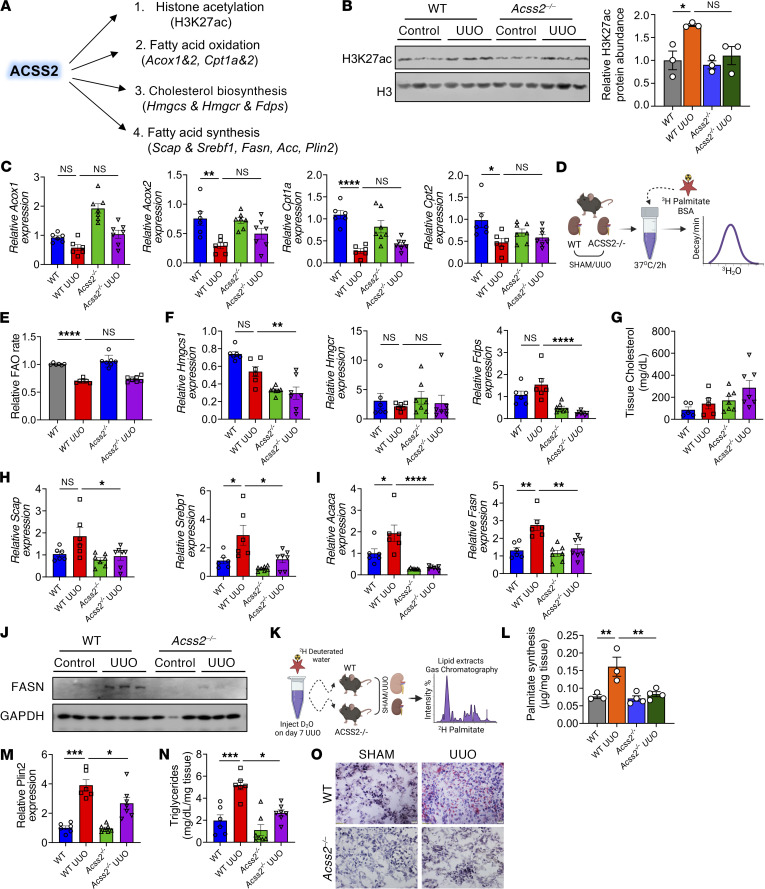
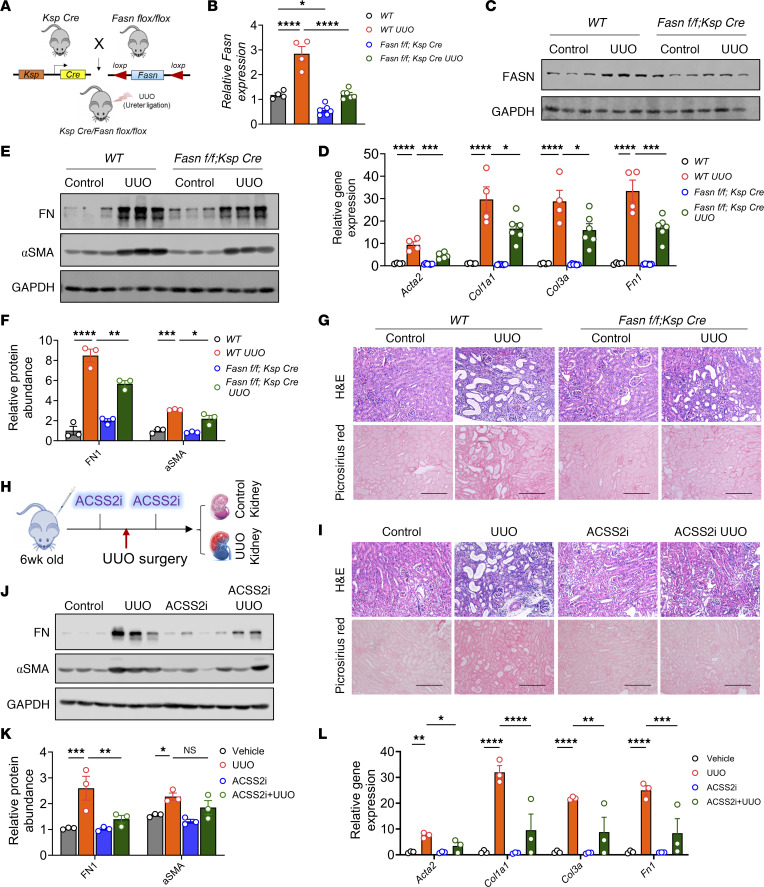
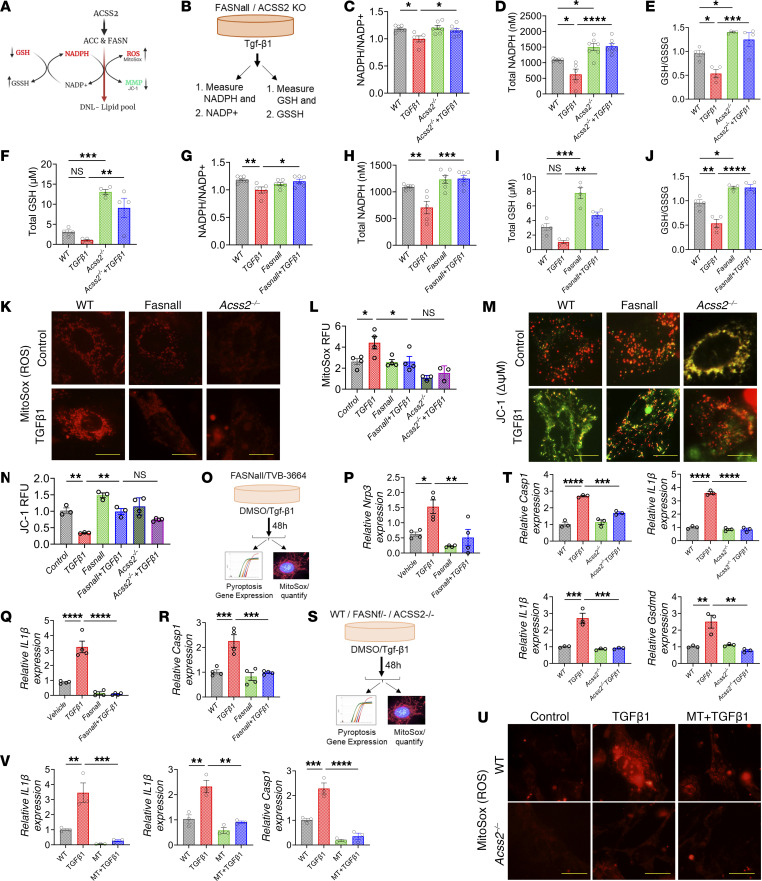
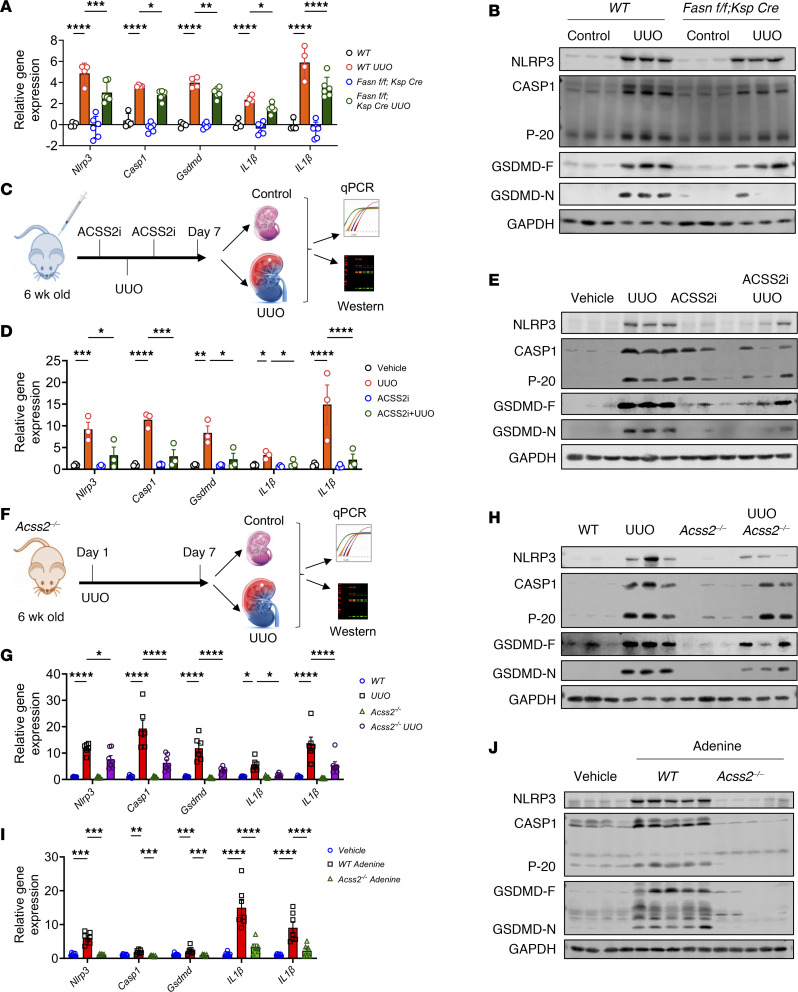
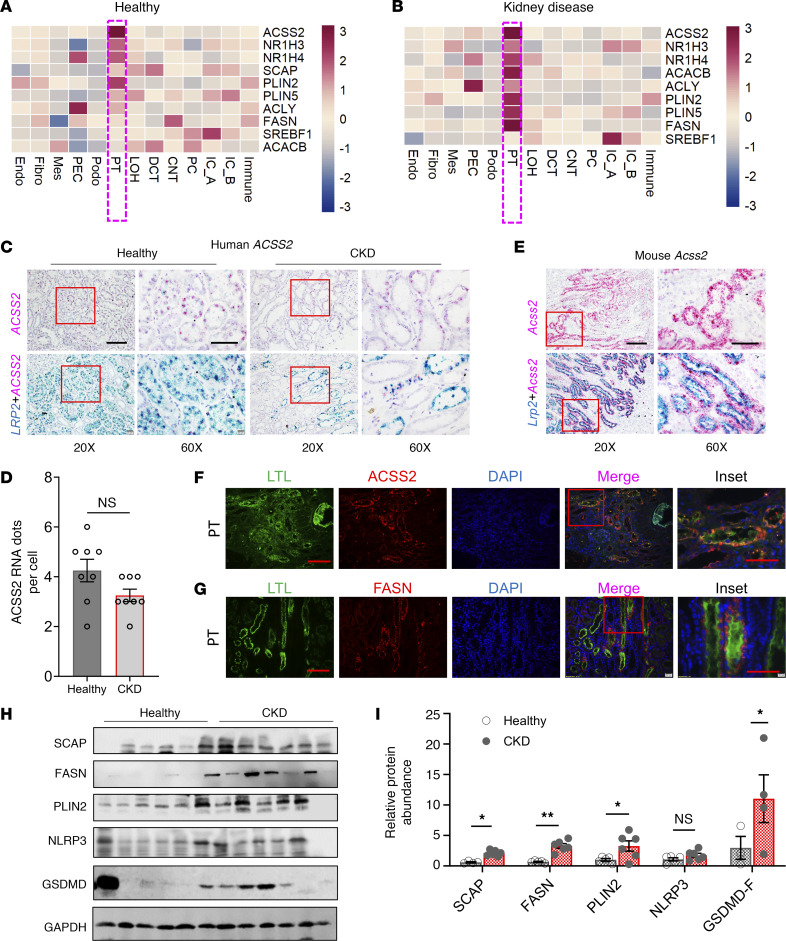
Worldwide, over 800 million people are affected by kidney disease, yet its pathogenesis remains elusive, hindering the development of novel therapeutics. In this study, we used kidney-specific expression of quantitative traits and single-nucleus open chromatin analysis to show that genetic variants linked to kidney dysfunction on chromosome 20 target the acyl-CoA synthetase short-chain family 2 (ACSS2). By generating ACSS2-KO mice, we demonstrated their protection from kidney fibrosis in multiple disease models. Our analysis of primary tubular cells revealed that ACSS2 regulated de novo lipogenesis (DNL), causing NADPH depletion and increasing ROS levels, ultimately leading to NLRP3-dependent pyroptosis. Additionally, we discovered that pharmacological inhibition or genetic ablation of fatty acid synthase safeguarded kidney cells against profibrotic gene expression and prevented kidney disease in mice. Lipid accumulation and the expression of genes related to DNL were elevated in the kidneys of patients with fibrosis. Our findings pinpoint ACSS2 as a critical kidney disease gene and reveal the role of DNL in kidney disease.

Keywords: Chronic kidney disease; Fibrosis; Genetics; Nephrology.


Conflict of interest statement

Conflict of interest: The Susztak laboratory is supported by Boehringer Ingelheim, Regeneron, GSK, Merck, ONO Pharma, Astra Zeneca, Gilead, and Genentech.

Figures

Figure 1
Figure 1. Prioritization of ACSS2 as a kidney disease gene from GWAS.
(A) Regional plot showing SNPs associated with kidney eGFR GWAS (n = 1,508,569 individuals). The x axis shows the chromosomal location, and the y axis shows the strength of association [–log(P)] on chromosome 20. The locus top variants (rs11698977) tagging the independent signal closest to ACSS2 gene was selected as the index variant to calculate the linkage disequilibrium (LD) correlation coefficient (r2), with other variants in the locus shown by blue dots (lower r2) and red dots (higher r2). (B) Gene prioritization strategy (top left). Genes with gene priority scores higher than 3 at the chromosome 20 eGFR GWAS locus (right). The color indicates the priority score. Coloc, colocalization. (C) Regional plot of SNPs associated with kidney tubule cytosine methylation levels (mQTL) (n = 443). The x axis shows chromosomal location, and the y axis shows the strength of association [–log(P)]. (D) Regional plot for SNPs associated with ACSS2 expression in kidney glomeruli (n = 303). The x axis shows the chromosomal location, and the y axis shows the strength of association [–log(P)]. (E) Regional plot for SNPs associated with kidney tubule ACSS2 expression (n = 356). The x axis shows the chromosomal (chr) location, and the y axis shows the strength of association [–log(P)]. (F) Human kidney ACSS2 gene expression in tubules (n = 356) in microdissected samples. The y axis shows normalized ACSS2 expression, and the x axis shows genotype information. (G) Upper panel: Locus zoom plot of eGFRcrea GWAS associations (n = 1,508,659 individuals; the same is shown in A) in the ACSS2 locus. Lower panel: Epigenetic information on the ACSS2 locus in human kidney samples including mQTL SNPs; all eGFR GWAS SNPs (blue) followed by eGFR GWAS SNPs with a priority score of greater than 2 (dark green); eGFRcrea GWAS SNPs with a priority score of greater than 4 (magenta); adult human kidney open chromatin information for each cell type; and histone modifications (H34me3, H3K27ac, and H3K4me1) from human kidney ChIP-Seq and chromatin states predicted by ChromHMM. PT-S1, PT segment S1; LOH, loop of Henle; DCT, distal convoluted tubule; PC, collecting duct principal cells; IC, collecting duct intercalated cells; Podo, podocytes; Endo, endothelial cells; Immune, immune cells; Stroma, stromal fraction. (H) Scheme of CRISPR-mediated genomic region deletion. (I) Transcript levels of ACSS2 following deletion of the genetic risk locus containing SNPs 1, 3, 4, 5, and 6. Int, intron; Prm, promoter. Data are presented as the mean ± SEM. ****P < 0.0001, by 1-way ANOVA after Tukey’s multiple-comparison test.
Figure 2
Figure 2. Genetic deletion of ACSS2 protects against kidney disease.
(A) Experimental outline. (B) Daily body weights of vehicle- (n = 7) or adenine-treated (oral gavage) WT (n = 7) and Acss2–/– (n = 6) mice. (C) Final body weights of WT (n = 7) and Acss2–/– (n = 6) mice gavaged with adenine or vehicle (n = 7). (D) Immunoblots of ACSS2 and GAPDH expression in kidneys of vehicle-treated (n = 4) or adenine-treated WT (n = 5) and Acss2–/– (n = 5) mice. (E) Transcript levels of αSMA (Acta2), Col1a1, Col3a, and Fn1 in kidneys of vehicle-treated (n = 7) or adenine-treated WT (n = 7) and Acss2–/– (n = 6) mice. (F) Immunoblots of FN1, αSMA, and GAPDH in whole-kidney lysates of vehicle- or adenine-treated WT (n = 5) and Acss2–/– (n = 5) mice (n = 4). (G) H&E and Picrosirius red staining of kidney sections from vehicle- or adenine-treated WT and Acss2–/– mice. Scale bars: 20 μm. (H) sCr and BUN in vehicle- or adenine-treated WT and Acss2–/– mice. (I) Experimental outline. (J) Transcript levels of Acss2 in kidneys of WT (n = 5) and Acss2–/– (n = 7) mice following UUO surgery. (K) Immunoblots of ACSS2 and GAPDH in UUO or sham-operated kidneys from WT and Acss2–/– mice. (L) Immunoblots showing FN1, αSMA, and GAPDH expression in kidneys of WT and Acss2–/– mice following UUO or sham surgery. (M) Quantification of immunoblots of FN1, and αSMA by ImageJ (NIH). (N) H&E- and Picrosirius red–stained images of kidneys from WT and Acss2–/– mice subjected to UUO surgery. Scale bars: 20 μm. Data are presented as the mean ± SEM. P values were determined by 1-way ANOVA after Tukey’s multiple-comparison test (CM). **P < 0.01, ***P < 0.001, and ****P < 0.0001. Data in JN are representative of multiple experiments. Protein marker was cropped from all blots but was presented in full blots file.
Figure 3
Figure 3. Kidney ACSS2 expression correlates with changes in genes in DNL.
(A) Biochemical functions of ACSS2. (B) Immunoblots of H3K27ac and H3 protein levels in total histones extracted from kidneys of WT and Acss2–/– mice subjected to UUO or sham surgery (left). Quantification of H3K27ac levels by ImageJ (right). (C) Transcript levels of Acox1, Acox2, Cpt1a, and Cpt2 in kidneys of WT (n = 6) and Acss2–/– (n = 7) mice with and without UUO. (D) FAO experimental scheme. (E) FAO rate in WT (n = 6) and Acss2–/– (n = 7) mice with and without UUO surgery. (F) Transcript levels of Hmgcs1, Hmgcr, and Fdps in kidneys of WT (n = 6) and Acss2–/– (n = 7) mice with and without UUO surgery. (G) Total cholesterol in whole kidneys of WT (n = 5) and Acss2–/– (n = 7) mice following UUO. (H) Transcript levels of Scap and Srebp1 in kidneys of WT (n = 6) and Acss2–/– (n = 7) mice following UUO. (I) Transcript levels of Fasn and Acaca in kidneys of WT (n = 6) and Acss2–/– (n = 7) mice following UUO. (J) Immunoblots of FASN and GAPDH expression in whole kidneys of WT and Acss2–/– mice with UUO. (K) Measurement of DNL. (L) DNL rate in WT (n = 3) and Acss2–/– (n = 4) mice with and without UUO. (M) Transcript levels of Plin2 in kidneys of WT (n = 6) and Acss2–/– (n = 7) mice with UUO. (N) Kidney TG levels in WT (n = 6) and Acss2–/– (n = 7) mice with UUO. (O) Oil Red O staining in kidneys of WT and Acss2–/– mice with UUO. Scale bars: 10 μm. Data are presented as the mean ± SEM. *P < 0.05, **P < 0.01, ***P < 0.001, and ****P < 0.0001, by 1-way ANOVA after Tukey’s multiple-comparison test (BN). The protein marker was cropped from all blots but is presented in the full blots file.
Figure 4
Figure 4. Tubule cell–specific deletion of FASN or pharmacological inhibition of ACSS2 protects against kidney disease.
(A) Experimental design. (B) Transcript levels of Fasn (n = 4, WT; n = 6, Fasnfl/fl Ksp Cre). (C) Immunoblots of FASN and GAPDH levels in Fasnfl/fl Ksp Cre and WT mice. (D) Transcript levels of Acta2, Col1a1, Col3a, and Fn1 in kidneys of Fasnfl/fl Ksp Cre (n = 6) and WT (n = 4) mice. (E) Immunoblots showing FN1, αSMA, and GAPDH levels in kidneys of Fasnfl/fl Ksp Cre and WT mice following UUO. (F) Quantification of FN1 and αSMA immunoblots by ImageJ. (G) H&E and Picrosirius red staining of UUO kidneys from Fasnfl/fl Ksp Cre and WT mice (left). Fibrosis was quantified using ImageJ (right). Scale bars: 20 μm. (H) ACSS2i experimental design. (I) H&E and Picrosirius red staining of UUO kidneys from mice injected or not with ACSS2i. Scale bars: 20 μm. (J) Immunoblots showing FN1, αSMA, and GAPDH levels in kidneys of mice injected with ACSS2i that are subjected to UUO. (K) Quantification of FN1 and αSMA immunoblots by ImageJ. (L) Transcript levels of Acta2, Col1a1, Col3a, and Fn1 in UUO kidneys of mice injected with ACSS2i (n = 3) or PBS (n = 3). Data are presented as the mean ± SEM. *P < 0.05, **P < 0.01, ***P < 0.001, and ****P < 0.0001, by 1-way ANOVA after Tukey’s multiple-comparison test (B, D, F, K, and L). Data in BG are representative of multiple experiments. The protein marker was cropped from all blots but is presented in the full blots file.
Figure 5
Figure 5. DNL in kidney tubules is associated with higher mtROS.
(A) Fatty acid synthesis requires a large amount of NADPH, leading to elevated ROS levels in the kidneys. MMP, mitochondria membrane potential. (B) Experimental hypothesis. (C) NADPH+/NDP+ ratio in tubule cells treated with TGF-β1. (D) Total NADPH levels in Acss2–/– cells treated with TGF-β1. (E) GSH/GSSG ratio in Acss2–/– cells treated with TGF-β1. (F) Total GSH levels in Acss2–/– cells treated with TGF-β1. (G) NADPH+/NDP+ ratio in cells treated with TGF-β1 and FASNall. (H) Total NADPH levels in cells treated with TGF-β1 and FASNall. (I) Total GSH levels in cells treated with TGF-β1 and FASNall. (J) GSH/GSSG ratio in cells treated with TGF-β1 and FASNall. (K) MitoSox staining in WT, Acss2–/–, and FASNall-cells treated with TGF-β1. Scale bars: 10 μm. (L) Quantification of MitoSox fluorescence. (M) JC-1 staining of WT, Acss2–/–, and FASNall cells treated with TGF-β1. Scale bars: 10 μm. (N) Quantification of JC-1 (red/green ratio) fluorescence. RFU, relative fluorescence units. (O) Experimental scheme. (P) Transcript levels of Nlrp3 in tubule cells treated with FASNall and TGF-β1. (Q) Transcript levels of IL1B in tubule cells treated with FASNall and/or TGF-β1. (R) Transcript levels of Casp1 in tubule cells treated with FASNall and/or TGF-β1. (S) Experimental scheme. (T) Transcript levels of Casp1, IL1B, IL18, and Gsdmd in Acss2–/– tubule cells treated with TGF-β1. (U) MitoSox staining and (V) transcript levels of IL1B, IL18, and Casp1 in Acss2–/– tubular cells treated with TGF-β1 and/or MT. Scale bars: 10 μm. Data are presented as the mean ± SEM. Each experiment was repeated at least twice, and the data presented in this figure are representative of multiple experiments. *P < 0.05, **P < 0.01, ***P < 0.001, and ****P < 0.0001, by 1-way ANOVA after Tukey’s multiple-comparison test (CV).
Figure 6
Figure 6. Genetic deletion or pharmacological inhibition of FASN or ACSS2 attenuates inflammasome activation.
(A) Transcript levels of Nlrp3, IL1B, IL18, and Gsdmd in control and UUO kidneys of Fasnfl/fl Ksp Cre (n = 6) and WT (n = 4) mice. (B) Immunoblots of NLRP3, CASP1, P20 (cleaved caspase 1), GSDMD-F, GSDMD-N, and GAPDH expression in UUO kidneys from WT and Fasnfl/fl Ksp Cre mice. (C) Experimental design. (D) Transcript levels of Nlrp3, IL1B, IL18, and Gsdmd in UUO kidneys of mice injected with ACSS2i (n = 3) or vehicle (n = 3). (E) Immunoblots showing NLRP3, CASP1, P20, GSDMD-F, GSDMD-N, and GAPDH expression in UUO kidneys from mice injected with vehicle (n = 3) or ACSS2i (n = 3). (F) Experimental design. (G) Transcript levels of Nlrp3, IL1B, IL18, and Gsdmd in WT (n = 6) and Acss2–/– (n = 7) mice following UUO surgery. (H) Immunoblots showing NLRP3, CASP1, P20, GSDMD-F, GSDMD-N, and GAPDH expression in UUO kidneys from WT and Acss2–/– mice. (I) Transcript levels of Nlrp3, IL1B, IL18, and Gsdmd in adenine-treated CKD kidneys from WT (n = 7) and Acss2–/– (n = 6) mice. (J) Immunoblots showing NLRP3, CASP1, P20, GSDMD-F, GSDMD-N, and GAPDH expression in adenine-treated CKD kidneys from WT and Acss2–/– mice. Data are presented as the mean ± SEM. *P < 0.05, **P < 0.01, ***P < 0.001, and ****P < 0.0001, by 1-way ANOVA after Tukey’s multiple-comparison test (A, D, G, and I). Data in A were log2 transformed. The protein marker was cropped from all blots but is presented in the full blots file.
Figure 7
Figure 7. Changes in DNL gene expression in the kidneys of patients with CKD.
(A) Relative gene expression z scores for ACSS2, NR1H3, NR1H4, SREBF1, SCAP, PLIN2, PLIN5, ACACAB, ACLY, and FASN in healthy human kidney snRNA-Seq data. PEC, parietal epithelial cells; Mes, mesangial cells; IC_A, intercalated cells A; IC_B, intercalated cells B. (B) Gene expression z score for ACSS2, NR1H3, NR1H4, SREBF1, SCAP, PLIN2, PLIN5, ACACAB, ACLY, and FASN from human CKD kidney snRNA-Seq in various kidney cell types. (C) ISH of human ACSS2 and LRP2 in healthy and CKD human kidneys. Original magnification, ×20 (scale bar: 20 μm) and ×60 (scale bar: 10 μm). (D) Quantification of RNA ISH (n = 4). (E) ISH of mouse Acss2 and Lrp2 in healthy mouse kidney samples. Original magnification, ×20 (scale bar: 20 μm) and ×60 (scale bar: 10 μm). (F) Immunofluorescence images of ACSS2 expression in healthy human kidneys. LTL identifies the PT segment. Scale bars: 20 μm and 10 μm (inset). (G) Immunofluorescence images of FASN expression in healthy human kidneys. LTL identifies the PT segment. Scale bars: 20 μm and 10 μm (inset). (H) Immunoblots showing SCAP, FASN, PLIN2, NLRP3, and GSDMD expression in healthy and CKD kidneys (n = 6). (I) Quantification of immunoblots. Data were normalized to GAPDH and are presented as the mean ± SEM. In the healthy group, the sixth sample was excluded from statistical analysis because of its disease-like characteristics. The first sample from the healthy group was excluded from the SCAP analysis. Only 3 healthy samples and 4 CKD samples were included in the GSMD statistical analysis due to high variability. *P < 0.05 and **P < 0.01, by 1-way ANOVA after Tukey’s multiple-comparison test (D and I). The protein marker was cropped from all blots but is presented in the full blots file.

Comment in

References

    1. Obrador GT, et al. Genetic and environmental risk factors for chronic kidney disease. Kidney Int Suppl (2011) 2017;7(2):88–106. doi: 10.1016/j.kisu.2017.07.004. - DOI - PMC - PubMed
    1. Bikbov B, et al. Global, regional, and national burden of chronic kidney disease, 1990-2017: a systematic analysis for the Global Burden of Disease Study 2017. Lancet. 2020;395(10225):709–733. doi: 10.1016/S0140-6736(20)30045-3. - DOI - PMC - PubMed
    1. Tian Z, Liang M. Renal metabolism and hypertension. Nat Commun. 2021;12(1):963. doi: 10.1038/s41467-021-21301-5. - DOI - PMC - PubMed
    1. Mukhi D, et al. Novel actions of growth hormone in podocytes: implications for diabetic nephropathy. Front Med (Lausanne) 2017;4:102. doi: 10.3389/fmed.2017.00102. - DOI - PMC - PubMed
    1. Herman-Edelstein M, et al. Altered renal lipid metabolism and renal lipid accumulation in human diabetic nephropathy. J Lipid Res. 2014;55(3):561–572. doi: 10.1194/jlr.P040501. - DOI - PMC - PubMed

Publication types