. 2024 Feb 1;134(3):e169225.
doi: 10.1172/JCI169225.

Single-cell sequencing reveals Hippo signaling as a driver of fibrosis in hidradenitis suppurativa

Affiliations

Single-cell sequencing reveals Hippo signaling as a driver of fibrosis in hidradenitis suppurativa

Kelsey R van Straalen et al. J Clin Invest. .

Abstract

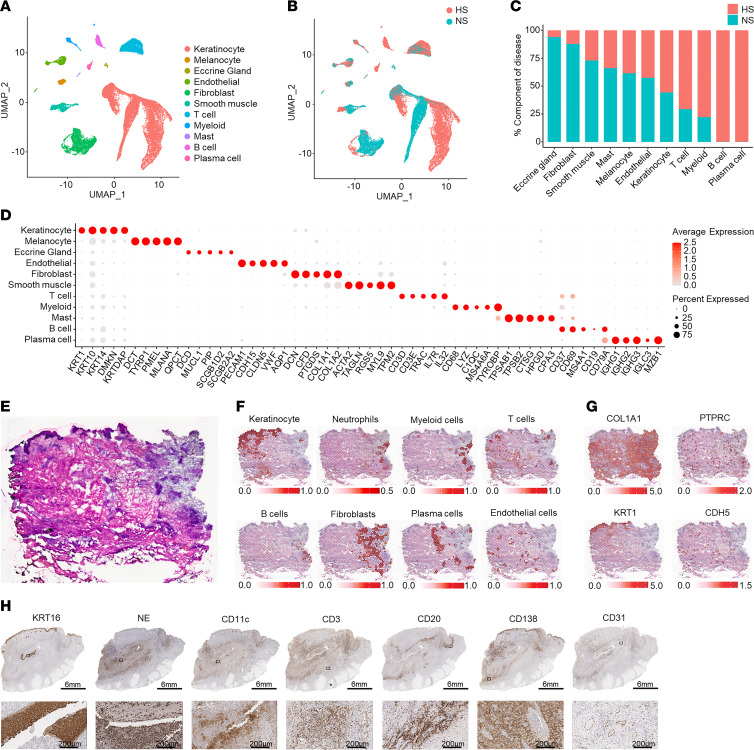
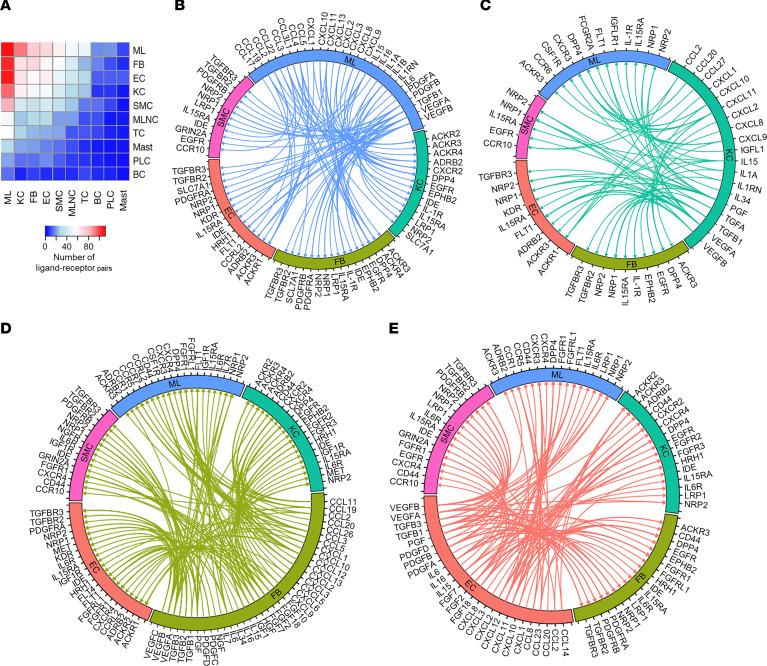
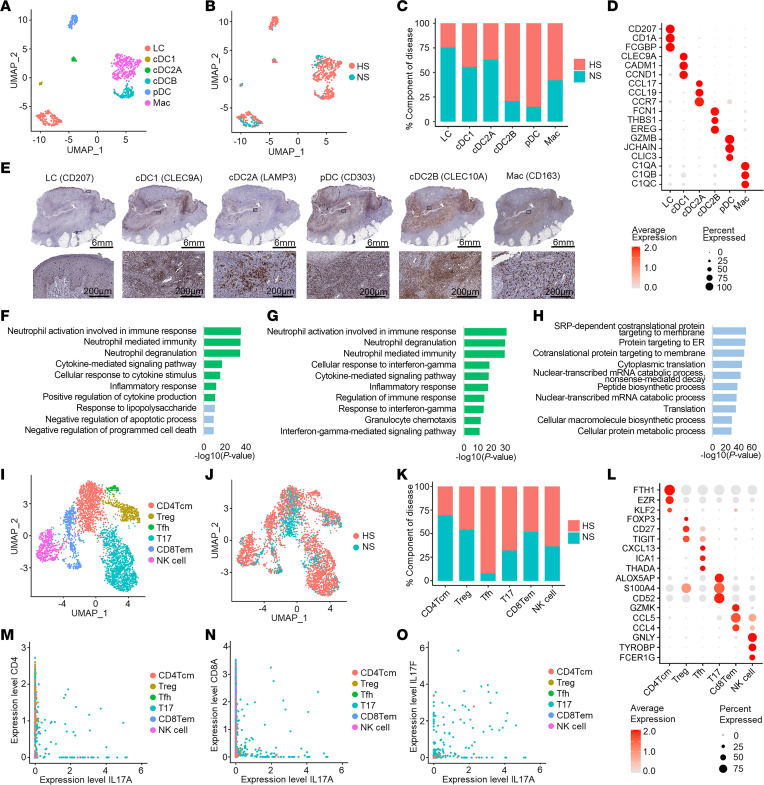
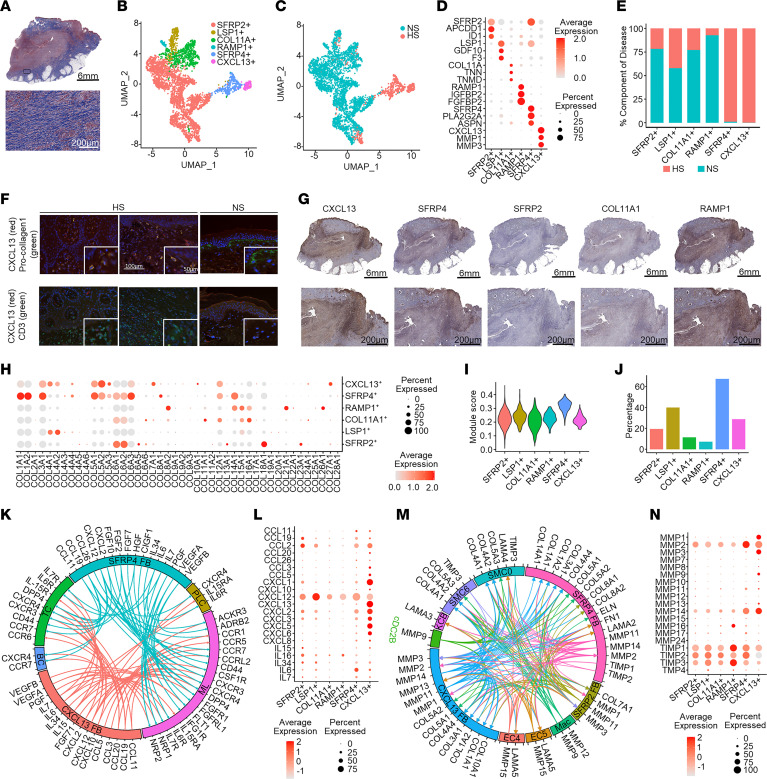
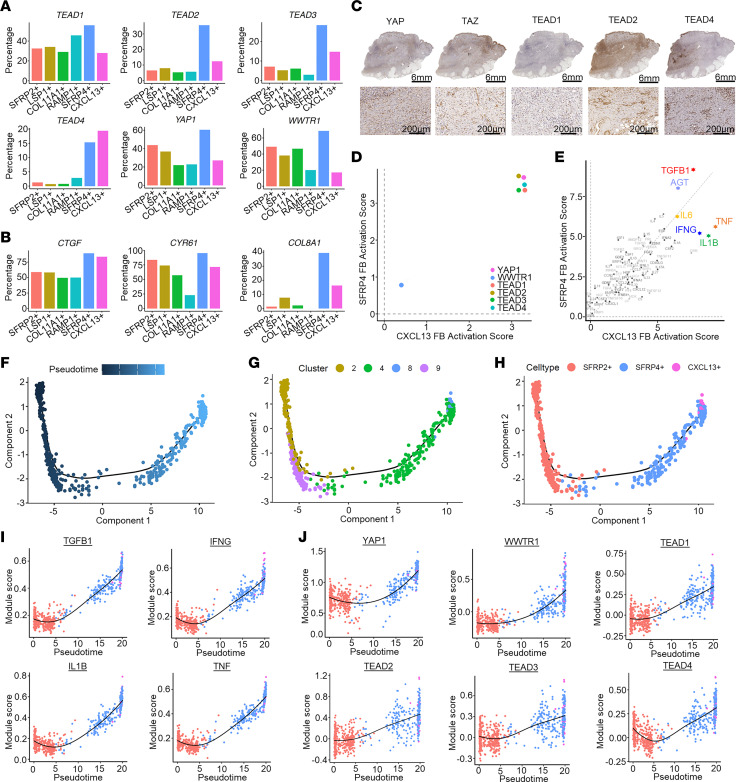
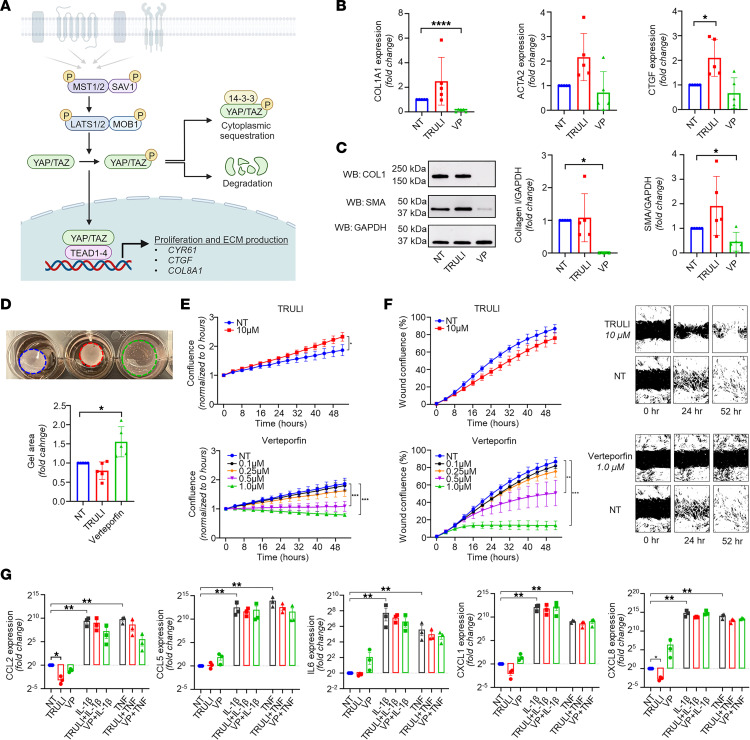
Hidradenitis suppurativa (HS) is a chronic inflammatory disease characterized by abscesses, nodules, dissecting/draining tunnels, and extensive fibrosis. Here, we integrate single-cell RNA sequencing, spatial transcriptomics, and immunostaining to provide an unprecedented view of the pathogenesis of chronic HS, characterizing the main cellular players and defining their interactions. We found a striking layering of the chronic HS infiltrate and identified the contribution of 2 fibroblast subtypes (SFRP4+ and CXCL13+) in orchestrating this compartmentalized immune response. We further demonstrated the central role of the Hippo pathway in promoting extensive fibrosis in HS and provided preclinical evidence that the profibrotic fibroblast response in HS can be modulated through inhibition of this pathway. These data provide insights into key aspects of HS pathogenesis with broad therapeutic implications.

Keywords: Cytokines; Dermatology; Fibrosis; Inflammation; Skin.


Conflict of interest statement

Conflict of interest: MC is an employee of Almirall SA. MN conducts research for Anaptysbio, Argenx, Bristol Myers Squibb, Galderma, Pfizer, and Regeneron. KW has received research grants, consulting honoraria, or lecturer’s honoraria from AbbVie, Novartis Pharma, Sanofi-Aventis, and MoonLake Immunotherapeutics. RS has received research grants from, scientific awards from, or honoraria for participation in advisory boards or clinical trials from or as speaker for one or more of the following: AbbVie, Bayer, Boehringer Ingelheim Pharma, CSL Behring, ICON, Incyte, Janssen-Cilag, La Roche-Posay Laboratoire Dermatologique, MoonLake Immunotherapeutics, Novartis Pharma, Parexel, Sanofi-Aventis, and UCB Pharma. JMK has received grants from Janssen, Bristol Myers Squibb, Q32 Bio, ROME Therapeutics, and Ventus Therapeutics and participated in consulting/advisory boards for Bristol Myers Squibb, AstraZeneca, EMD Serano, Ventus Therapeutics, Eli Lilly, GlaxoSmithKline, Lupus Therapeutics, and Gilead.

Figures

Figure 1
Figure 1. Cell types observed in HS lesional skin and their spatial locations.
(A) UMAP plot showing 31,746 cells colored by cell type. (B) UMAP plot showing the cells colored by disease condition. HS, hidradenitis suppurativa; NS, normal skin from healthy controls. (C) Bar chart showing the cell types as percentage component of disease. (D) Dot plot showing 5 representative marker genes for each cell type. The color scale represents the scaled expression average of each gene. The size of the dot represents the percentage of cells expressing each gene. (E) H&E staining of the biopsy used for spatial transcriptomics. (F) Spatial plot showing localization of KCs, neutrophils, myeloid cells, FBs, B cells, plasma cells, and endothelial cells superimposed on H&E slide. (G) Spatial plot showing detection of COL1A1 (encoding collagen 1A1), PTPRC (CD45), KRT1 (keratin 1), and CDH5 (cadherin 5) within HS lesional skin. (H) IHC showing the localization of proliferative KCs (KRT16), neutrophils (NE, neutrophil elastase), T cells (CD3), B cells (CD20), plasma cells (CD138), dendritic cells (CD11c), and endothelial cells (CD31) in HS lesional skin (patient HS1). Scale bars: top, 6 mm; bottom, 200 μm.
Figure 2
Figure 2. Ligand-receptor interactions between cell types.
(A) Heatmap showing the number of ligand-receptor pairs with a higher score in HS compared with NS among the cell types. Rows, cell type expressing ligand; columns, cell type expressing receptor. ML, myeloid cells; FB, fibroblasts; EC, endothelial cells; KC, keratinocytes; SMC, smooth muscle cells; MLNC, melanocytes; TC, T cells; Mast, mast cells; PLC, plasma cells; BC, B cells. (BE) Circos plots showing cytokine and growth factor ligand-receptor interactions with higher scores in HS compared with NS in which ligands are expressed by myeloid cells (B), keratinocytes (C), FBs (D), and endothelial cells (E) with receptors expressed by other cell types.
Figure 3
Figure 3. Identification of myeloid cell and T cell subsets in HS lesional skin.
(A) UMAP showing 689 myeloid cells colored by subtype. (B) UMAP showing the cells colored by disease condition. (C) Bar chart showing the subtypes as percentage component of disease. (D) Dot plot showing representative marker genes for each subtype. Color represents scaled expression; size of the dot represents the percentage of cells expressing the gene. (E) IHC showing myeloid cell subtype localization in HS lesional skin (patient HS1). Scale bars: top, 6 mm; bottom, 200 μm. (FH) Bar chart showing enriched Gene Ontology biological processes in HS cDC2B cells (F), macrophages (G), and pDCs (H). Green, immune associated; blue, transcription related and other biological processes. (I) UMAP showing 3,985 T cells colored by subtype. (J) UMAP showing T cells colored by disease condition. (K) Bar chart showing the T cell subtypes as percentage component of disease. (L) Dot plot showing representative marker genes for T cell subtypes. Color represents scaled expression; size of the dot represents the percentage of cells expressing the gene. (M and N) Scatterplots showing the correlation between the levels of expression of IL-17A (x axis) and CD4 (M, ρ = 0.03) or CD8A (N, ρ = 0.01). (O) Scatterplot showing the correlation between the levels of expression of IL-17A and IL-17F, ρ = 0.44, among T cells.
Figure 4
Figure 4. Activation and differentiation pathways of HS KCs are driven by local cytokines.
(A) UMAP plot showing 16,986 KCs colored by maturation state. B, basal KCs; S, spinous KCs; SS, supraspinous KCs. (B) UMAP plot showing the KCs colored by disease condition. (C) Heatmap showing marker genes with the highest fold change for each subtype. NS, healthy control. (D) Dot plot showing the top 15 differentially expressed genes comparing HS with NS in the basal (left), spinous (middle), and supraspinous (right) layers. The color scale represents the scaled expression, and the size of the dot represents the percentage of KCs expressing each gene. (E) Violin plots showing the cytokine module scores in the KC subtypes, split for HS (red) and NS (green). (F) Pseudotime trajectory colored by the subtype identity of HS KCs. (G) Pseudotime trajectory colored by the pseudotime of the HS KCs. Dark blue represents early; light blue represents late. (H) Scatterplot showing the correlation between upstream regulators for HS and NS KCs. (I) Scatterplot showing the correlation between HS-derived KC pseudotimes and module scores for IL-17A, IL-22, IL-1A, and IL-6, calculated using genes induced in cultured KCs stimulated by individual cytokines. The color represents the pseudotime subtype identity of the cell.
Figure 5
Figure 5. Identification of HS-associated FB subsets.
(A) Trichrome staining of HS lesional skin (patient HS1). Blue, collagen. Scale bars: top, 6 mm; bottom, 200 μm. (B) UMAP plot showing 4,459 FBs colored by subtype: SFRP2+, LSP1+, COL11A+, RAMP1+, SFRP4+, and CXCL13+. (C) UMAP plot showing the cells colored by disease condition. NS, healthy control. (D) Dot plot showing the representative marker genes for each subtype. Color scale represents scaled expression; size of the dot represents the percentage of cells expressing the gene. (E) Bar chart showing the cell types as percentage component of disease. (F) Immunofluorescence showing the colocalization of CXCL13 with vimentin (FBs) and to a lesser extent CD3 (T cells). Scale bars: 100 μm; insets, 50 μm. (G) IHC showing FB subsets in HS lesional skin (patient HS1). Scale bars: top, 6 mm; bottom, 200 μm. (H) Dot plot showing the expression of collagen genes for each FB subtype. Color scale represents scaled expression; size of the dot represents the percentage of cells expressing the gene. (I) Extracellular matrix (ECM) module score plotted using ECM pathway gene list from Gene Ontology. (J) Expression of ACTA2 among FB subtypes. (K) Circos plot showing the cytokine and chemokine interactions from the SFRP4+ and CXCL13+ FBs with other cell types: PLC, plasma cells; ML, myeloid cells; BC, B cells; TC, T cells. (L) Dot plot showing the expression of cytokines and chemokines among the FB subsets. (M) Circos plot representing the interactions of MMPs, collagens, and laminins between the most prominent HS-associated cell subtypes: Mac, macrophages; EC4, endothelial cell subcluster 4; EC5, endothelial cell subcluster 5; cDC2B, classical type 2 dendritic cell subset B; SMC6, smooth muscle cell subcluster 6. (N) Dot plot showing the expression of MMPs among the FB subsets.
Figure 6
Figure 6. Expression of Hippo pathway genes and their association with HS FB pseudotime.
(A and B) Percentage of FB subtypes expressing Hippo pathway marker (A) and target genes (B). (C) IHC showing localization of Hippo pathway marker genes (patient HS1). Scale bars: top, 6 mm; bottom, 200 μm. (D and E) Scatterplots showing the activation z scores of Hippo pathway marker genes (D) and activated cytokine and growth factor upstream regulators (E) as upstream regulators for the SFRP4+ and CXCL13+ FBs. (F) Pseudotime trajectory of HS SFRP2+, SFRP4+, and CXCL13+ FBs colored by the pseudotime. Dark blue represents early, light blue represents late pseudotime. (G) Pseudotime trajectory colored by the pseudotime subcluster of the FBs. (H) Pseudotime trajectory colored by the subtype identity of HS FBs. (I and J) Scatterplots showing the correlation between the FB pseudotimes and module scores for previously identified upstream regulators (I) and Hippo pathway–associated genes (J). The color represents the pseudotime subcluster identity of the cell.
Figure 7
Figure 7. Modulation of the Hippo pathway in primary HS FBs.
(A) Illustration of Hippo pathway, created with BioRender (biorender.com). (B) Quantitative PCR results showing the effect of TRULI or verteporfin (both 10 μM) on ACTA2, COL1A1, and CTGF expression in HS FBs (n = 5; *P < 0.05, ****P < 0.0001; mean ± SD; ANOVA/Kruskal-Wallis test). (C) Effect of TRULI or verteporfin (both 10 μM) on smooth muscle actin (SMA) and collagen I levels in HS FBs by Western blotting (n = 5; *P < 0.05; mean ± SD; Kruskal-Wallis test [collagen I], ANOVA [SMA]). (D) Verteporfin blocked gel contraction in HS FBs. Data normalized to the corresponding NT (untreated) group (n = 5; *P < 0.05; mean ± SD). (E) TRULI significantly increased cell proliferation while verteporfin dose-dependently blocked cell growth among HS FBs (n = 3; *P < 0.05, ***P < 0.0001; mean ± SEM; 2-way repeated-measures ANOVA). The same NT group is shown in both panels. Cell proliferation was monitored by analysis of the area occupied by cells over time, using IncuCyte S3 Analysis software. (F) Verteporfin showed a dose-dependent reduction in cell migration of HS FBs (n = 3; **P < 0.01, ***P < 0.001; mean ± SEM; 2-way repeated-measures ANOVA). The same NT group is shown in both panels. (G) Expression of cytokines and chemokines among untreated (NT), IL-1β–stimulated (10 ng/mL), and TNF-α–stimulated (10 ng/mL) primary HS FBs treated or not treated with TRULI or verteporfin (n = 5; *P < 0.05, **P < 0.01, ***P < 0.001; mean ± SD; 1-way repeated-measures ANOVA).
Figure 8
Figure 8. Ligand-receptor analysis reveals cell subtype–specific networks in HS lesional skin.
(A) Heatmap showing the number of ligand-receptor pairs with a higher score in HS compared with NS among the previously identified cell subtypes. The ligands were expressed by the cell types in the row, and the receptors were expressed by the cell types in the column. The color scale represents the number of ligand-receptor pairs. (B) Connectome web showing ligand-receptor interactions between all identified cell subsets. Thickness of a line indicates the number of interactions. (C) Dot plot showing selected ligand-receptor interactions between the 5 most contributing cell subtypes. The color scale represents the scaled expression of the gene. The size of the dot represents the percentage of cells expressing the gene of interest; lines link the ligands to receptors.

References

    1. Jfri A, et al. Prevalence of hidradenitis suppurativa: a systematic review and meta-regression analysis. JAMA Dermatol. 2021;157(8):924–931. doi: 10.1001/jamadermatol.2021.1677. - DOI - PMC - PubMed
    1. van Straalen KR, et al. Insights into hidradenitis suppurativa. J Allergy Clin Immunol. 2022;149(4):1150–1161. doi: 10.1016/j.jaci.2022.02.003. - DOI - PubMed
    1. Sabat R, et al. Hidradenitis suppurativa. Nat Rev Dis Primers. 2020;6(1):18. doi: 10.1038/s41572-020-0149-1. - DOI - PubMed
    1. van Straalen KR, et al. Contribution of genetics to the susceptibility to hidradenitis suppurativa in a large, cross-sectional Dutch twin cohort. JAMA Dermatol. 2020;156(12):1359–1362. doi: 10.1001/jamadermatol.2020.3630. - DOI - PMC - PubMed
    1. Jemec GB, et al. The prevalence of hidradenitis suppurativa and its potential precursor lesions. J Am Acad Dermatol. 1996;35(2 pt 1):191–194. doi: 10.1016/S0190-9622(96)90321-7. - DOI - PubMed