. 2023 Dec 12;120(50):e2304074120.
doi: 10.1073/pnas.2304074120. Epub 2023 Dec 5.

Alternative splicing events as peripheral biomarkers for motor learning deficit caused by adverse prenatal environments

Affiliations

Alternative splicing events as peripheral biomarkers for motor learning deficit caused by adverse prenatal environments

Dipankar J Dutta et al. Proc Natl Acad Sci U S A. .

Abstract

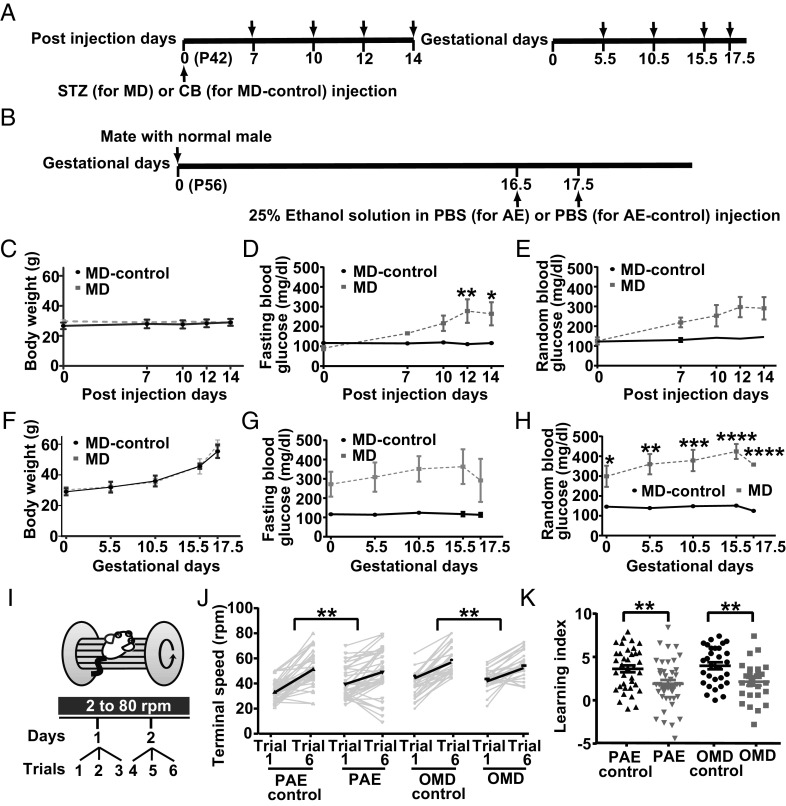
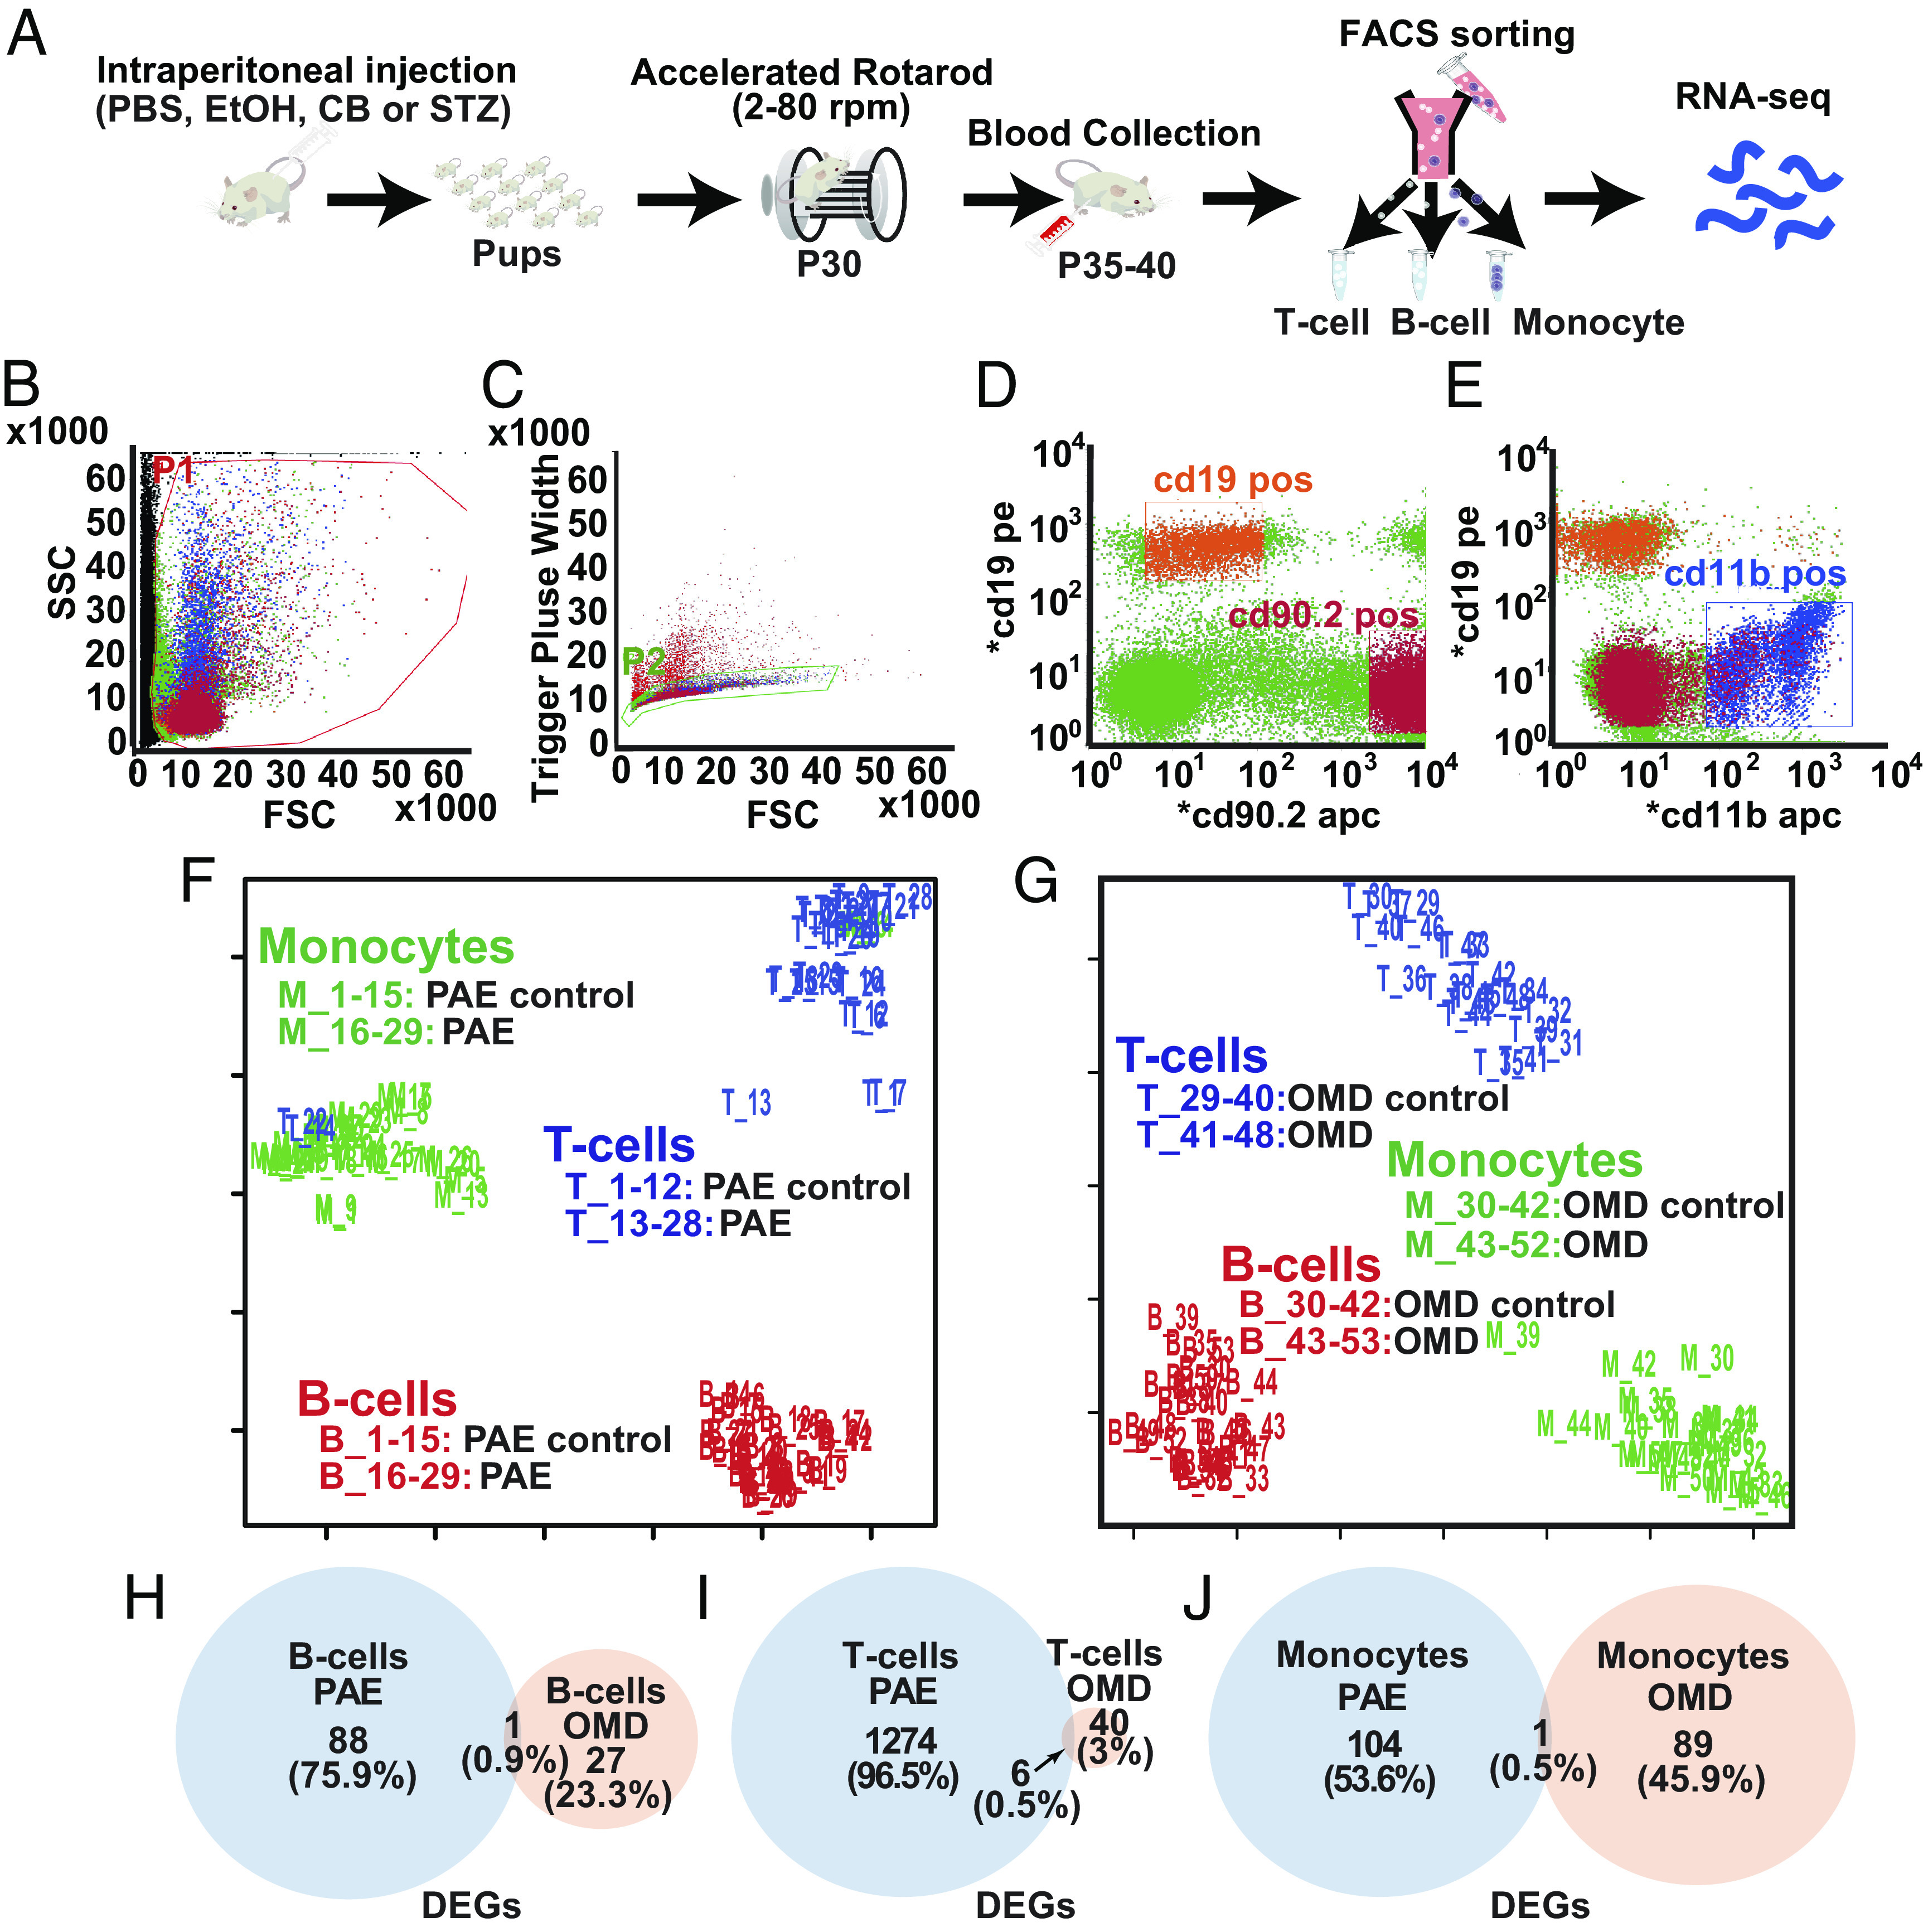
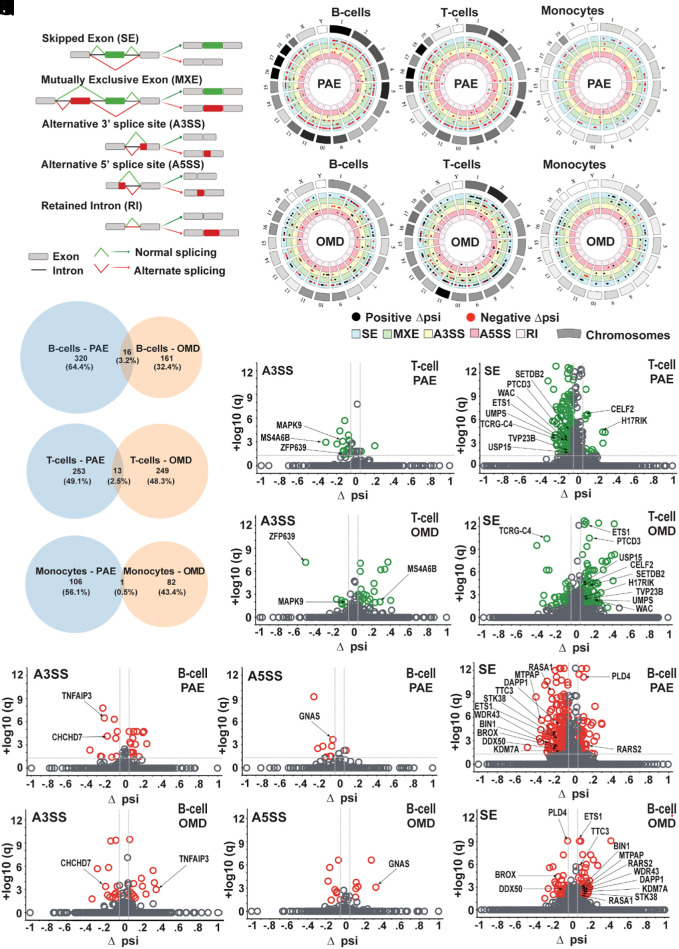
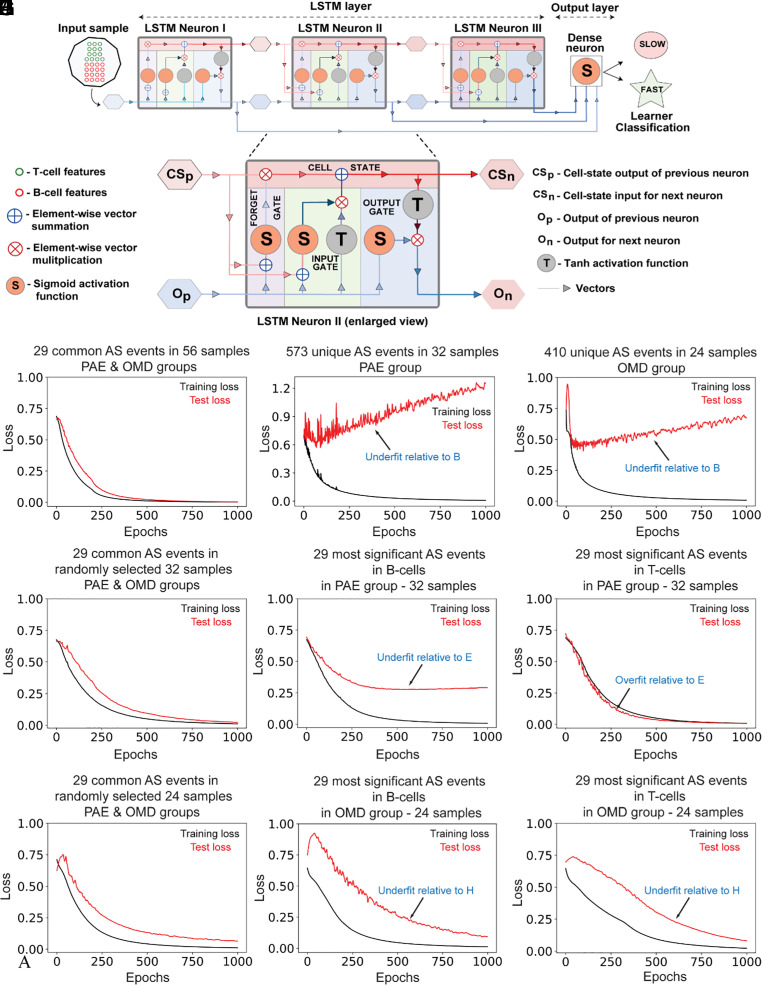
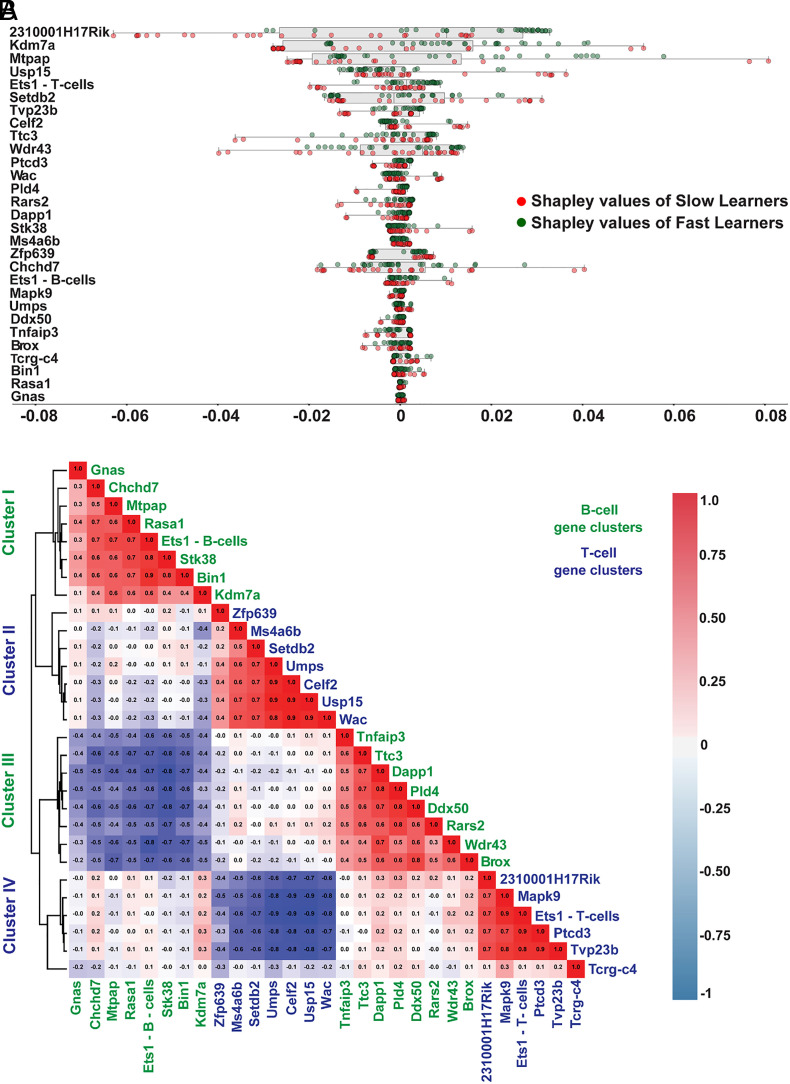
Severity of neurobehavioral deficits in children born from adverse pregnancies, such as maternal alcohol consumption and diabetes, does not always correlate with the adversity's duration and intensity. Therefore, biological signatures for accurate prediction of the severity of neurobehavioral deficits, and robust tools for reliable identification of such biomarkers, have an urgent clinical need. Here, we demonstrate that significant changes in the alternative splicing (AS) pattern of offspring lymphocyte RNA can function as accurate peripheral biomarkers for motor learning deficits in mouse models of prenatal alcohol exposure (PAE) and offspring of mother with diabetes (OMD). An aptly trained deep-learning model identified 29 AS events common to PAE and OMD as superior predictors of motor learning deficits than AS events specific to PAE or OMD. Shapley-value analysis, a game-theory algorithm, deciphered the trained deep-learning model's learnt associations between its input, AS events, and output, motor learning performance. Shapley values of the deep-learning model's input identified the relative contribution of the 29 common AS events to the motor learning deficit. Gene ontology and predictive structure-function analyses, using Alphafold2 algorithm, supported existing evidence on the critical roles of these molecules in early brain development and function. The direction of most AS events was opposite in PAE and OMD, potentially from differential expression of RNA binding proteins in PAE and OMD. Altogether, this study posits that AS of lymphocyte RNA is a rich resource, and deep-learning is an effective tool, for discovery of peripheral biomarkers of neurobehavioral deficits in children of diverse adverse pregnancies.

Keywords: RNA splicing; machine learning; offspring of mother with diabetes; peripheral biomarker; prenatal alcohol exposure.


Conflict of interest statement

Competing interests statement:The authors declare no competing interest.

Figures

Fig. 1.
Fig. 1.
PAE and OMD mice exhibit significant deficits in motor-skill learning. (A) STZ or CB was injected into P42 mice 14 d before gestational onset to obtain MD and MD-control mice, respectively. Arrows indicate timepoints of metabolic and physical assessments. (B) Note that 25% ethanol (in PBS) or PBS was injected into gestating P56 mice at E16.5 and 17.5 to obtain alcohol-exposed (AE) and AE-control mothers. (CH) No significant difference in body weight between MD and MD-controls [C, Treatment: F(1, 5) = 0.3166, P = 0.5980, Days: F(4, 20) = 0.5091, P = 0.7297, Interaction: F(4, 20) = 2.817, P = 0.0527]. Compared to MD-controls, random blood glucose levels were significantly elevated in MD mice at 12 and 14 d post STZ injection in fasting [D, Treatment × Days interaction: F(4, 20) = 3.784, P = 0.0190], but not in the non-fasting condition [E, Treatment: F(1, 5) = 4.146, P = 0.0973, Day: F(4, 20) = 3.128, P = 0.0376, Interaction: F(4, 20) = 1.923, P = 0.1459]. Body weight increased similarly in MD and MD-controls during pregnancy [F, Treatment: F(1, 5) = 0.05422, P = 0.8251, Days: F(4, 20) = 75.95, P < 0.0001, Interaction: F(4, 20) = 0.5466, P = 0.7036]. Compared to MD-control, random blood glucose levels in pregnant MD mice were significantly elevated during E5.5–17.5 in the non-fasting condition [H, Treatment × Days interaction: F(4, 20) = 3.551, P = 0.0241]. Random blood glucose levels in pregnant MD mice were higher, but not significantly so, in the fasting condition [G, Treatment: F(1, 5) = 4.85, P = 0.0789; Days: F(4, 20) = 0.8769, P = 0.4952; and Treatment × Days interaction: F(4, 20) = 0.6711, P = 0.6197]. (I) Accelerated rotarod test schematic. (J) Initial motor coordination (terminal speed at trial 1) was unaffected in PAE and OMD (PAE vs. PAE-control, P = 0.1838; OMD vs. OMD-control, P = 0.2960; Kruskal–Wallis test). Changes in terminal speed of PAE and OMD mice between first and last (sixth) trials were significantly smaller than those of controls (PAE vs. PAE-control, P = 0.0044; OMD vs. OMD-control, P = 0.0035; two-tailed Student’s t-test). (K) Learning-index scores of PAE and OMD mice were significantly lower compared to their respective controls (PAE vs. PAE-control, P = 0.0045; OMD vs. OMD-control, P = 0.035; two-tailed Student’s t-test). Statistical tests: Two-way repeated measures ANOVA (CH) followed by the post hoc simple main effect test (D and H). Sample sizes (# mice): (CH) MD-control = 3, MD = 4; (J and K) PAE-control = 37, PAE = 41, OMD-control = 30, OMD = 26. (CH and J) Line graphs represent mean ± SEM. * = significantly different with P-values of *P < 0.05, **P < 0.01, ***P < 0.001, ****P < 0.0001.
Fig. 2.
Fig. 2.
Number and proportion of common DEGs in PAE and OMD mice are minimal. (A) Blood was drawn from P35–40 mice after their accelerated rotarod test, and PBMCs—B cells, T cells, and monocytes—were FACS-sorted for RNA-sequencing. (BE) PBMCs, labeled with surface antigen markers, were sequentially gated based on cell size [forward scatter (FSC) vs. side scatter] (B) and singlets (FSC vs. trigger pulse width) (C) followed by their sorting into B cells (D, CD19+/CD90.2), monocytes (D, CD19/CD90.2+) and T cells (E, CD11b+/CD19). (F and G) MDS analysis of normalized RNA-seq count data from all samples show clustering of samples by cell type, in PAE (F) and OMD (G). (HJ) Venn diagrams show the number and proportion of unique and common significant DEGs in PAE and OMD, in comparison to their respective controls, in B cells (H), T cells (I), and monocytes (J). At least a twofold change in gene expression, per EdgeR analysis, was considered significant.
Fig. 3.
Fig. 3.
Number, proportion, identity, and characteristics of common AS events in PAE and OMD. (A) Five AS event types (SE, MXE, A3SS, A5SS, and RI) assessed. (BG) Circos plots show chromosomal distribution of significant AS events in B cells (B and E), T cells (C and F) and monocytes (D and G), in PAE (BD) and OMD (EG). Outermost circle blocks represent 21 mouse chromosomes. Length of these blocks and density of their monochrome fill are proportional to relative chromosomal length and relative density of significant AS events in that chromosome respectively. Each inner concentric circle represents an AS type. Black and red dots represent significant AS events with +Δpsi and −Δpsi respectively. (HJ) Venn diagrams show number and proportion of unique and common significant AS events in PAE and OMD, in comparison to their respective controls, in B cells (H), T cells (I), and monocytes (J). (KN) Volcano plots show distribution of significant AS events (green), among non-significant AS events (gray), of A3SS (K and M) and SE (L and N) AS types in T cells in PAE (K and L) and OMD (M and N). Arrows indicate distribution of 13 significant AS events common to PAE and OMD in T cells. (OT) Volcano plots show distribution of significant AS events (red), among non-significant AS events (gray), of A3SS (O and R), A5SS (P and S), and SE (Q and T) AS types in B cells in PAE (OQ) and OMD (RT). Arrows indicate distribution of 16 significant AS events common to PAE and OMD in B cells. AS events with a Δpsi > 5% and FDR < 5% were considered significant.
Fig. 4.
Fig. 4.
Psi values of AS events common to PAE and OMD are better than those unique to PAE and OMD at adequately training a deep-learning model to accurately predict motor learner type. (A) LSTM model architecture consisting of an LSTM layer with three LSTM neurons and an output layer with one dense neuron. Each LSTM neuron comprises four gates: an input gate for information input, a forget gate for forgetting irrelevant learned associations, a cell-state (memory) gate for remembering relevant learned associations, and an output gate for output of learned information. Vectors show flow of information and their various permutations during learning. For training and testing the LSTM model, psi values of 29 common AS events were used as input, and learnability of PAE and OMD mice, classified as either slow or fast learners (learning-index score below or above the population median of 2.8, respectively), was used as output. Of note, 80% and 20% of input was used for training and testing respectively. (BJ) Comparison of learnability of the LSTM model, as assessed via distribution of binary cross-entropic loss function values over epochs. Psi values from different subsets of data with equivalent sample sizes, i.e., from the common 29 AS biomarkers (B, E, and H), or all unique significant events in B cells and T cells in PAE (C) or OMD (D), or only the top 29 most significant unique AS events in B cells (F and I) or T cells (G and J) in PAE (F and G) and OMD (I and J), were used as input. For equivalent comparison of model performance across BJ, sample number in biomarker group (B, E, and H) was randomly reduced from 56 (B, all samples) to 32 (E) to 24 (H). In all comparisons, AS events in common biomarker group (B, E, and H) resulted in better LSTM model learnability than either all unique significant events (C and D) or the top 29 most unique significant AS events in either PAE (F and G) or OMD (I and J). This worse LSTM model learnability for each comparison is annotated with blue text (C, D, F, G, I, and J) as either underfitting or overfitting relative to LSTM model performance with biomarker group (B, E, and H).
Fig. 5.
Fig. 5.
Shapley value analysis suggests differential contribution of individual AS event biomarkers to LSTM model performance. (A) Shapley values were derived for 29 common biomarker AS events—for each mouse in PAE, PAE-control, OMD, and OMD-control—to assess relative contribution of each biomarker AS event to the LSTM model’s ability in accurately predicting learner type. Tornado plot displays distribution of all Shapley values. Red and green circles represent Shapley values in slow and fast learners respectively. Biomarker AS events are arranged in descending order of their Shapley value sum from all samples. (B) Pearson correlation of Shapley values of AS events from all samples identified four distinct clusters: clusters I and III for B cell AS events and clusters II and IV for T cell AS events. Shapley values for AS events in each cluster were positively correlated with that of other AS events in the same cluster (reddish cells). There was a strong negative correlation between Shapley values for AS events of the same cell type but belonging to different clusters (cluster I and III, cluster II and IV) (blueish cells). Shapley values for AS event clusters of different cell types showed no strong correlation (whitish cells).

References

    1. Levitt P., Reinoso B., Jones L., The critical impact of early cellular environment on neuronal development. Prev. Med. 27, 180–183 (1998). - PubMed
    1. Shonkoff J. P., Boyce W. T., Levitt P., Martinez F. D., McEwen B., Leveraging the biology of adversity and resilience to transform pediatric practice. Pediatrics 147, e20193845 (2021). - PubMed
    1. Hadders-Algra M., Early diagnostics and early intervention in neurodevelopmental disorders-age-dependent challenges and opportunities. J. Clin. Med. 10, 861 (2021). - PMC - PubMed
    1. Popova S., Lange S., Probst C., Gmel G., Rehm J., Estimation of national, regional, and global prevalence of alcohol use during pregnancy and fetal alcohol syndrome: A systematic review and meta-analysis. Lancet Glob. Health 5, e290–e299 (2017). - PubMed
    1. International Association of Diabetes and Pregnancy Study Groups Consensus Panel et al., International Association of Diabetes and Pregnancy Study Groups recommendations on the diagnosis and classification of hyperglycemia in pregnancy. Diabetes Care 33, 676–682 (2010). - PMC - PubMed