. 2024 Jul 1;19(7):1608-1617.
doi: 10.4103/1673-5374.386490. Epub 2023 Nov 8.

Homer1a reduces inflammatory response after retinal ischemia/reperfusion injury

Affiliations

Homer1a reduces inflammatory response after retinal ischemia/reperfusion injury

Yanan Dou et al. Neural Regen Res. .

Abstract

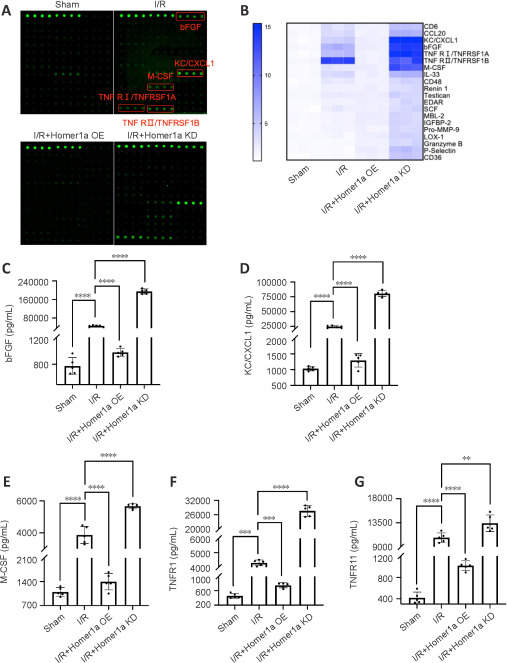
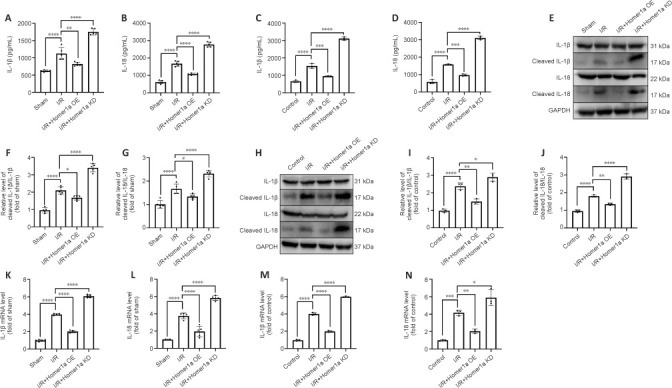
Elevated intraocular pressure (IOP) is one of the causes of retinal ischemia/reperfusion injury, which results in NLRP3 inflammasome activation and leads to visual damage. Homer1a is reported to play a protective role in neuroinflammation in the cerebrum. However, the effects of Homer1a on NLRP3 inflammasomes in retinal ischemia/reperfusion injury caused by elevated IOP remain unknown. In our study, animal models were constructed using C57BL/6J and Homer1flox//Homer1a+//Nestin-Cre+/ mice with elevated IOP-induced retinal ischemia/reperfusion injury. For in vitro experiments, the oxygen-glucose deprivation/reperfusion injury model was constructed with Müller cells. We found that Homer1a overexpression ameliorated the decreases in retinal thickness and Müller cell viability after ischemia/reperfusion injury. Furthermore, Homer1a knockdown promoted NF-κB P65Ser536 activation via caspase-8, NF-κB P65 nuclear translocation, NLRP3 inflammasome formation, and the production and processing of interleukin-1β and interleukin-18. The opposite results were observed with Homer1a overexpression. Finally, the combined administration of Homer1a protein and JSH-23 significantly inhibited the reduction in retinal thickness in Homer1flox//Homer1a+//Nestin-Cre+/ mice and apoptosis in Müller cells after ischemia/reperfusion injury. Taken together, these studies demonstrate that Homer1a exerts protective effects on retinal tissue and Müller cells via the caspase-8/NF-κB P65/NLRP3 pathway after I/R injury.


Conflict of interest statement

Conflicts of interest: The authors declare that they have no competing interests.

Figures

Figure 1
Figure 1
Diagram of the in vivo experimental groups. AAV: Adeno-associated virus; Homer1: homer scaffold protein 1; I/R: ischemia/reperfusion; inh: inhibitor; KD: knock-down; NF-κB: nuclear factor κB; OE: overexpression.
Figure 2
Figure 2
Homer1a may be associated with damage to the retina after retinal I/R injury. (A) Representative image showing hematoxylin-eosin staining of ischemic retinal tissue after reperfusion. As the reperfusion time increased, retinal thickness gradually decreased. Arrows indicate the measured thickness. Scale bars: 100 μm. (B) Quantification of the mean thickness in A. (C) CCK-8 assays showing the viability of Müller cells after reperfusion. (D) Representative light microscopy images of the control and I/R 24 hours (24 h) groups. Arrows in the control group indicate normal Müller cells and arrows in the I/R 24 h group indicate injured Müller cells. Müller cells shrank and became round after I/R. Scale bars: 20 μm. (E) Representative blots showing retinal Homer1a expression after reperfusion. (F) Quantification of E. (G) Representative blots showing Müller cell Homer1a expression after reperfusion. (H) Quantification of G. (I, J) Real-time polymerase chain reaction was used to measure Homer1a mRNA levels in retinal tissue (I) and Müller cells (J) at each time point after reperfusion. The data were normalized to sham group or control group, respectively. GAPDH was used as an internal control. The data are expressed as the mean ± SD. There were five mice per group in the in vivo study and each in vitro experiment was repeated three times. *P < 0.05, **P < 0.01, ***P < 0.001, ****P < 0.0001 (one-way analysis of variance followed by Tukey's multiple comparisons test). CCK-8: Cell Counting Kit-8; ELM: external limiting membrane; GAPDH: glyceraldehyde-3-phosphate dehydrogenase; GCL: ganglion cell layer; Homer1: homer scaffold protein 1; I/R: ischemia/reperfusion; INL: inner nuclear layer; IPL: inner plexiform layer; NFL: nerve fiber layer; ns: no significant difference; ONL: outer nuclear layer; OPL: outer plexiform layer; RPE: retinal pigment epithelium.
Figure 3
Figure 3
Homer1a protects against damage to retinal tissue and Müller cells after retinal I/R injury. (A) Representative image of hematoxylin-eosin staining in ischemic retinal tissue. Homer1a overexpression reversed the decrease in retinal thickness caused by I/R in mice. Arrows indicate the measured thickness. Scale bars: 100 μm. (B) Quantification of retinal thickness in A. (C) Representative TUNEL staining image of apoptosis in retinal tissue. Homer1a overexpression reversed the apoptosis rate of mouse retinal cells induced by I/R. Arrows indicate apoptotic cells. Scale bars: 50 μm. (D) Quantification of apoptosis rate in C. (E) Representative TUNEL staining image of apoptosis in Müller cells. Homer 1a overexpression reversed the apoptosis rate of Müller cells induced by I/R. Arrows indicate apoptotic cells. Scale bars: 100 μm. (F) Quantification of apoptosis rate in E. (G) CCK-8 assays showing the viability of Müller cells. The data are expressed as the mean ± SD. There were five mice per group in the in vivo study and each in vitro experiment was repeated three times. *P < 0.05, **P < 0.01, ***P < 0.001, ****P < 0.0001 (one-way analysis of variance followed by Tukey's multiple comparisons test). CCK-8: Cell Counting Kit-8; DAPI: 4′,6-diamidino-2-phenylindole; ELM: external limiting membrane; GCL: ganglion cell layer; Homer1: homer scaffold protein 1; I/R: ischemia/reperfusion; INL: inner nuclear layer; IPL: inner plexiform layer; KD: knock-down; NFL: nerve fiber layer; OE: overexpression; ONL: outer nuclear layer; OPL: outer plexiform layer; RPE: retinal pigment epithelium; TUNEL: terminal deoxynucleotidyl transferase dUTP nick end labeling.
Figure 4
Figure 4
Expression of inflammatory factors after retinal I/R injury is regulated by Homer1a. (A) Cytokine array analysis of retinal tissue obtained from the different groups. Green dots represent four duplicate detections of one indicator per sample. (B) Heatmap showing the expression of inflammatory factors. (C–G) Quantification of the expression of inflammatory factors in B. The data are expressed as the mean ± SD. n = 5 mice per group. **P < 0.01, ***P < 0.001, ****P < 0.0001 (one-way analysis of variance followed by Tukey's multiple comparisons test). bFGF: Basic fibroblast growth factor; Homer1: homer scaffold protein 1; I/R: ischemia/reperfusion; KC/CXCL1: chemokine (C-X-C motif) ligand 1; KD: knock-down; M-CSF: macrophagecolony stimulating factor; OE: overexpression; TNFR1/TNFRSF1A: tumor necrosis factor receptor 1; TNFR11/TNFRSF1B: tumor necrosis factor receptor 2.
Figure 5
Figure 5
Homer1a inhibits the activation of NLRP3 and caspase-8 inflammasomes after retinal I/R injury. (A–J) Representative blots and quantification showing the expression levels of caspase-8, NLRP3, ASC, caspase-1 and cleaved caspase-1 in retinal tissue (A–E) and Müller cells (F–J). GAPDH was used as an internal control. The data are expressed as the mean ± SD. There are five mice detected in each group in in vivo study and each in vitro experiment was repeated three times. **P < 0.01, ***P < 0.001, ****P < 0.0001 (one-way analysis of variance followed by Tukey's multiple comparisons test). ASC: Apoptosis-associated speck-like protein containing a caspase recruitment domain; GAPDH: glyceraldehyde-3-phosphate dehydrogenase; Homer1: homer scaffold protein 1; I/R: ischemia/reperfusion; KD: knock-down; NLRP3: NACHT-LRR-PYD domain protein 3; OE: overexpression.
Figure 6
Figure 6
Formation of NLRP3 and caspase-8 inflammasomes is regulated by Homer1a after retinal I/R injury. (A, B) Binding of ASC and caspase-8 in retinal tissue. (C, D) Binding of ASC and NLRP3 in retinal tissue. (E, F) Binding of ASC and caspase-8 in Müller cells. (G, H) Binding of ASC and NLRP3 in Müller cells. GAPDH was used as an internal control. The quantitative results were shown in Additional Figure 3. There were five mice per group in the in vivo study and each in vitro experiment was repeated three times. ASC: Apoptosis-associated speck-like protein containing a caspase recruitment domain; GAPDH: glyceraldehyde-3-phosphate dehydrogenase; Homer1: homer scaffold protein 1; I/R: ischemia/reperfusion; IP: immunoprecipitation; KD: knock-down; NLRP3: NACHT-LRR-PYD domain protein 3; OE: overexpression.
Figure 7
Figure 7
Homer1a inhibits the processing of IL-1β and IL-18 after retinal I/R injury. (A–D) ELISA analysis of IL-1β and IL-18 levels in retinal tissue (A, B) and Müller cells (C, D). (E–J) Representative blots and quantification showing the expression levels of IL-1β, cleaved IL-1β, IL-18, and cleaved IL-18 in retinal tissue (E–G) and Müller cells (H–J). (K–N) Relative mRNA expression of IL-1β and IL-18 in retinal tissues (K, L) and Müller cells (M, N). GAPDH was used as an internal control. The data are expressed as the mean ± SD. There were five mice per group in the in vivo study and each in vitro experiment was repeated three times. *P < 0.05, **P < 0.01, ***P < 0.001, ****P < 0.0001 (one-way analysis of variance followed by Tukey's multiple comparisons test). ELISA: Enzyme-linked immunosorbent assay; GAPDH: glyceraldehyde-3-phosphate dehydrogenase; Homer1: homer scaffold protein 1; I/R: ischemia/reperfusion; IL: interleukin; KD: knock-down; OE: overexpression.
Figure 8
Figure 8
NF-κB P65 level is regulated by Homer1a after retinal I/R injury. (A–D) Representative blots and quantification showing the expression levels of NF-κB P65 and P-NF-κB P65Ser536 in retinal tissue (A, B) and Müller cells (C, D) after reperfusion. (E, F) RT-PCR results of NF-κB P65 and P-NF-κB P65Ser536 mRNA levels in retinal tissue (E) and Müller cells (F) after reperfusion. (G, H) Representative blots and quantification of NF-κB P65 and P-NF-κB P65Ser536 expression levels in retinal tissue. (I–L) Representative blots and quantification of NF-κB P65 and P-NF-κB P65Ser536 expression levels in the cytoplasm (I, J) and nucleus (K, L) of retinal tissue. (M, N) Representative blots and quantification of NF-κB P65 and P-NF-κB P65Ser536 expression levels in Müller cells. (O–R) Representative blots and quantification of NF-κB P65 and P-NF-κB P65Ser536 expression levels in the cytoplasm (O, P) and nucleus (Q, R) of Müller cells. GAPDH or H3 was used as an internal control. The data are expressed as the mean ± SD. There were five mice per group in the in vivo study and each in vitro experiment was repeated three times. *P < 0.05, **P < 0.01, ***P < 0.001, ****P < 0.0001 (one-way analysis of variance followed by Tukey's multiple comparisons test). GAPDH: Glyceraldehyde-3-phosphate dehydrogenase; Homer1: homer scaffold protein 1; I/R: ischemia/reperfusion; KD: knock-down; NF-κB: nuclear factor κB; ns: no significant difference; OE: overexpression.
Figure 9
Figure 9
JSH-23 decreases the activation of NLRP3 but does not affect the expression level of caspase-8. (A–E) Representative blots and quantification showing the expression levels of NLRP3, IL-1β, cleaved IL-1β, IL-18, caspase-8 and cleaved IL-18 in retinal tissue. (F, G) Representative blots and quantification of NF-κB P65 and P-NF-κB P65Ser536 expression levels in retinal tissue after caspase-8 inh treatment. (H–L) Representative blots and quantification of NLRP3, IL-1β, cleaved IL-1β, IL-18, caspase-8, and cleaved IL-18 expression levels in Müller cells. (M, N) Representative blots and quantification of NF-κB P65 and P-NF-κB P65Ser536 expression levels in Müller cells after caspase-8 inh treatment. GAPDH was used as an internal control. The data are expressed as the mean ± SD. There were five mice per group in the in vivo study and each in vitro experiment was repeated three times. *P < 0.05, **P < 0.01, ***P < 0.001, ****P < 0.0001 (one-way analysis of variance followed by Tukey's multiple comparisons test). GAPDH: Glyceraldehyde-3-phosphate dehydrogenase; I/R: ischemia/reperfusion; IL: interleukin; inh: inhibitor; JSH-23: a NF-κB-P65 inhibitor; KD: knock-down; NF-κB: nuclear factor κB; NLRP3: NACHT-LRR-PYD domain protein 3; ns: no significant difference; OE: overexpression.
Figure 10
Figure 10
Homer1a protein combined with JSH-23 alleviates retinal and Müller cell injury. (A) PCR result of the genotyping of different mice (Genotype: Homer1 flox, Mutant = 300 bp; Wild type = 232 bp. Homer1a, Mutant = 318 bp; Wild type = 485 bp. Nestin-cre, Mutant = 150 bp; Wild type = 246 bp). (B, C) Representative image of TUNEL staining showing the apoptosis of retinal tissue (B) and Müller cells (C). Arrows indicate apoptotic cells. Treatment with NF-κB inh and Homer1a protein reversed the apoptosis rate of transgenic mice retinal cells (B) and Müller cells (C) induced by I/R. Scale bars: 50 μm (B) and 200 μm (C). (D) Representative images of hematoxylin-eosin staining of ischemic retinal tissue. Treatment with NF-κB inh and Homer1a protein reversed the decrease in retinal thickness of transgenic mice induced by I/R. Arrows indicate the measured thickness. Scale bars: 100 μm. (E) Quantification of the TUNEL+ cell rate in B. (F) Quantification of the TUNEL+ cell rate in C. (G) Quantification of the mean thickness of retina. The data are expressed as the mean ± SD. There were five mice per group in the in vivo study and each in vitro experiment was repeated three times. **P < 0.01, ***P < 0.001, ****P < 0.0001 (one-way analysis of variance followed by Tukey's multiple comparisons test). DAPI: 4′,6-Diamidino-2-phenylindole; ELM: external limiting membrane; GCL: ganglion cell layer; Homer1: homer scaffold protein 1; I/R: ischemia/reperfusion; inh: inhibitor; INL: inner nuclear layer; IPL: inner plexiform layer; JSH-23: a NF-κB-P65 inhibitor; NFL: nerve fiber layer; NF-κB: nuclear factor κB; ONL: outer nuclear layer; OPL: outer plexiform layer; PCR: polymerase chain reaction; RPE: retinal pigment epithelium; TUNEL: terminal deoxynucleotidyl transferase dUTP nick end labeling.

Similar articles

Cited by

References

    1. Abcouwer SF, Shanmugam S, Muthusamy A, Lin CM, Kong D, Hager H, Liu X, Antonetti DA. Inflammatory resolution and vascular barrier restoration after retinal ischemia reperfusion injury. J Neuroinflammation. 2021;18:186. - PMC - PubMed
    1. Baeuerle PA, Henkel T. Function and activation of NF-kappa B in the immune system. Annu Rev Immunol. 1994;12:141–179. - PubMed
    1. Baeuerle PA, Baltimore D. NF-kappa B: ten years after. Cell. 1996;87:13–20. - PubMed
    1. Baloula V, Fructuoso M, Kassis N, Gueddouri D, Paul JL, Janel N. Homocysteine-lowering gene therapy rescues signaling pathways in brain of mice with intermediate hyperhomocysteinemia. Redox Biol. 2018;19:200–209. - PMC - PubMed
    1. Bay V, Butt AM. Relationship between glial potassium regulation and axon excitability: a role for glial Kir4.1 channels. Glia. 2012;60:651–660. - PubMed