. 2023 Dec 21;186(26):5859-5875.e24.
doi: 10.1016/j.cell.2023.11.008. Epub 2023 Dec 4.

Dissecting embryonic and extraembryonic lineage crosstalk with stem cell co-culture

Affiliations

Dissecting embryonic and extraembryonic lineage crosstalk with stem cell co-culture

Yulei Wei et al. Cell. .

Abstract

Embryogenesis necessitates harmonious coordination between embryonic and extraembryonic tissues. Although stem cells of both embryonic and extraembryonic origins have been generated, they are grown in different culture conditions. In this study, utilizing a unified culture condition that activates the FGF, TGF-β, and WNT pathways, we have successfully derived embryonic stem cells (FTW-ESCs), extraembryonic endoderm stem cells (FTW-XENs), and trophoblast stem cells (FTW-TSCs) from the three foundational tissues of mouse and cynomolgus monkey (Macaca fascicularis) blastocysts. This approach facilitates the co-culture of embryonic and extraembryonic stem cells, revealing a growth inhibition effect exerted by extraembryonic endoderm cells on pluripotent cells, partially through extracellular matrix signaling. Additionally, our cross-species analysis identified both shared and unique transcription factors and pathways regulating FTW-XENs. The embryonic and extraembryonic stem cell co-culture strategy offers promising avenues for developing more faithful embryo models and devising more developmentally pertinent differentiation protocols.

Keywords: ECM signaling; embryonic stem cell; extraembryonic endoderm stem cell; lineage crosstalk; monkey; mouse; trophoblast stem cell.


Conflict of interest statement

Declaration of interests Y.W., L.Y., T.T., and J.W. are inventors on a patent application (applied through the Board of Regents of The University of Texas System, application number 63/488,401) entitled “Methods For the Derivation Culture Of Embryonic and Extra-Embryonic Stem Cells” arising from this work.

Figures

Figure 1.
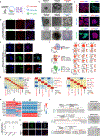
Figure 1.. Derivation and characterization of embryonic and extraembryonic FTW stem cells from mouse blastocyst.
(A) Schematic of FTW embryonic and extraembryonic stem cell lines derivation from mouse blastocysts. (B) Representative bright field (BF) images showcase the colony morphologies of FTW-mXENs, FTW-mTSCs, and FTW-mESCs. Scale bar, 100 μm. (C) Representative immunofluorescence (IF) images display lineage markers for extraembryonic endoderm (GATA6 and SOX17), trophoblast (CDX2 and EOMES), and epiblast (SOX2 and OCT4) in FTW-mXENs (top), FTW-mTSCs (middle), and FTW-mESCs (bottom), respectively. Scale bar, 100 μm. (D) and (F) Representative combined BF and fluorescence images depict the chimera contribution from GFP-labeled FTW-mXENs (D) and FTW-mTSCs (F) to mouse conceptuses at E11.5 stage. Scale bar, 1 mm. (E) IF staining presents a chimeric yolk sac membrane marked for GFP, GATA6, and GATA4. Scale bar, 100 μm. (G) IF staining of a chimeric sagittal section of the placenta highlights CK8 and GFP. The various placental layers are distinguished by dotted lines. Scale bar, 100 μm. See also Figure S1 and Table S1.
Figure 2.
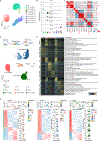
Figure 2.. Transcriptomic profiling of mouse FTW stem cells.
(A) Uniform manifold approximation (UMAP) visual representation captures the single cell populations within FTW-mXENs, FTW-mTSCs, and FTW-mESCs. (B) Violin plots illustrate the expression levels of FTW-mESC, FTW-mXEN, and FTW-mTSC marker genes. (C) A heatmap visualizes the Pearson correlation matrix, comparing FTW-mXENs, FTW-mTSCs, FTW-mESCs, and different mouse datasets. (D) (Top) Diagram detailing the derivation timeline for FTW-mXENs, FTW-mTSCs, and FTW-mESCs. (Bottom) UMAP visual representation integrating all scRNA-seq data, which include ICM/EPI, TE, and PrE of blastocysts; ELCs, TLCs, and XLCs from Day 8 outgrowth; and established FTW-mESCs, FTW-mTSCs and FTW-mXENs. (E) (Top) Pseudotime trajectory depicts the scRNA-seq progression of distinct cell lines in mice. (Bottom left) A heatmap showcases the pseudotime-dependent gene expression changes. Notably, C1, C4, C7 represent early-stage patterns; C2, C5, C8 represent mid-stage patterns; and C3, C6 C9 capture late-stage patterns. (Bottom Right) A kinetics plot visualizes the relative expression trends of marker genes throughout developmental pseudotime. (F) (Left) A gene-expression heatmap details the differentially expressed genes for each identified cluster. (Right) Associated Gene ontology (GO) terms for each cluster are presented. See also Figure S2 and Table S2.
Figure 3.
Figure 3.. FTW-mXEN-mediated proliferation inhibition of FTW-mESCs.
(A) Illustration depicting the establishment of co-cultures using FTW stem cells to study cross-lineage communications. (B) Representative fluorescence and BF merged images display day-wise (days 1–5) the progression of separately cultured FTW-mESCs (green) and their co-culture with either FTW-mXENs (red) and/or FTW-mTSCs (blue arrowheads), or proliferative mouse embryonic fibroblasts. Scale bar, 100 μm. (C) A violin plot reveals the product of area and GFP intensity for individual FTW-mESC colonies on day 5, both in separate cultures and co-cultures. (D) Growth dynamics from days 1 to 5 for separately cultured FTW-mESCs and their co-cultures with FTW-mXENs (mean ± SD, day 1, n = 2, day 2–5, n = 5, biological replicates). (E) Schematic representation of teratoma formation using FTW-mESCs only and a combination of FTW-mESCs co-injected with FTW-mXENs (mESCs:mXENs = 4:1). Both conditions injected the same number (1 × 10⁶) of FTW-mESCs. (F) Images of teratomas generated from FTW-mESCs injected with (bottom) and without (top) FTW-mXENs. (G) Comparisons of lengths and widths of teratomas derived from FTW-mESCs injected with (orange) and without (green) FTW-mXENs. (H) Weights of the resulting teratomas from FTW-mESCs injected with (orange) and without (green) FTW-mXENs. (mean ± SD, n = 5, biological replicates). (I) A diagram shows the tissue dissection scheme for E6.5-6.75 mouse conceptus. (J) Representative BF images showcase ex vivo culture results of EPI+VE (VE+) and EPI (VE−) tissues isolated from E6.5-6.75 mouse conceptuses at indicated time points. Scale bar, 100 μm. (K) Total cell number for VE+ and VE− tissues after 48-hour ex vivo culture (mean ± SD, n = 10, biological replicates). N.S. not significant, ****p < 0.0001, P-values were calculated using two-tailed Student’s t-test. See also Figure S3.
Figure 4.
Figure 4.. Mechanistic insights of growth inhibition of FTW-mESCs by FTW-mXENs.
(A) Diagram outlining the scRNA-seq experiments. (B) Heatmap illustrating the Pearson correlation among FTW-mESCs, FTW-mXENs, and FTW-mTSCs in separate cultures and co-cultures. The displayed numbers correspond to Pearson correlation coefficients. (C) Circle plots detailing the ratios of number (left) and strength (right) of cell-cell interactions between co-cultured and separately cultured samples. Red lines, increased interactions; blue lines, decreased interactions. (D) Heatmaps revealing outgoing (left) and incoming (right) signaling pathways in co-cultured mouse FTW stem cells. (E) Violin plot showing the product of area and GFP intensity for each FTW-mESC colony on day 5 in separate cultures and co-cultures (mESCs: mXENs = 2:1 or 1:1) and separate cultures supplemented with different ECM proteins. Matrigel_L: 0.5% (v/v), Matrigel_H: 2% (v/v), Laminin_L: 30 μg/ml, Laminin_H: 120 μg/ml, Collagen_L: 15 μg/ml, Collagen_H: 60 μg/ml, Vitronectin_L: 5 μg/ml, Vitronectin_H: 30 μg/ml. N.S., not significant. (F) Violin plot showing the area and GFP intensity product for each FTW-mESC colony across various experimental conditions. (G) A schematic summary capturing the key mechanistic takeaways from the observed proliferation inhibition of FTW-mESCs by FTW-mXENs. N.S. not significant, ****p < 0.0001. P-values were calculated using a two-tailed Student’s t-test. See also Figure S4.
Figure 5.
Figure 5.. Derivation, characterization and transcriptomic profiling of monkey FTW stem cells.
(A) Schematic of FTW embryonic and extra-embryonic stem cell lines derivation from monkey blastocysts. (B) (Top) Representative BF images of a 10 d.p.f monkey blastocyst, day 12 outgrowth, and established FTW-cyXENs (P14). (Middle) Representative BF images of a 10 d.p.f monkey blastocyst, day 12 outgrowth, and established FTW-cyTSCs (P10). (Bottom) Representative BF images of a 7 d.p.f monkey blastocyst, day 7 outgrowth, and established FTW-cyESCs (P7). Scale bars, 50 μm. (C) Representative IF images showing the expression of monkey extra-embryonic endoderm (GATA6 and GATA4), trophoblast (GATA3 and CK7), and epiblast (OCT4 and SOX2) lineage markers in FTW-cyXENs (top), FTW-cyTSCs (middle), and FTW-cyESCs (bottom), respectively. Scale bar, 100 μm. (D) Representative IF co-staining images of COL6A1, FOXA1, and GATA4 in differentiated FTW-cyXENs at day 9. Blue, DAPI. Scale bars, 100 μm. (E) (Bottom) Representative IF co-staining images of GATA3 with the EVT maker HLA-G in EVT-like cells differentiated from FTW-cyTSCs. (Top) Representative IF co-staining images of GATA3 with the SCT makers HCG and HCGB in SCT-like cells differentiated from FTW-cyTSCs. (F) (Left) UMAP visualization of all scRNA-seq cells from monkey FTW stem cells. (Right) UMAP plot, showing the expression of representative markers in the different clusters/cell lines, FTW-cyESC (SOX2, POU5F1, NANOG), FTW-cyPS (MIXL1, LHX1, GSC); FTW-cyXEN (SOX17, GATA6), FTW-cyVE/YE (IHH, MIXL1), FTW-cyEXMC (COL6A1, HAND2), FTW-cyTSC (GNR2F2, LRP2), FTW-cyCTB (C1QBP, COMMD6), and FTW-cySTB (CGA, CRH). (G) Heatmap illustrating the Pearson correlation across various cell types with FTW cells and correlated with in vivo monkey datasets. The numbers represent Pearson correlation coefficients. (H) Heatmaps of TF enrichment scores comparing FTW-XENs between monkeys and mice. (I) Gene knockout of HMGA1, NFE2L1, and SALL1 in monkey FTW-cyXENs and the representative BF images. (J) qRT-PCR analysis of GATA4, PDGFRA, and NFE2L1 expression in NFE2L1 knockout FTW-cyXENs. (K) Representative IF co-staining images of GATA4 and GATA6 in wild type and NFE2L1 knockout FTW-cyXENs. Blue, DAPI. Scale bars, 100 μm. See also Figure S5 and Table S3A, S3B.
Figure 6.
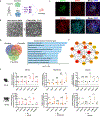
Figure 6.. FTW-cyXEN-mediated proliferation inhibition of FTW-cyESCs.
(A) Representative merged fluorescence and BF images of days 1–5 separately cultured FTW-cyESCs (green) and FTW-cyESCs co-cultured with FTW-cyXENs (red arrowheads) and/or FTW-cyTSCs (blue arrowheads) or proliferative fibroblast. Scale bar, 100 μm. (B) Violin plot showing the area and GFP intensity product for each FTW-mESC colony under different conditions. (C) Heatmap showing the Pearson correlation between separately cultured and co-cultured FTW-cyESCs, FTW-cyXENs, and FTW-cyTSCs. The numbers represent Pearson correlation coefficients. (D) Heatmaps of outgoing (left) and incoming (right) signaling pathways in co-cultured monkey FTW stem cells. (E) Violin plot showing the product of area and GFP intensity for each FTW-cyESC colony on day 5 in separate cultures and co-cultures (cyESCs: cyXENs = 1:3.5 or 1:7) as well as separate cultures supplemented with different ECM proteins. Matrigel_L: 0.5% (v/v), Matrigel_H: 2% (v/v), Laminin_L: 2.5 μg/ml, Laminin_H: 10 μg/ml, Collagen_L: 15 μg/ml, Collagen_H: 60 μg/ml. *p < 0.05, ****p < 0.0001. P-values were calculated using a two-tailed Student’s t-test. See also Figure S6 and Table S4.
Figure 7.
Figure 7.. Derivation of human FTW-XENs and cross-species comparisons.
(A) Schematic illustrating the derivation of FTW-hXENs from human naïve ESCs or EPSCs. (B) Representative BF images of human naïve ESCs and FTW-hXENs (P11). Scale bars, 100 μm. (C) Representative IF images showing the expression of XEN cell markers (GATA6, GATA4, SOX17, and FOXA2) in FTW-hXENs. Scale bars, 100 μm. (D) Left, A VENN diagram showing the conserved and species-specific expressed genes in FTW-mXENs, FTW-cyXENs, and FTW-hXENs. Right, GO term enrichment analysis of conserved genes (n=2608) in FTW-mXENs, FTW-cyXENs and FTW-hXENs. (E) Hub-gene-network analysis predicts several core FTW-XENs regulators. (F) qRT-PCR analysis of Gata4, Gata6, Sox17, Foxa2, Laminin, and Pdgfra expression in FTW-mXENs and FTW-cyXENs after knockdown of the Src, Pdgfr and Jak2. See also Figure S7 and Table S5.

Update of

References

    1. Evans MJ, and Kaufman MH (1981). Establishment in culture of pluripotential cells from mouse embryos. Nature 292, 154–156. 10.1038/292154a0. - DOI - PubMed
    1. Tanaka S, Kunath T, Hadjantonakis AK, Nagy A, and Rossant J (1998). Promotion of trophoblast stem cell proliferation by FGF4. Science 282, 2072–2075. 10.1126/science.282.5396.2072. - DOI - PubMed
    1. Kunath T, Arnaud D, Uy GD, Okamoto I, Chureau C, Yamanaka Y, Heard E, Gardner RL, Avner P, and Rossant J (2005). Imprinted X-inactivation in extra-embryonic endoderm cell lines from mouse blastocysts. Development 132, 1649–1661. 10.1242/dev.01715. - DOI - PubMed
    1. Zhong Y, Choi T, Kim M, Jung KH, Chai YG, and Binas B (2018). Isolation of primitive mouse extraembryonic endoderm (pXEN) stem cell lines. Stem Cell Res 30, 100–112. 10.1016/j.scr.2018.05.008. - DOI - PubMed
    1. Cui T, Jiang L, Li T, Teng F, Feng G, Wang X, He Z, Guo L, Xu K, Mao Y, et al. (2019). Derivation of Mouse Haploid Trophoblast Stem Cells. Cell Reports 26, 407–414.e405. 10.1016/j.celrep.2018.12.067. - DOI - PubMed