. 2024 Feb;626(7998):419-426.
doi: 10.1038/s41586-023-06906-8. Epub 2023 Dec 5.

Reverse metabolomics for the discovery of chemical structures from humans

Affiliations

Reverse metabolomics for the discovery of chemical structures from humans

Emily C Gentry et al. Nature. 2024 Feb.

Abstract

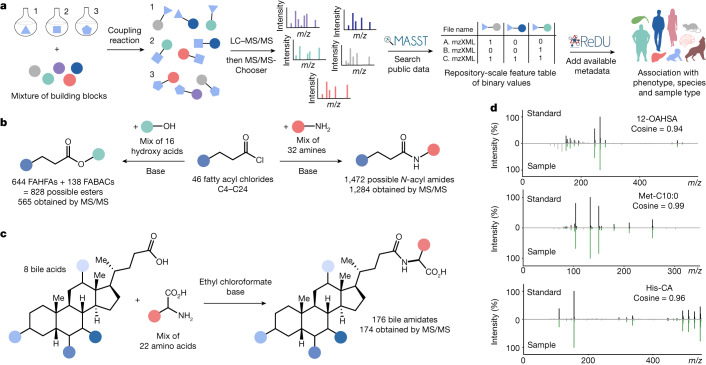
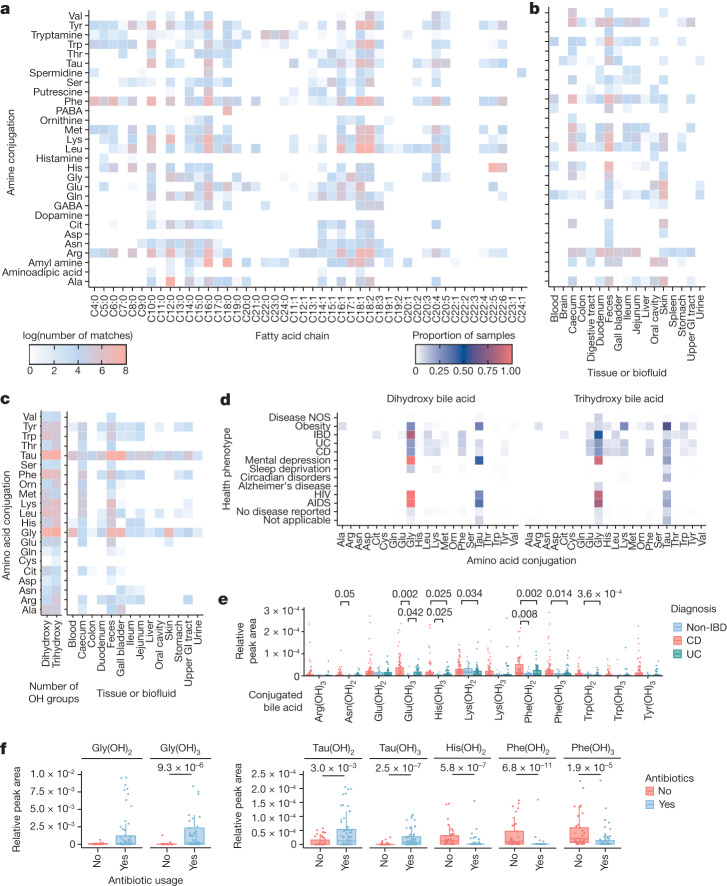
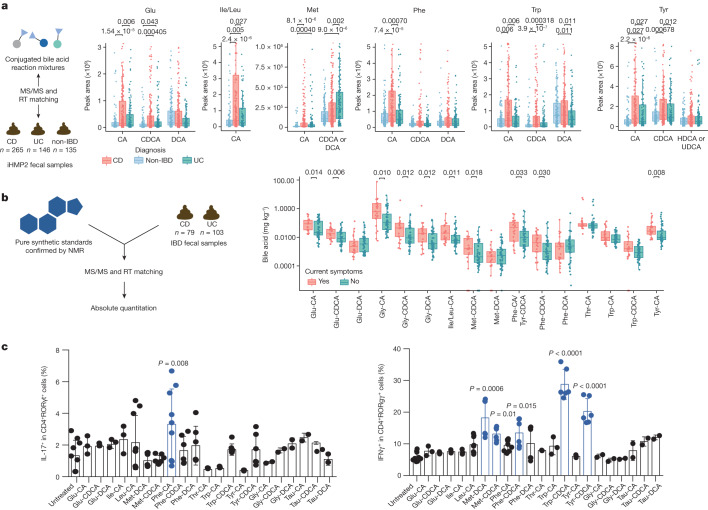
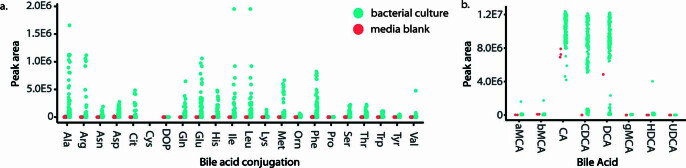
Determining the structure and phenotypic context of molecules detected in untargeted metabolomics experiments remains challenging. Here we present reverse metabolomics as a discovery strategy, whereby tandem mass spectrometry spectra acquired from newly synthesized compounds are searched for in public metabolomics datasets to uncover phenotypic associations. To demonstrate the concept, we broadly synthesized and explored multiple classes of metabolites in humans, including N-acyl amides, fatty acid esters of hydroxy fatty acids, bile acid esters and conjugated bile acids. Using repository-scale analysis1,2, we discovered that some conjugated bile acids are associated with inflammatory bowel disease (IBD). Validation using four distinct human IBD cohorts showed that cholic acids conjugated to Glu, Ile/Leu, Phe, Thr, Trp or Tyr are increased in Crohn's disease. Several of these compounds and related structures affected pathways associated with IBD, such as interferon-γ production in CD4+ T cells3 and agonism of the pregnane X receptor4. Culture of bacteria belonging to the Bifidobacterium, Clostridium and Enterococcus genera produced these bile amidates. Because searching repositories with tandem mass spectrometry spectra has only recently become possible, this reverse metabolomics approach can now be used as a general strategy to discover other molecules from human and animal ecosystems.


Conflict of interest statement

P.C.D. is on the scientific advisory board of Sirenas and Cybele Microbiome, and is founder and scientific advisor and has equity in Ometa Labs, Arome and Enveda (with approval by UC San Diego). M.W. is a co-founder and had equity in Ometa Labs. R.K. Gencirq (stock and SAB member), DayTwo (consultant and SAB member), Cybele (stock and consultant), Biomesense (stock, consultant, SAB member), Micronoma (stock, SAB member, co-founder) and Biota (stock, co-founder). No competing interests exist for E.C.G., S.L.C., M.P., P.B.-F., A.K.S., M.C.T., H.L., S.Z., T.Y., J.A.-P., D.R.P., A.T.A., A.K.J., F.H., M.S.-N., H.V., A.N.A., B.B., A.H., N.V.C., F.J.G., C.B.C., R.J.X., H.C., E.S.B., A.D.P. and D.S.

Figures

Fig. 1
Fig. 1. Overview of reverse metabolomics and the synthetic strategies used to obtain standards for MS/MS in this work.
The reverse metabolomics portion starts with MS/MS to associate with sample information (phenotype, species and sample type), whereas the synthesis portion is an approach to obtain the MS/MS spectra. a, Workflow for the reverse metabolomics strategy using LC–MS/MS and MASST and ReDU data analyses tools and platforms. b, Synthesis scheme for acyl amides and esters. FAHFA, fatty acid ester of hydroxy fatty acid. c, Combinatorial bile acid conjugation reaction performed for the discovery of bile amidates. d, Representative mirror plots of example MS/MS matches of one of the synthesized standards for each class of molecule with MS/MS data in the public domain.
Fig. 2
Fig. 2. Repository-scale analysis of public MS data.
a, Heatmap representing the log value of spectral matches for 1,472 N-acyl amides in the entire GNPS metabolomics repository. b, Heatmap showing the log value of unique MS/MS spectral matches for each amine conjugation in different tissues and biofluids using GNPS public data with metadata available in ReDU. GI, gastrointestinal. c, Heatmap showing the log value of unique spectral matches for conjugated bile acids across different tissues and biofluids using GNPS public data with metadata available in ReDU. d, Heatmap showing the proportion of samples that each MS/MS-synthesized bile acid was detected for health phenotypes across the public metabolomics repositories that have metadata available in ReDU. Disease NOS, disease not otherwise specified. From top to bottom for health phenotype, n = 1,556, n = 679, n = 84, n = 144, n = 207, n = 46, n = 713, n = 317, n = 195, n = 56, n = 59, n = 13,108 and n = 6,092. e, Relative MS1 abundance of conjugated bile acids across clinical groups in the public project with MassIVE MS repository accession number MSV000084908 (data collected using an Orbitrap, positive mode). CD, n = 103; UC, n = 60. f, Relative MS1 abundance of conjugated bile acids in relation to antibiotic usage in data from a paediatric IBD cohort deposited as MSV000088735 (data collected using an Orbitrap, positive mode). Antibiotic use, n = 72; no antibiotic use, n = 45. For df, boxplots show first (lower) quartile, median, and third (upper) quartile and whiskers are 1.5 times the interquartile range. Significance was tested using a pairwise two-sided Wilcoxon rank-sum test. Only P values 0.05 or less are shown, which were adjusted using Benjamini–Hochberg correction. Source Data
Fig. 3
Fig. 3. IBD association of new conjugated bile acids.
a, Examples of retention time (RT) matching and MS/MS spectra of a standard to a pooled fraction for which only one isomer matched by retention time (for example, the Glu-CA conjugate) and for which isomers could not be resolved (for example, Tyr-HDCA acid and Tyr-UDCA). This dataset was collected using a Q-Exactive in negative mode (accession number MSV000087562). Relative peak area abundances of selected bile acids that were higher in patients CD (red) and/or in patients with UC (green) compared with individuals without IBD (blue) in the iHMP2 study, as determined by pairwise two-sided Wilcoxon tests. This is a re-analysis of data collected using a Orbitrap, negative mode (Metabolomics Workbench data repository accession numbers PR000639 and PR000677). Boxplots show first (lower) quartile, median and third (upper) quartile with whiskers as 1.5 times the interquartile range. Significance is shown as Benjamini–Hochberg corrected P values. CD, n = 265; non-IBD, n = 135; UC, n = 146 b, Concentrations of conjugated bile acids in fecal samples from individuals with active (n = 23) or inactive (n = 72) Crohn’s disease. Values on the y axis represent mg of bile acid per kg of fecal matter. This dataset was collected using a Q-TOF in positive mode (accession number MSV000092337). Boxes represent the interquartile range, centre line is the median and whiskers are 1.5 times the interquartile range. P values < 0.05 by one-sided Wilcoxon test are shown. c, Flow cytometric quantification of IL-17 (left) and IFNγ (right) production in naive CD4+ T cells from Foxp3-hCD2 reporter mice. Cells were treated with 100 µM of bile acids on day 0 and CD4+ T cells were gated for analyses on day 3. n = 6 for controls and n > 3 for biologically independent samples for every substrate tested. Bar plot shows mean and error bars represent s.d. One-way Kruskal-Wallis test provided significance. Source Data
Fig. 4
Fig. 4. Bile acid conjugations observed in HMP isolates cultured in fecal growth medium containing CA and DCA.
Each strain was cultured in duplicate. a, Representative chomatography and MS/MS spectrum for the LC–MS/MS data of microbes cultured with bile acids, in comparison to the synthetic standards. b, Scatter plot for positive-mode LC–MS/MS data showing bile acid abundance across phylogenetic classes of bacteria using feature intensities. b, Peak area abundance of conjugated bile acids in culture samples at the genus level. Orn, ornitine. c, Peak area abundance compared with controls. d, Representative retention and drift time for IMS-MS data. e, Scatter plots for IMS-MS data collected in negative mode showing bile acid abundance across bacterial genera, organized according to the phylogenetic tree shown and coloured according to their bacterial phylum. Those not specified are unclassified Lachnospiraceae. Source Data
Extended Data Fig. 1
Extended Data Fig. 1. Representative fragmentation of standard vs observed MS/MS in public data with key fragment ions shown.
a) Fatty acid esters of hydroxy fatty acids (FAHFAs) b) N-acyl amides c) trihydroxylated bile acids d) dihydroxylated bile acids.
Extended Data Fig. 2
Extended Data Fig. 2. Results of MASST searches for N-acyl amides.
a) Pie chart representing sample types in which the spectra of synthesized amides were detected in ReDU. b) Heatmap representing log(number of spectral matches) across different sample types, organized by fatty acid chain identity. c) Heatmap showing the proportion of samples where N-acyl amides were detected in different health-related phenotypes (all the matches to the IBD was from a longitudinal study of a single person).
Extended Data Fig. 3
Extended Data Fig. 3. Results of MASST searches for acyl esters.
a) Representative heatmap showing log(number of spectral matches) across unique synthesized acyl esters. b) Pie chart representing the number of spectra for synthesized esters detected in different sample types from ReDU. c) Heatmap representing log(number of spectral matches) for acyl esters across different tissue types. Source Data
Extended Data Fig. 4
Extended Data Fig. 4. Analysis of synthetic conjugated bile acid mixtures.
a) Comparison of amino acid distributions for MASST searches of Orbitrap (Thermo QE) vs. Q-ToF (Bruker MaXis) data in positive ionization mode. b) Quantification of conjugated bile acids in healthy human fecal samples (n = 15). Boxplots show first (lower) quartile, median, and third (upper) quartile, whiskers extend from the minimum to maximum values and the centre line indicates the median. c) Principal coordinates analysis (PCoA) plot using binary Jaccard distances for sample compositions of synthesized conjugated bile acids, which excludes Gly and Tau amidates. Source Data
Extended Data Fig. 5
Extended Data Fig. 5. Independent validation of new conjugated bile acids in PRISM human IBD cohort.
a) Peak area abundances of conjugated bile acids detected in longitudinal PRISM dataset. Boxplots show first (lower) quartile, median, and third (upper) quartile and whiskers are 1.5 times the interquartile range. n for Crohn’s disease (CD) = 68, n for non-IBD = 34 and n for ulcerative colitis (UC) = 53. b) Peak area abundances of selected bile acids that were higher in Crohn’s and/or Ulcerative Colitis patients relative to non-IBD individuals, as determined by pairwise two-sided Wilcoxon tests. Only significant values are shown, which were calculated using a Benjamini-Hochberg correction. Boxplots show first (lower) quartile, median, and third (upper) quartile and whiskers are 1.5 times the interquartile range. n for CD = 68, n for non-IBD = 34 and n for UC = 53. Source Data
Extended Data Fig. 6
Extended Data Fig. 6. Overview of conjugated bile acids in iHMP2 human IBD cohort.
a) Peak area abundances of conjugated bile acids in the iHMP2 dataset. Boxplots show first (lower) quartile, median, and third (upper) quartile and whiskers are 1.5 times the interquartile range. n for CD = 265, n for non-IBD = 135 and n for UC = 146. b) Concentrations of conjugated bile acids in fecal samples from ulcerative colitis patients whose symptoms are active or inactive. Pairwise two-sided Wilcoxon tests were performed and no significant p-values were found. Boxplots show first (lower) quartile, median, and third (upper) quartile and whiskers are 1.5 times the interquartile range. n for CD = 265, n for non-IBD = 135 and n for UC = 146.
Extended Data Fig. 7
Extended Data Fig. 7. PXR activity of conjugated bile acids.
a) PXR agonism at 10 (left) and 50μM (right) concentrations of the 15 new conjugated bile acids in the iHMP2 dataset, reported as normalized luciferase luminescence (a.u.). Top 15 bile acids were chosen based on the upper value of their interquartile range. Each concentration was run in biological quadruplicates for every substrate tested. Rifampicin, a known PXR agonist, was used as a positive control for comparison. Thr-CA significantly increases PXR agonism versus rifampicin (p = 0.0019) using a one-way ANOVA test. Data is represented as mean values +/− SD. b) Concentration dependence of PXR activity for top candidate agonists compared to Rifampicin, n = 5 for control and n = 4 for each bile acid concentration tested. Data represented as mean values +/− SD. c) Gene expression analysis of Cyp3a11 in small intestinal organoids after exposure to conjugated bile acids at varying concentrations. Compounds are colored as Glu-CA (red), Glu-CDCA (orange), rifampicin (gray). Significance was calculated using one-way ANOVA, n = 4 biological replicates for each concentration tested, data represented as mean values +/− SD. Source Data
Extended Data Fig. 8
Extended Data Fig. 8. LC-IMS-MS Analysis of Bacterial Cultures.
a) Peak area abundances of conjugated bile acids in bacterial cultures vs. media blanks. b) Peak area abundances for unconjugated bile acids in bacterial cultures vs. media blanks.

References

    1. Wang, M. et al. Mass spectrometry searches using MASST. Nat. Biotechnol.38, 23–26 (2020). - PMC - PubMed
    1. Jarmusch, A. K. et al. ReDU: a framework to find and reanalyze public mass spectrometry data. Nat. Methods17, 901–904 (2020). - PMC - PubMed
    1. Rovedatti, L. et al. Differential regulation of interleukin 17 and interferon γ production in inflammatory bowel disease. Gut58, 1629–1636 (2009). - PubMed
    1. Cheng, J. et al. Therapeutic role of rifaximin in inflammatory bowel disease: clinical implication of human pregnane X receptor activation. J. Pharmacol. Exp. Ther.335, 32–41 (2010). - PMC - PubMed
    1. Aksenov, A. A., da Silva, R., Knight, R., Lopes, N. P. & Dorrestein, P. C. Global chemical analysis of biology by mass spectrometry. Nat. Rev. Chem.1, 0054 (2017).

MeSH terms