. 2024 Jan:238:109729.
doi: 10.1016/j.exer.2023.109729. Epub 2023 Dec 3.

Mouse model of radiation retinopathy reveals vascular and neuronal injury

Affiliations

Mouse model of radiation retinopathy reveals vascular and neuronal injury

Emily Liu et al. Exp Eye Res. 2024 Jan.

Abstract

Purpose: To characterize the neuronal and vascular pathology in vivo and in vitro in a mouse model of radiation retinopathy.

Methods: C57Bl/6J mice underwent cranial irradiation with 12 Gy and in vivo imaging by optical coherence tomography and of relative blood flow velocity by laser speckle flowgraphy for up to 3-6 months after irradiation. Retinal architecture, vascular density and leakage and apoptosis were analyzed by histology and immunohistochemistry before irradiation or at 10, 30, 240, and 365 days after treatment.

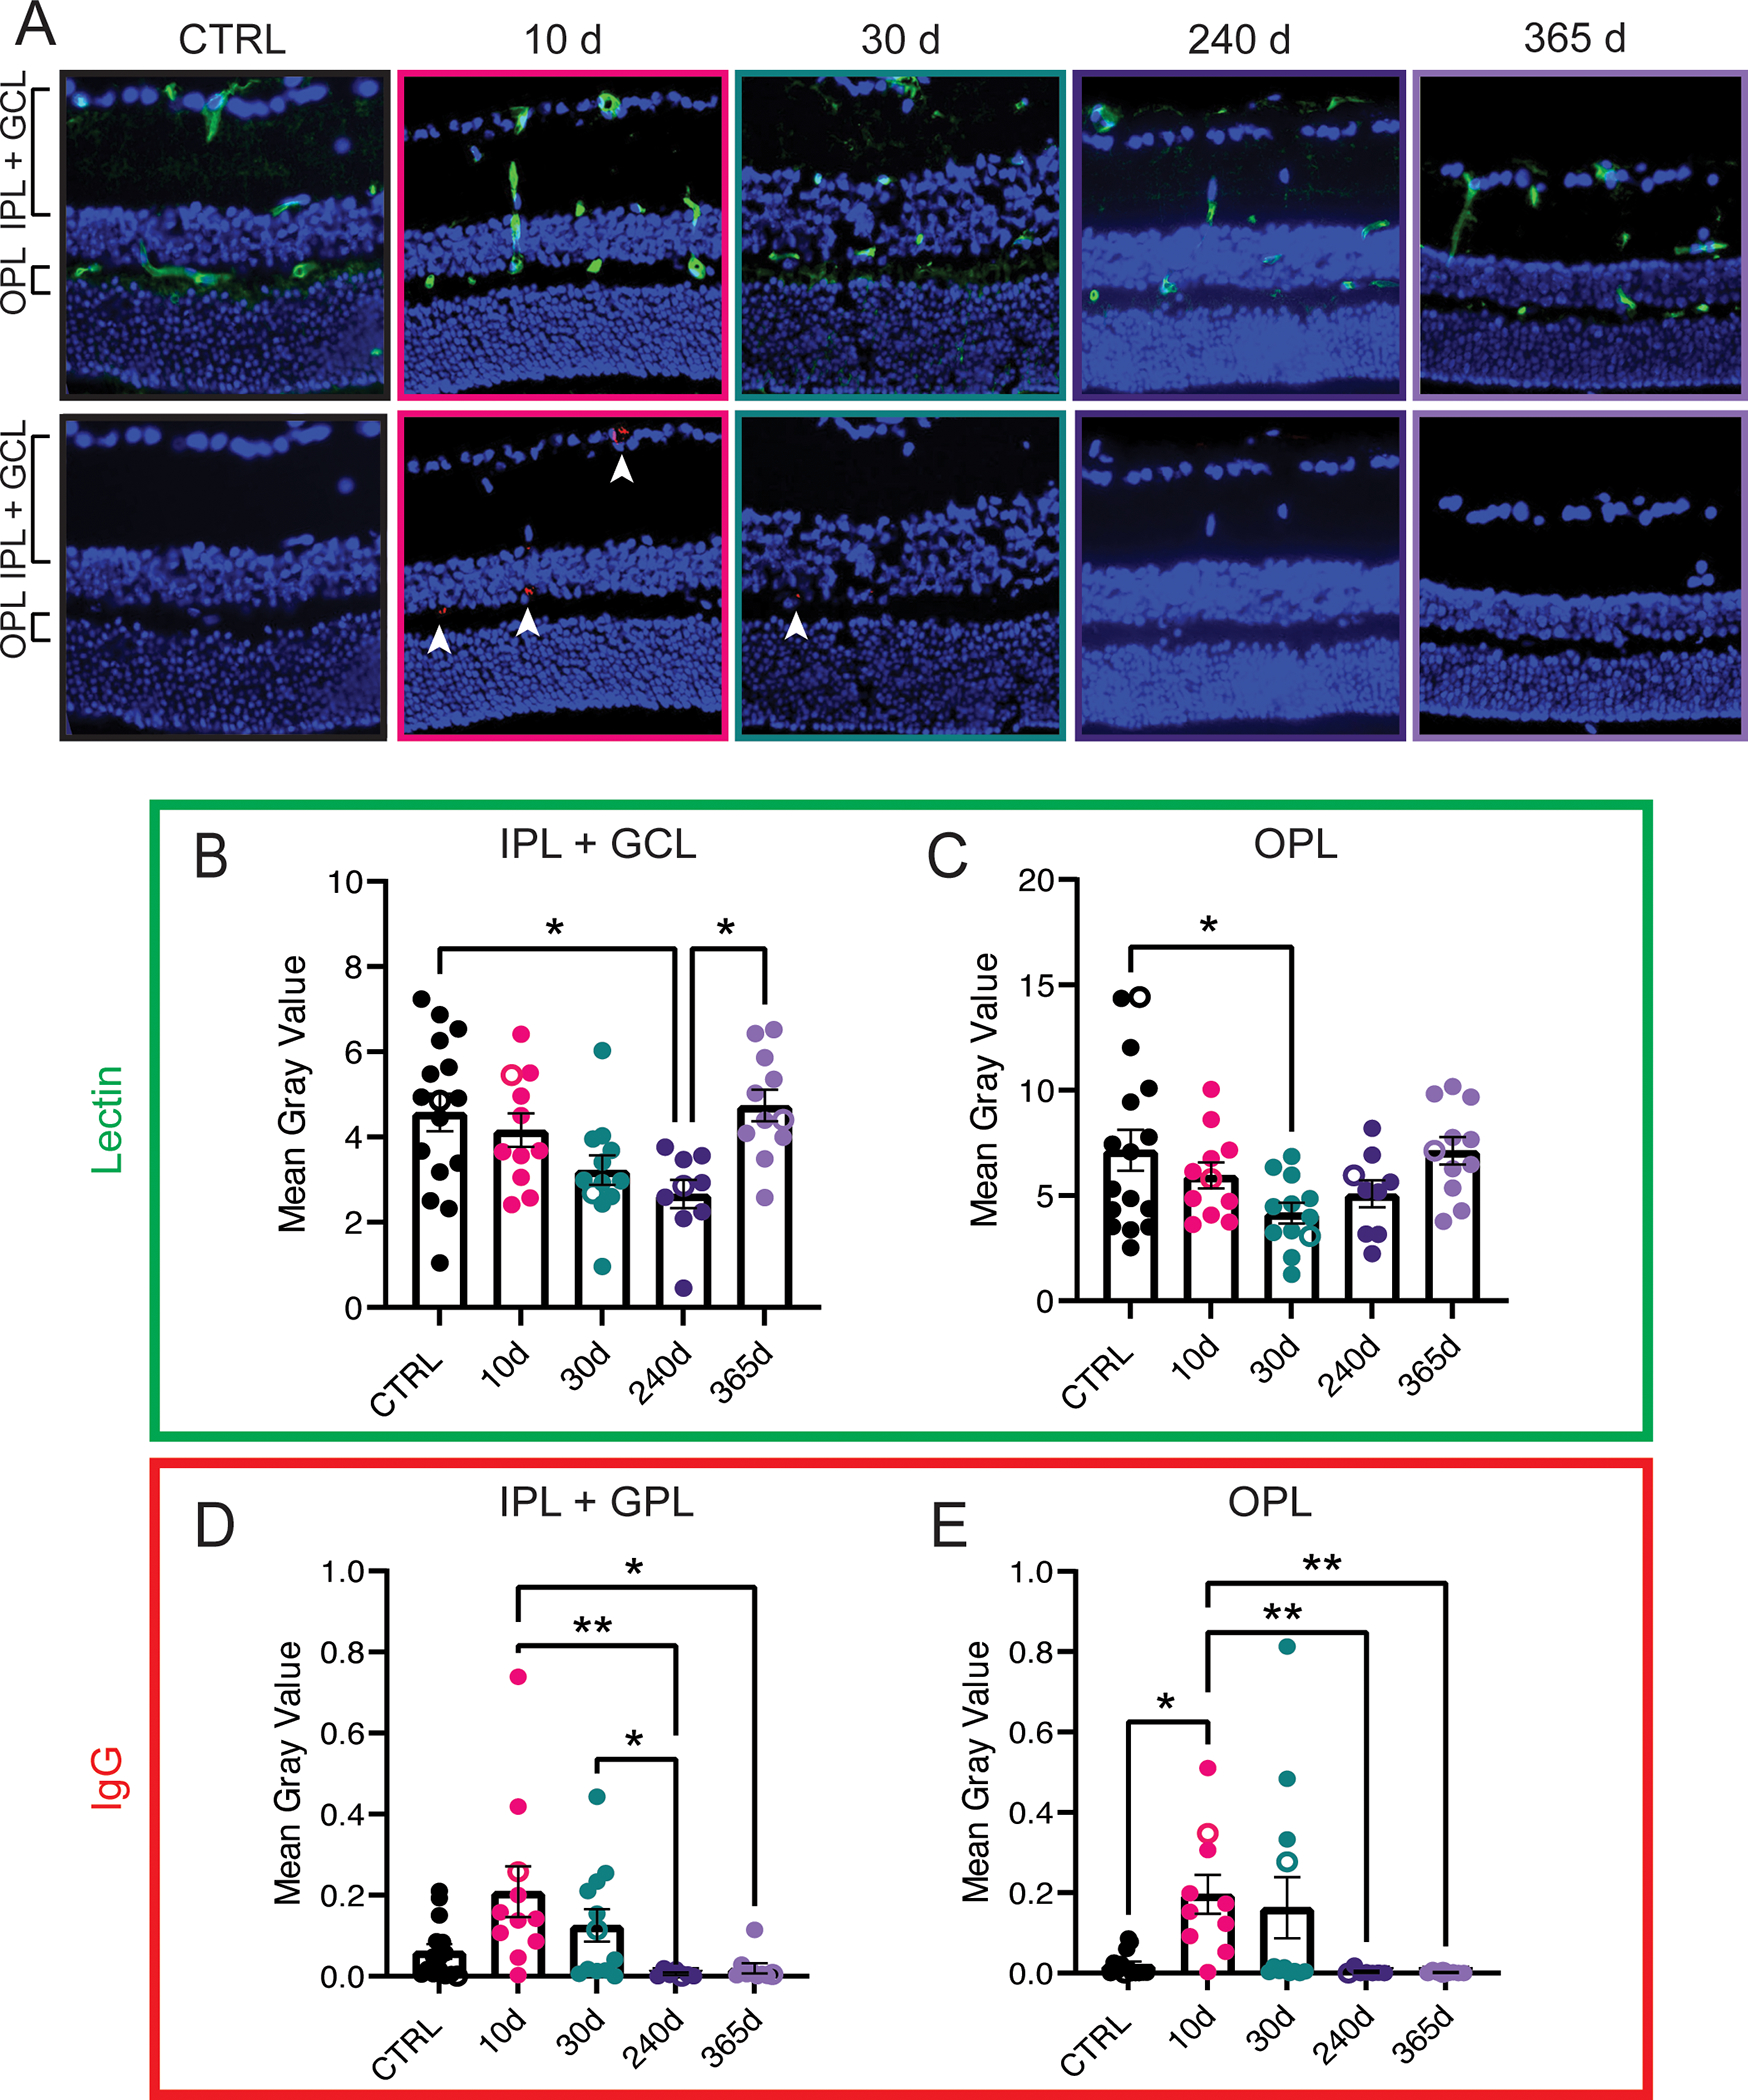
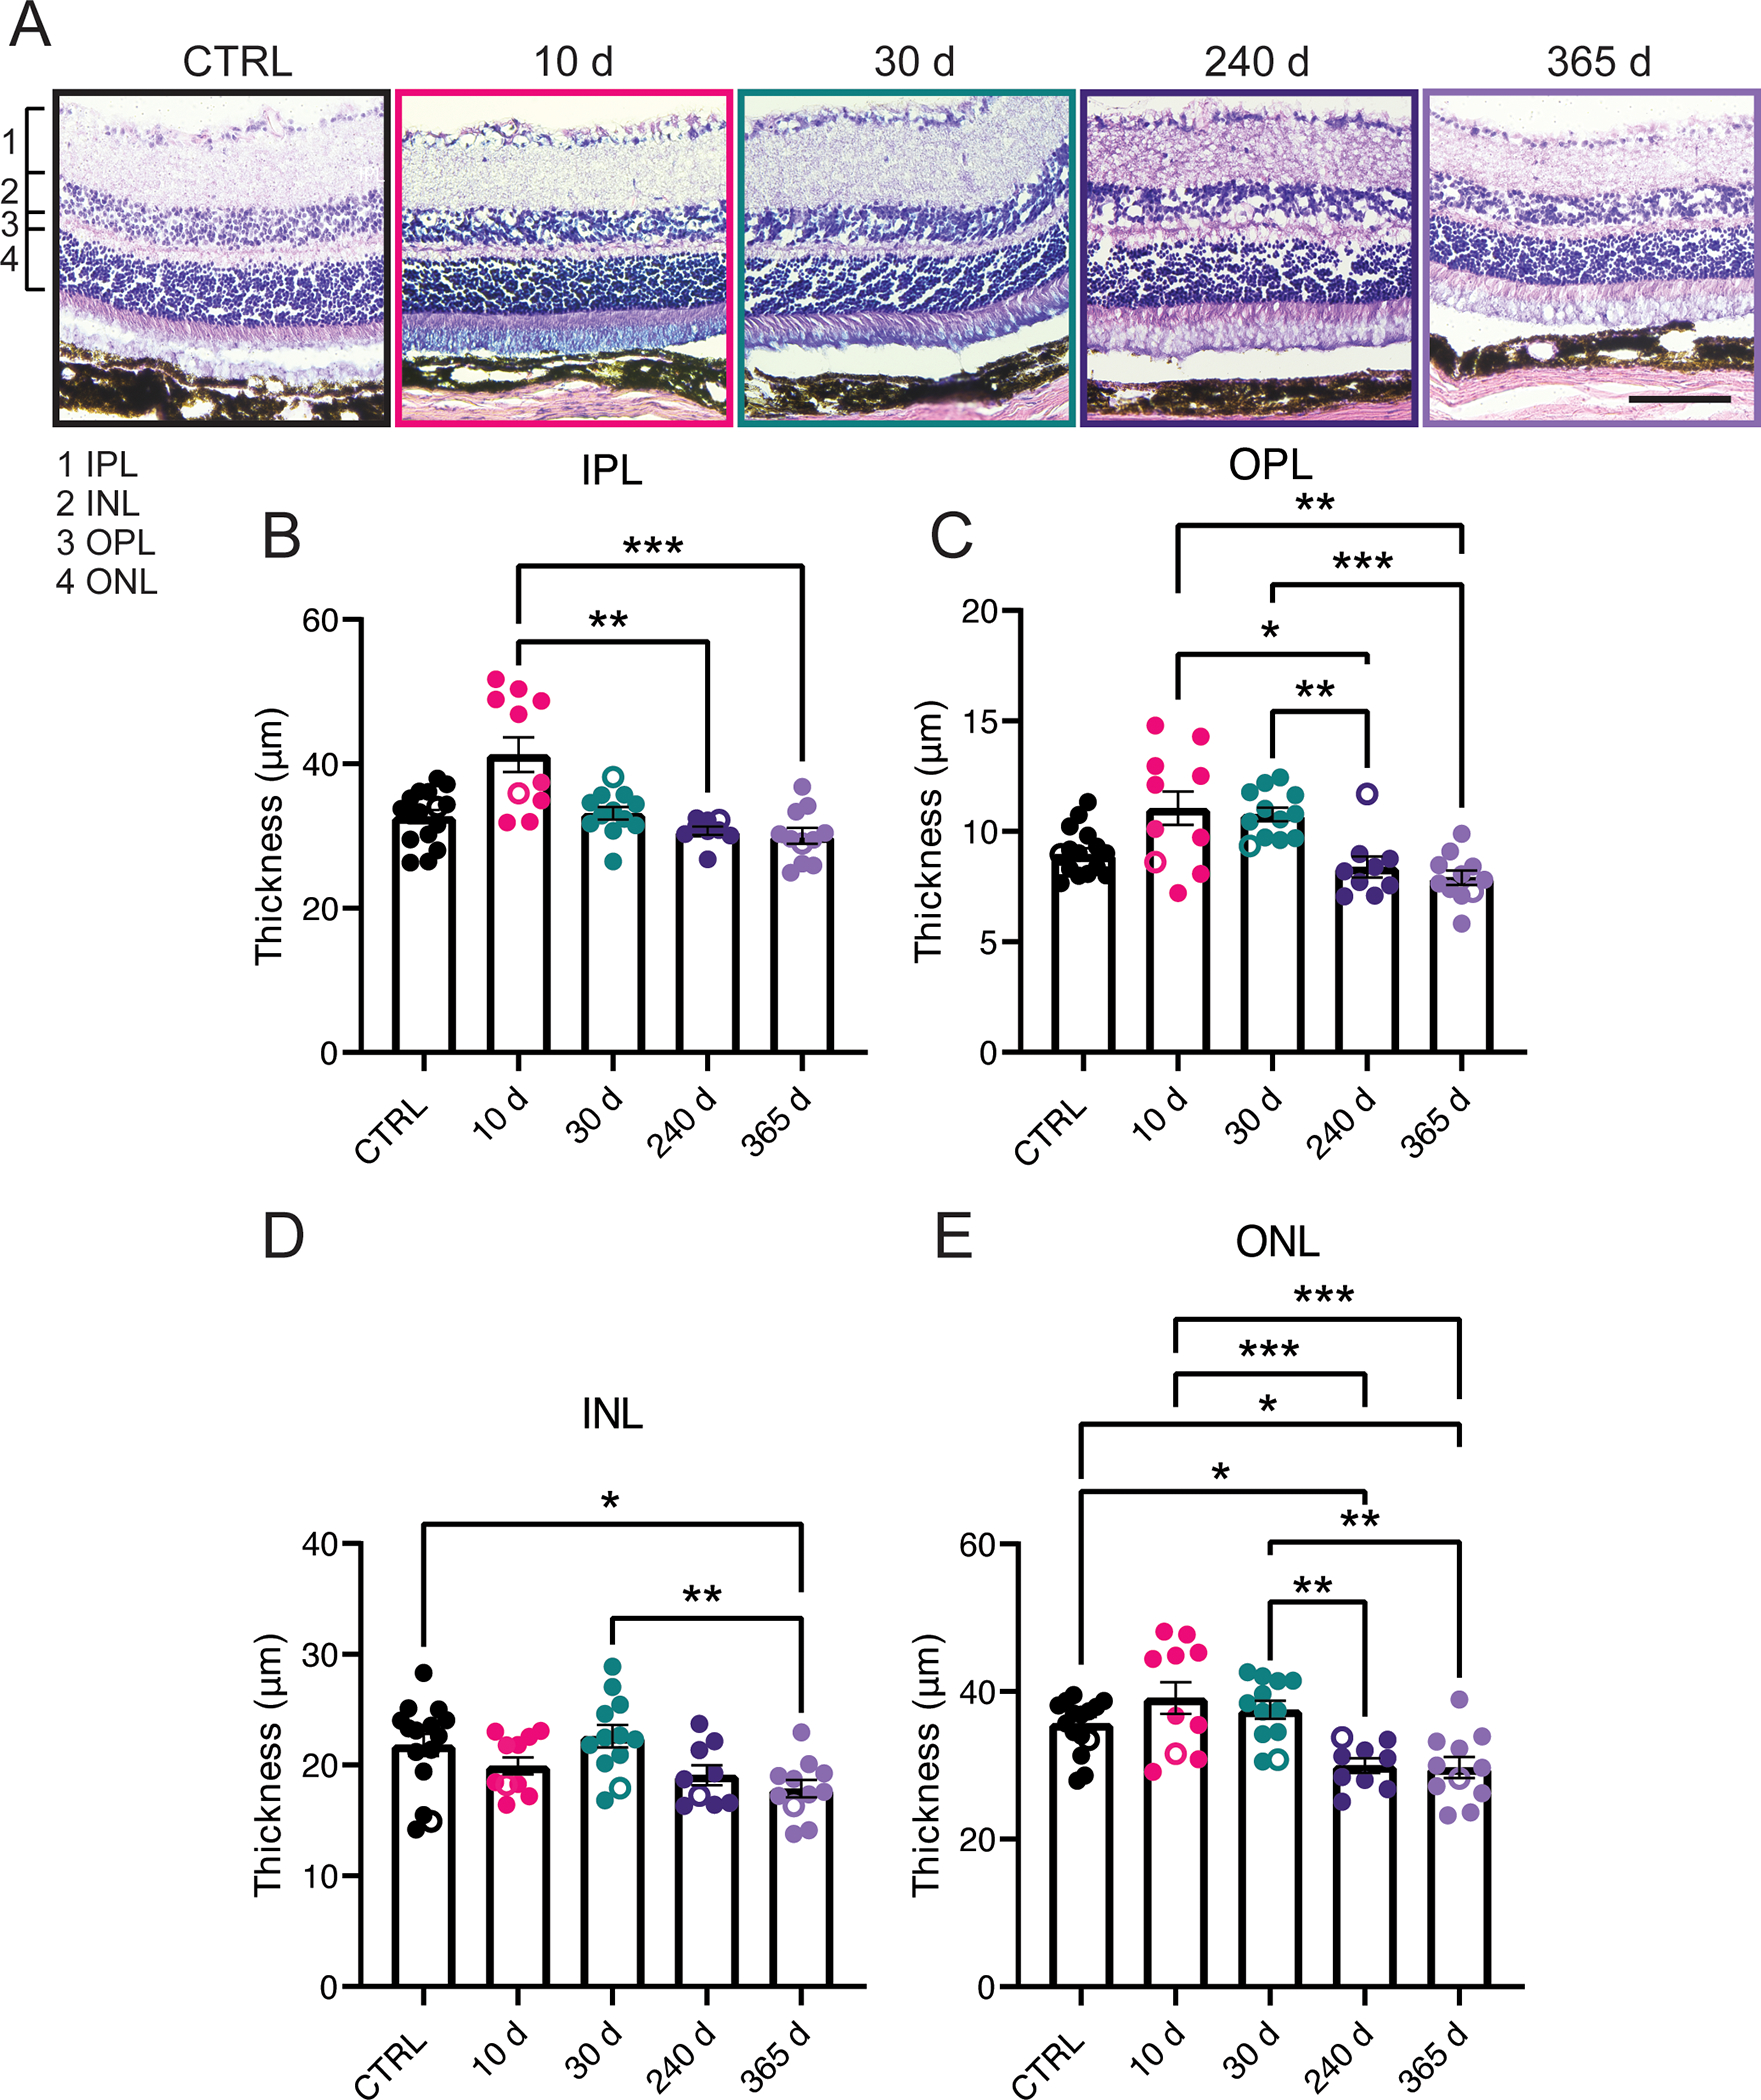
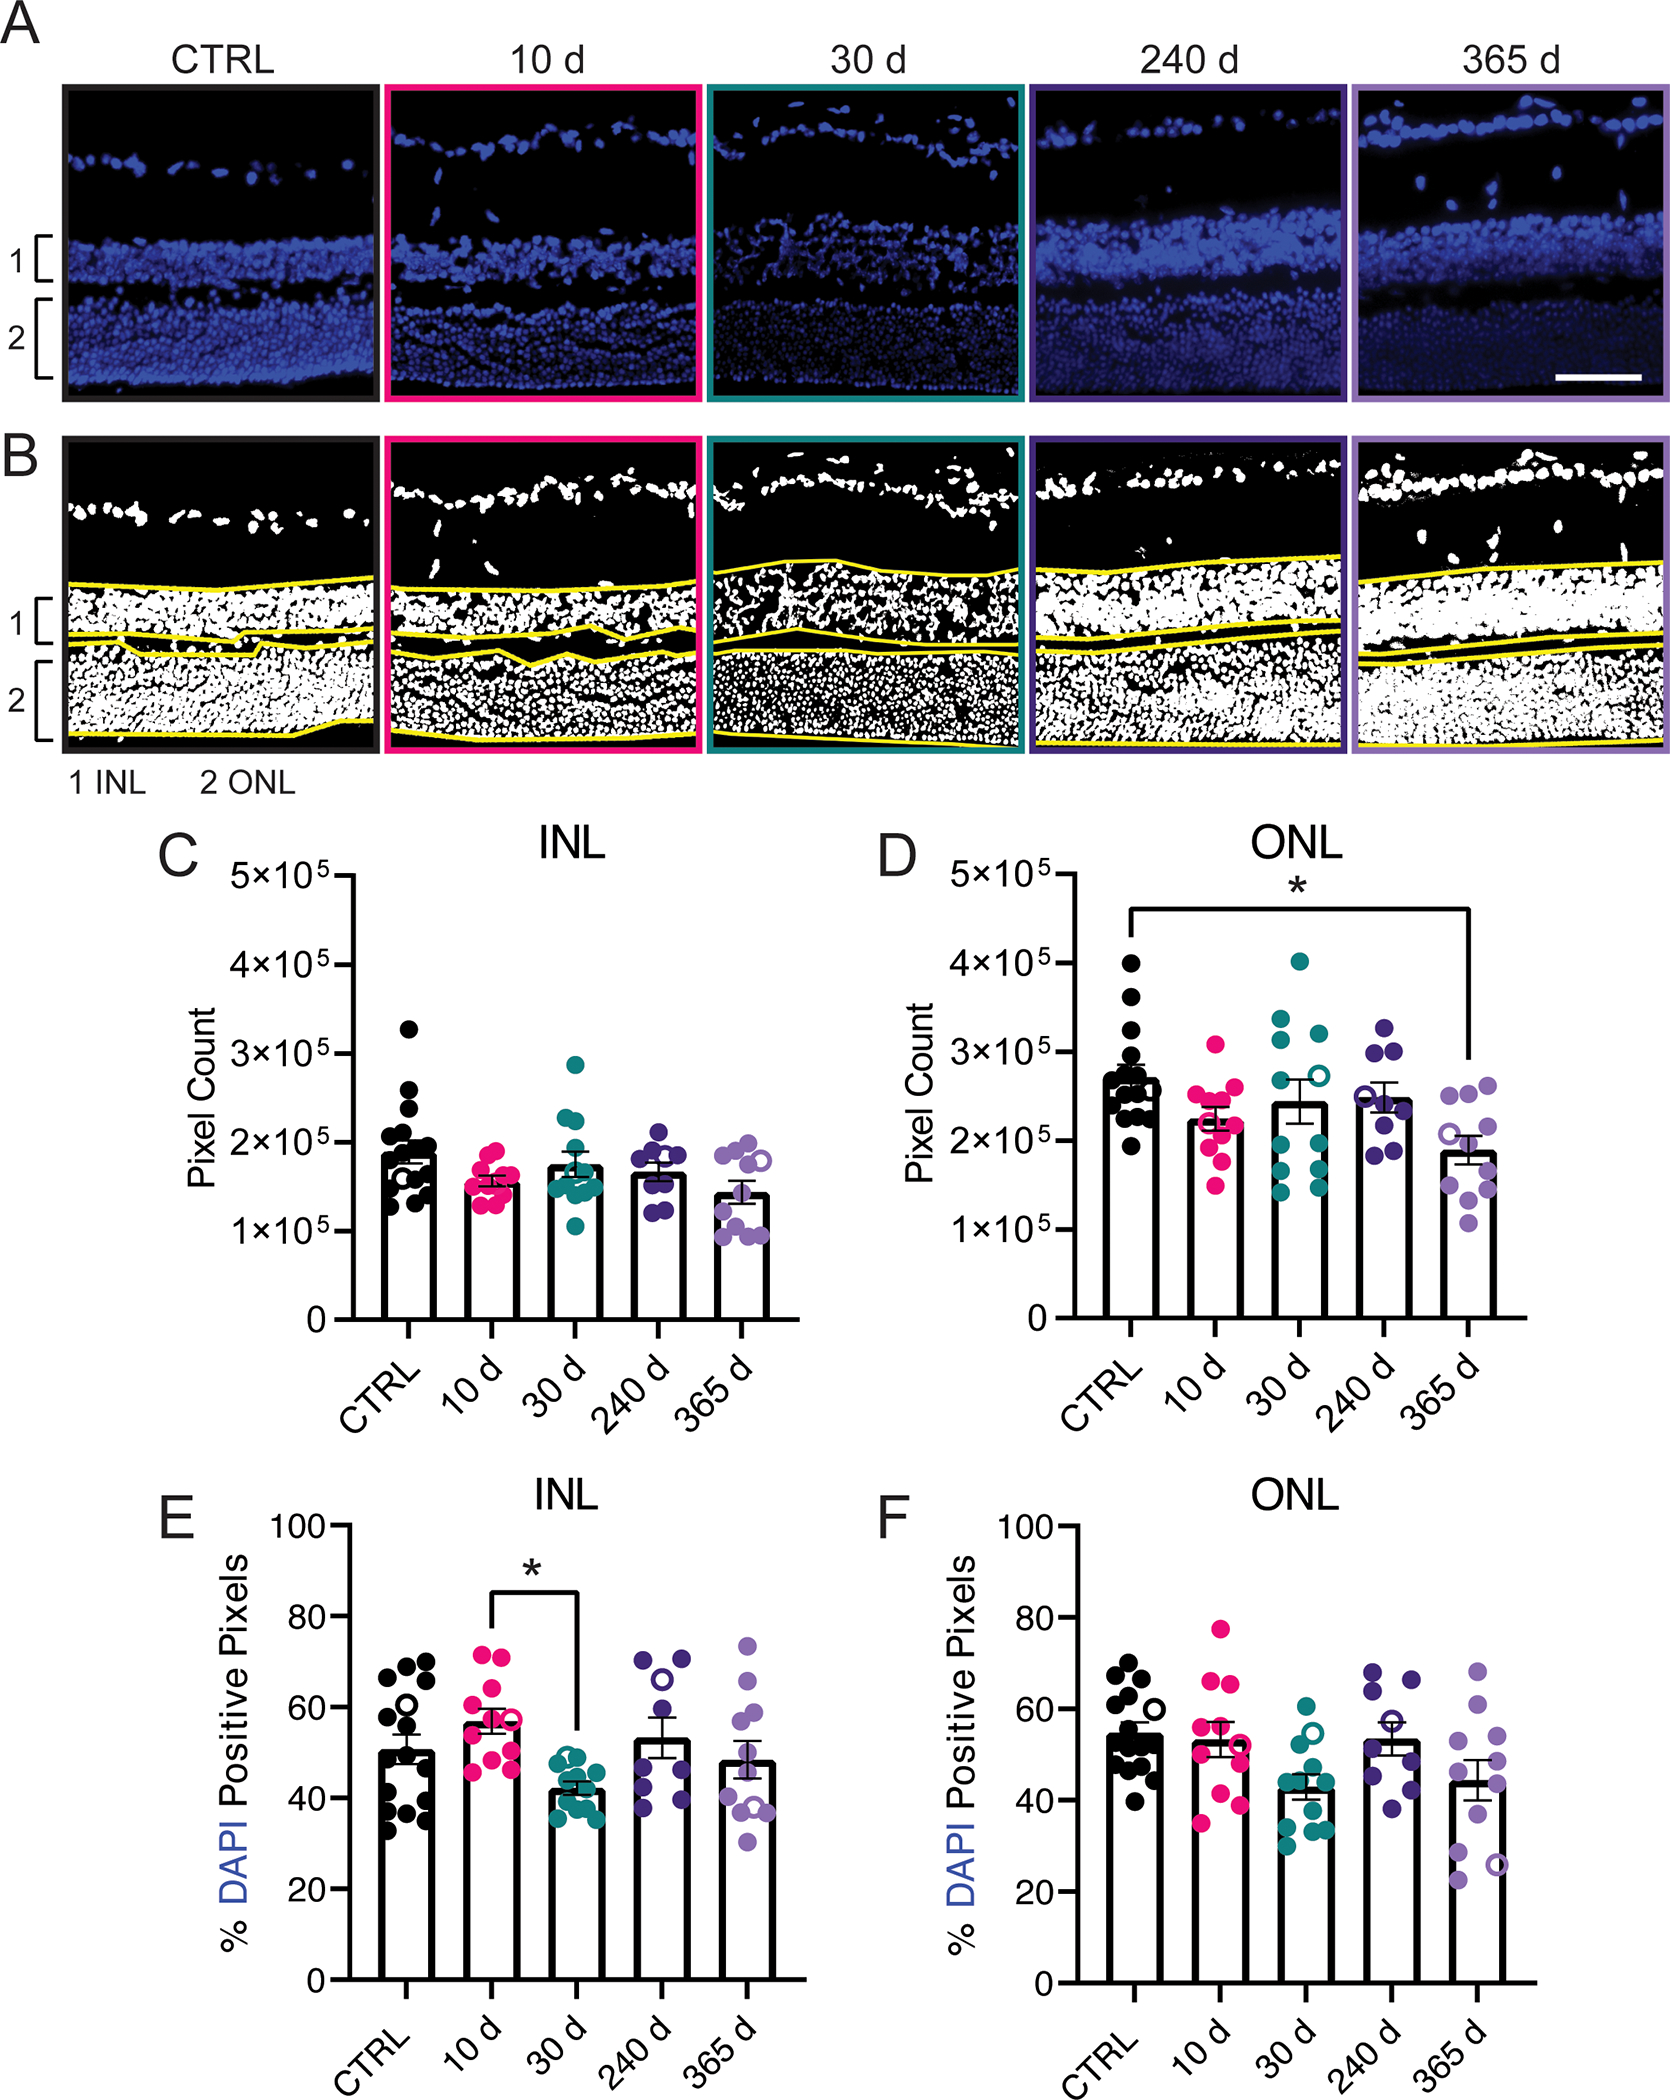
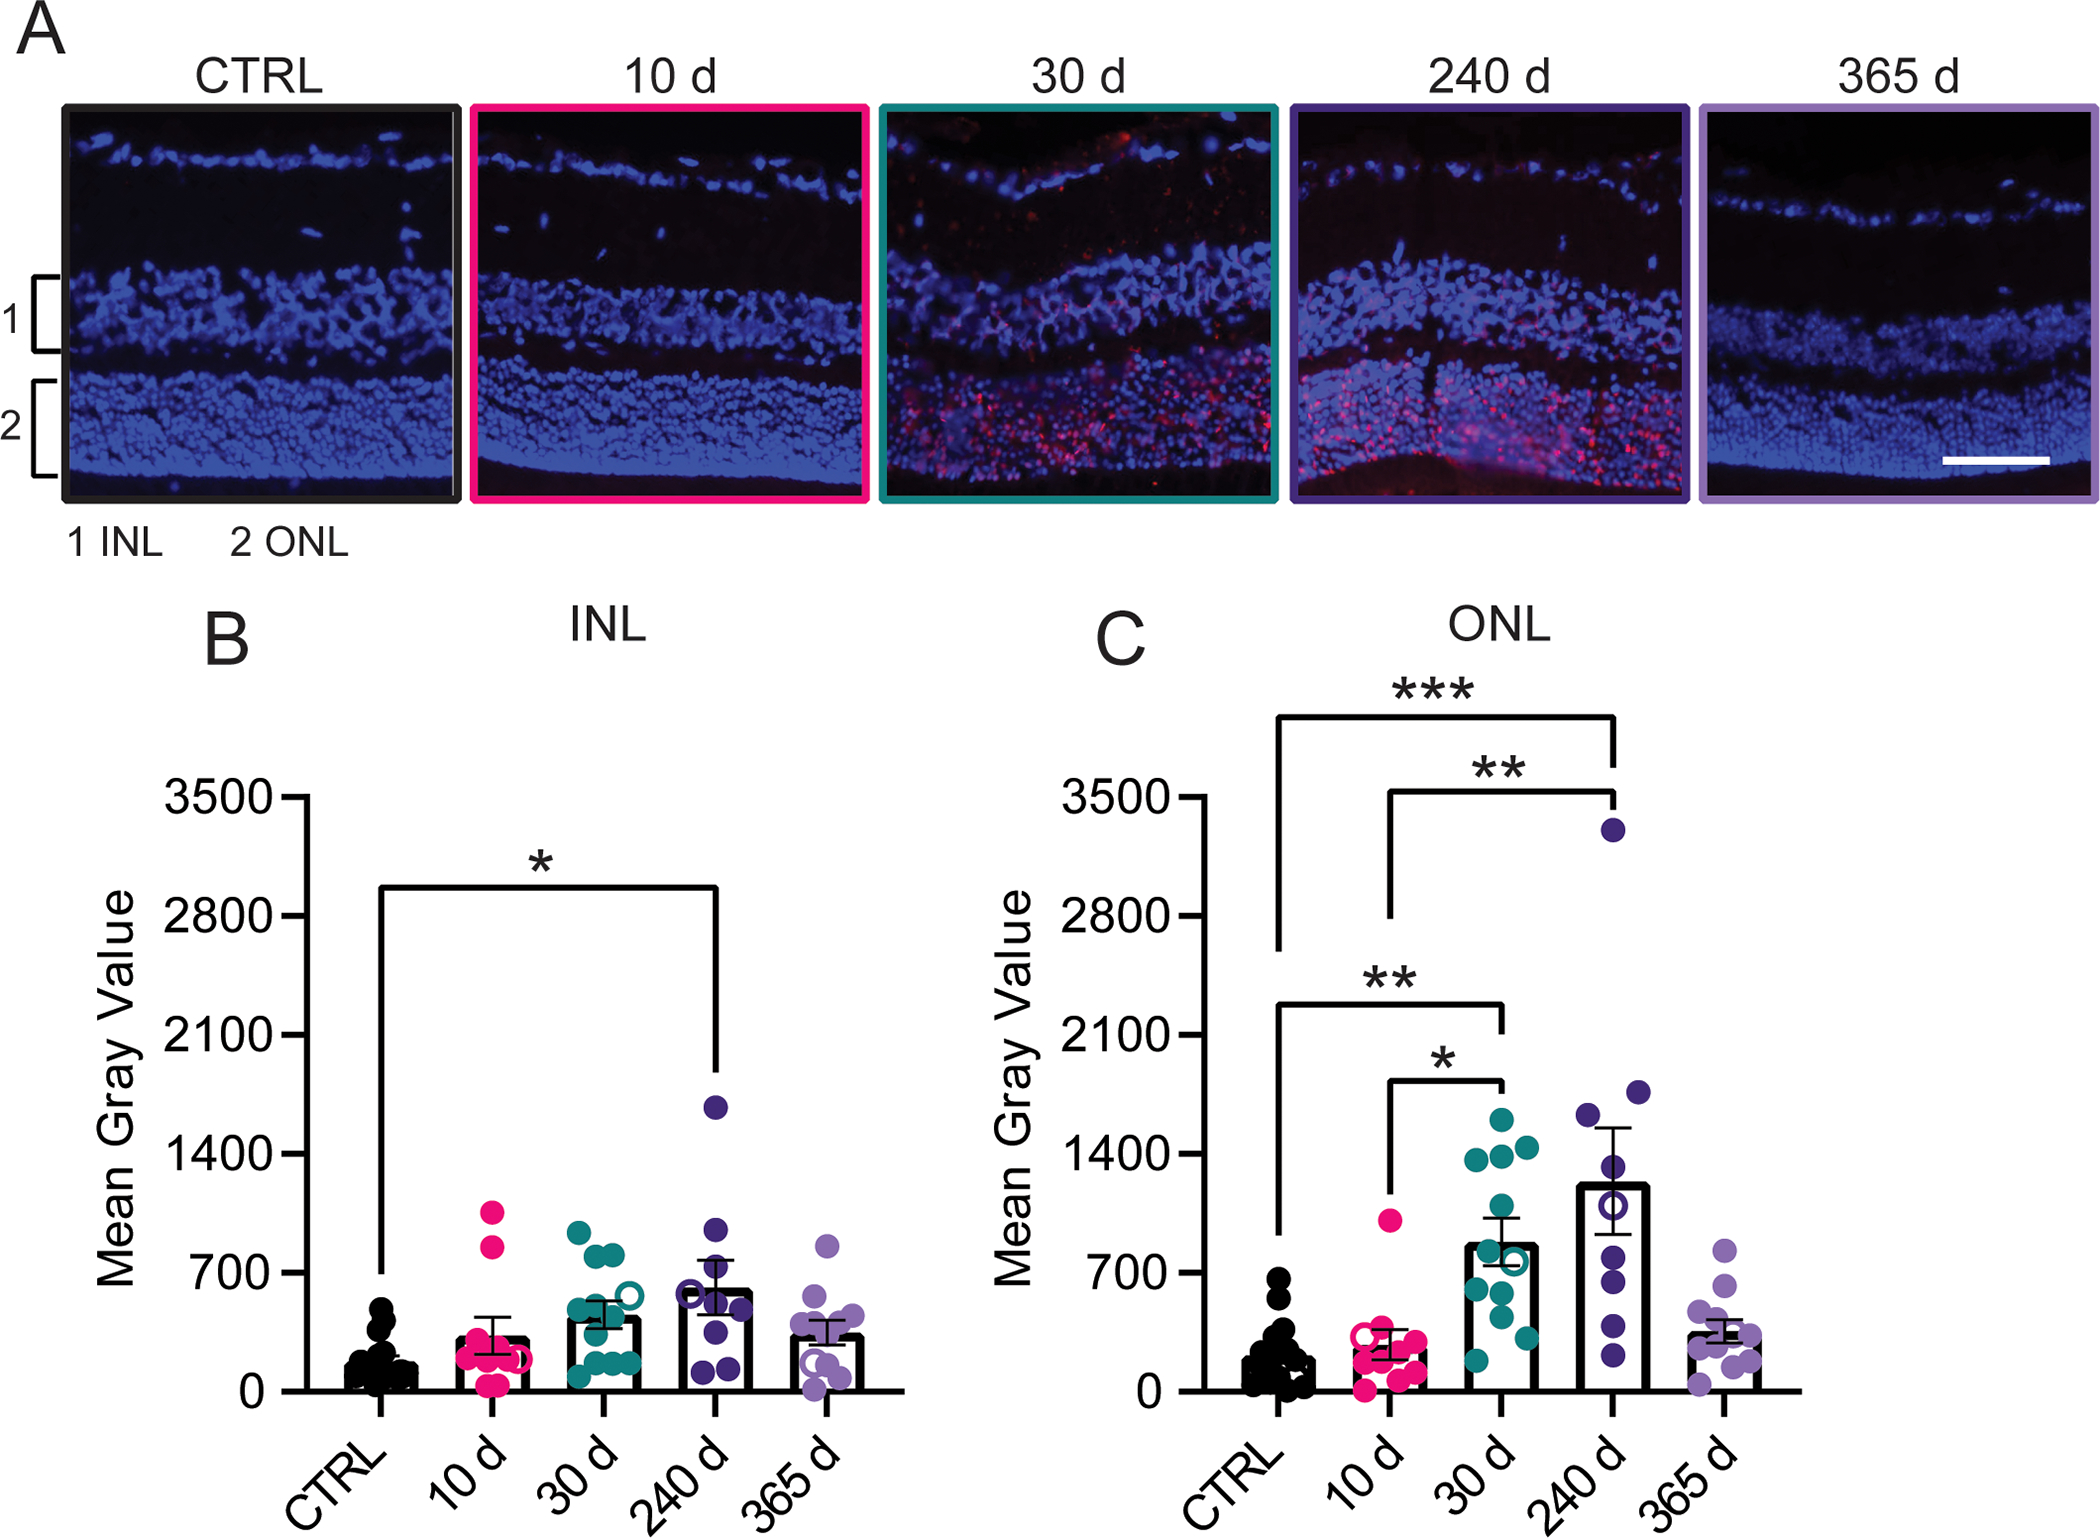
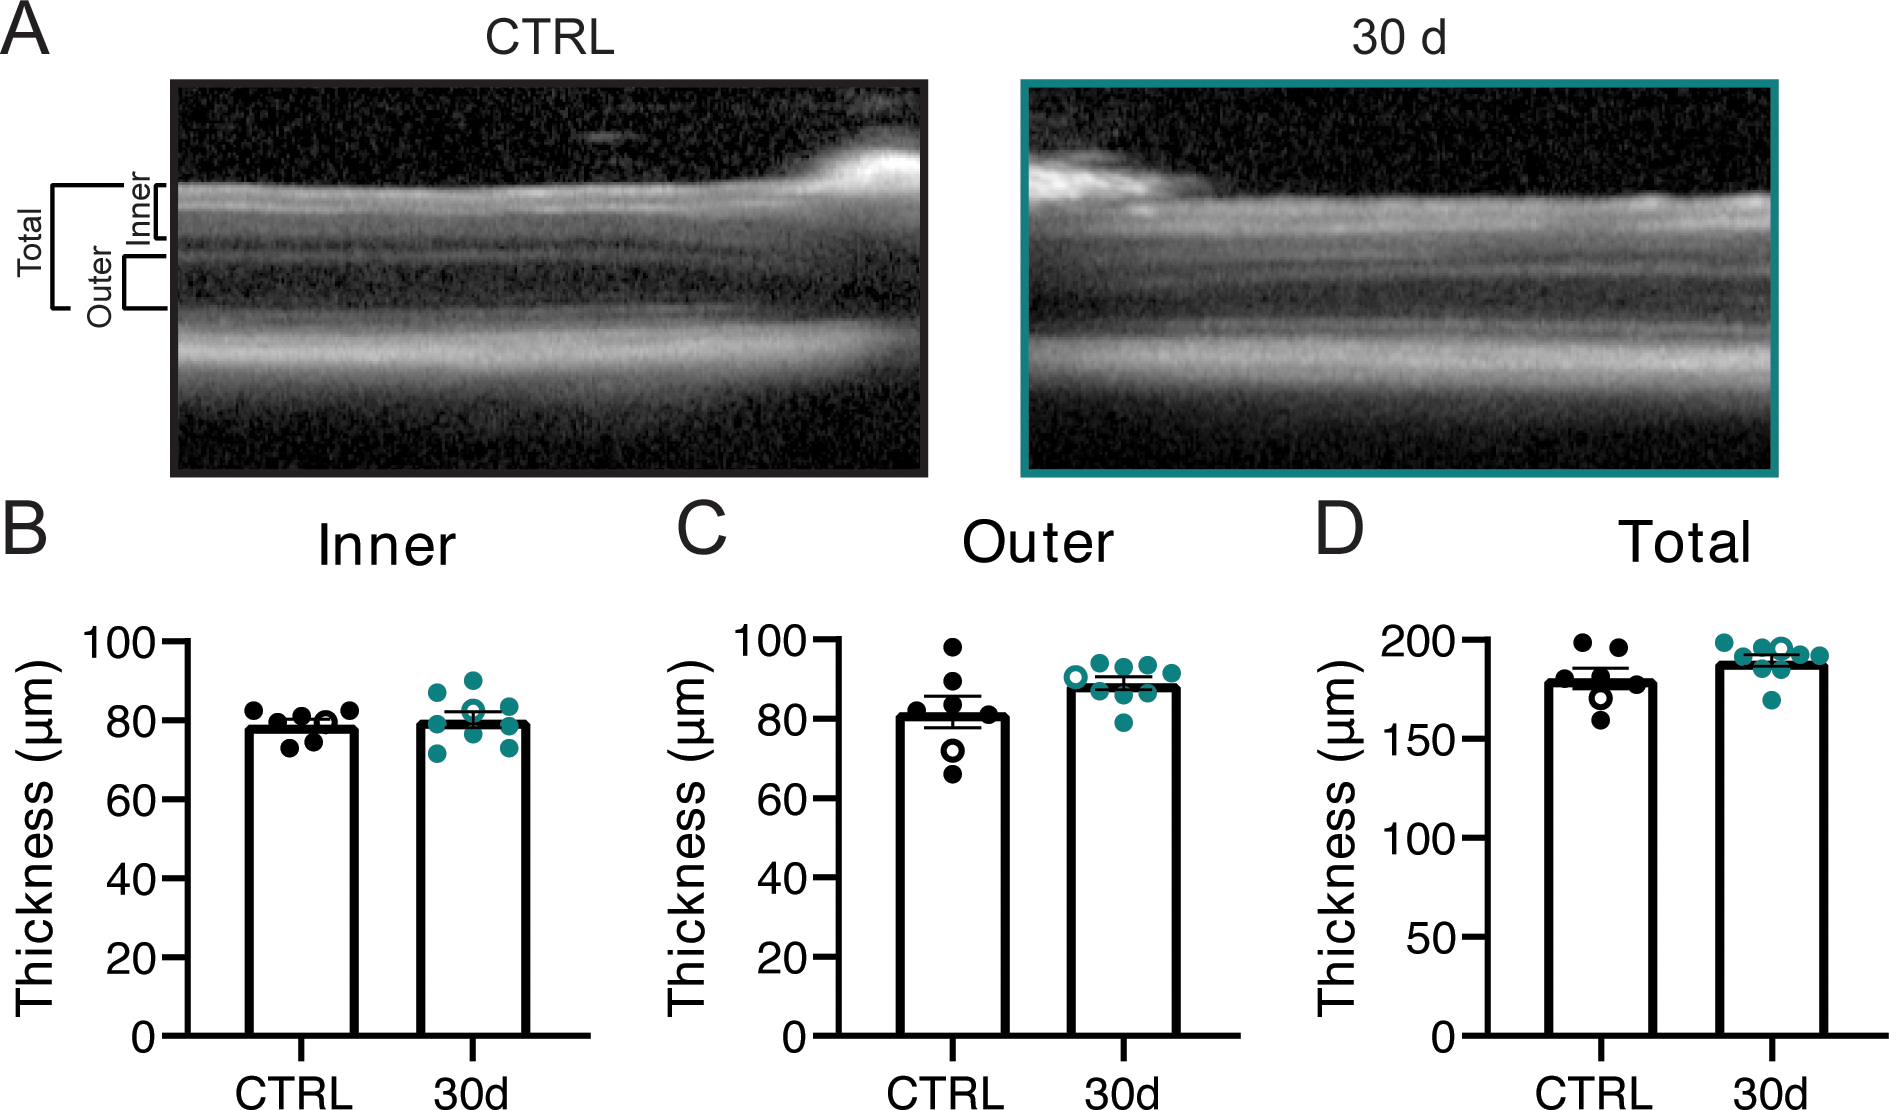
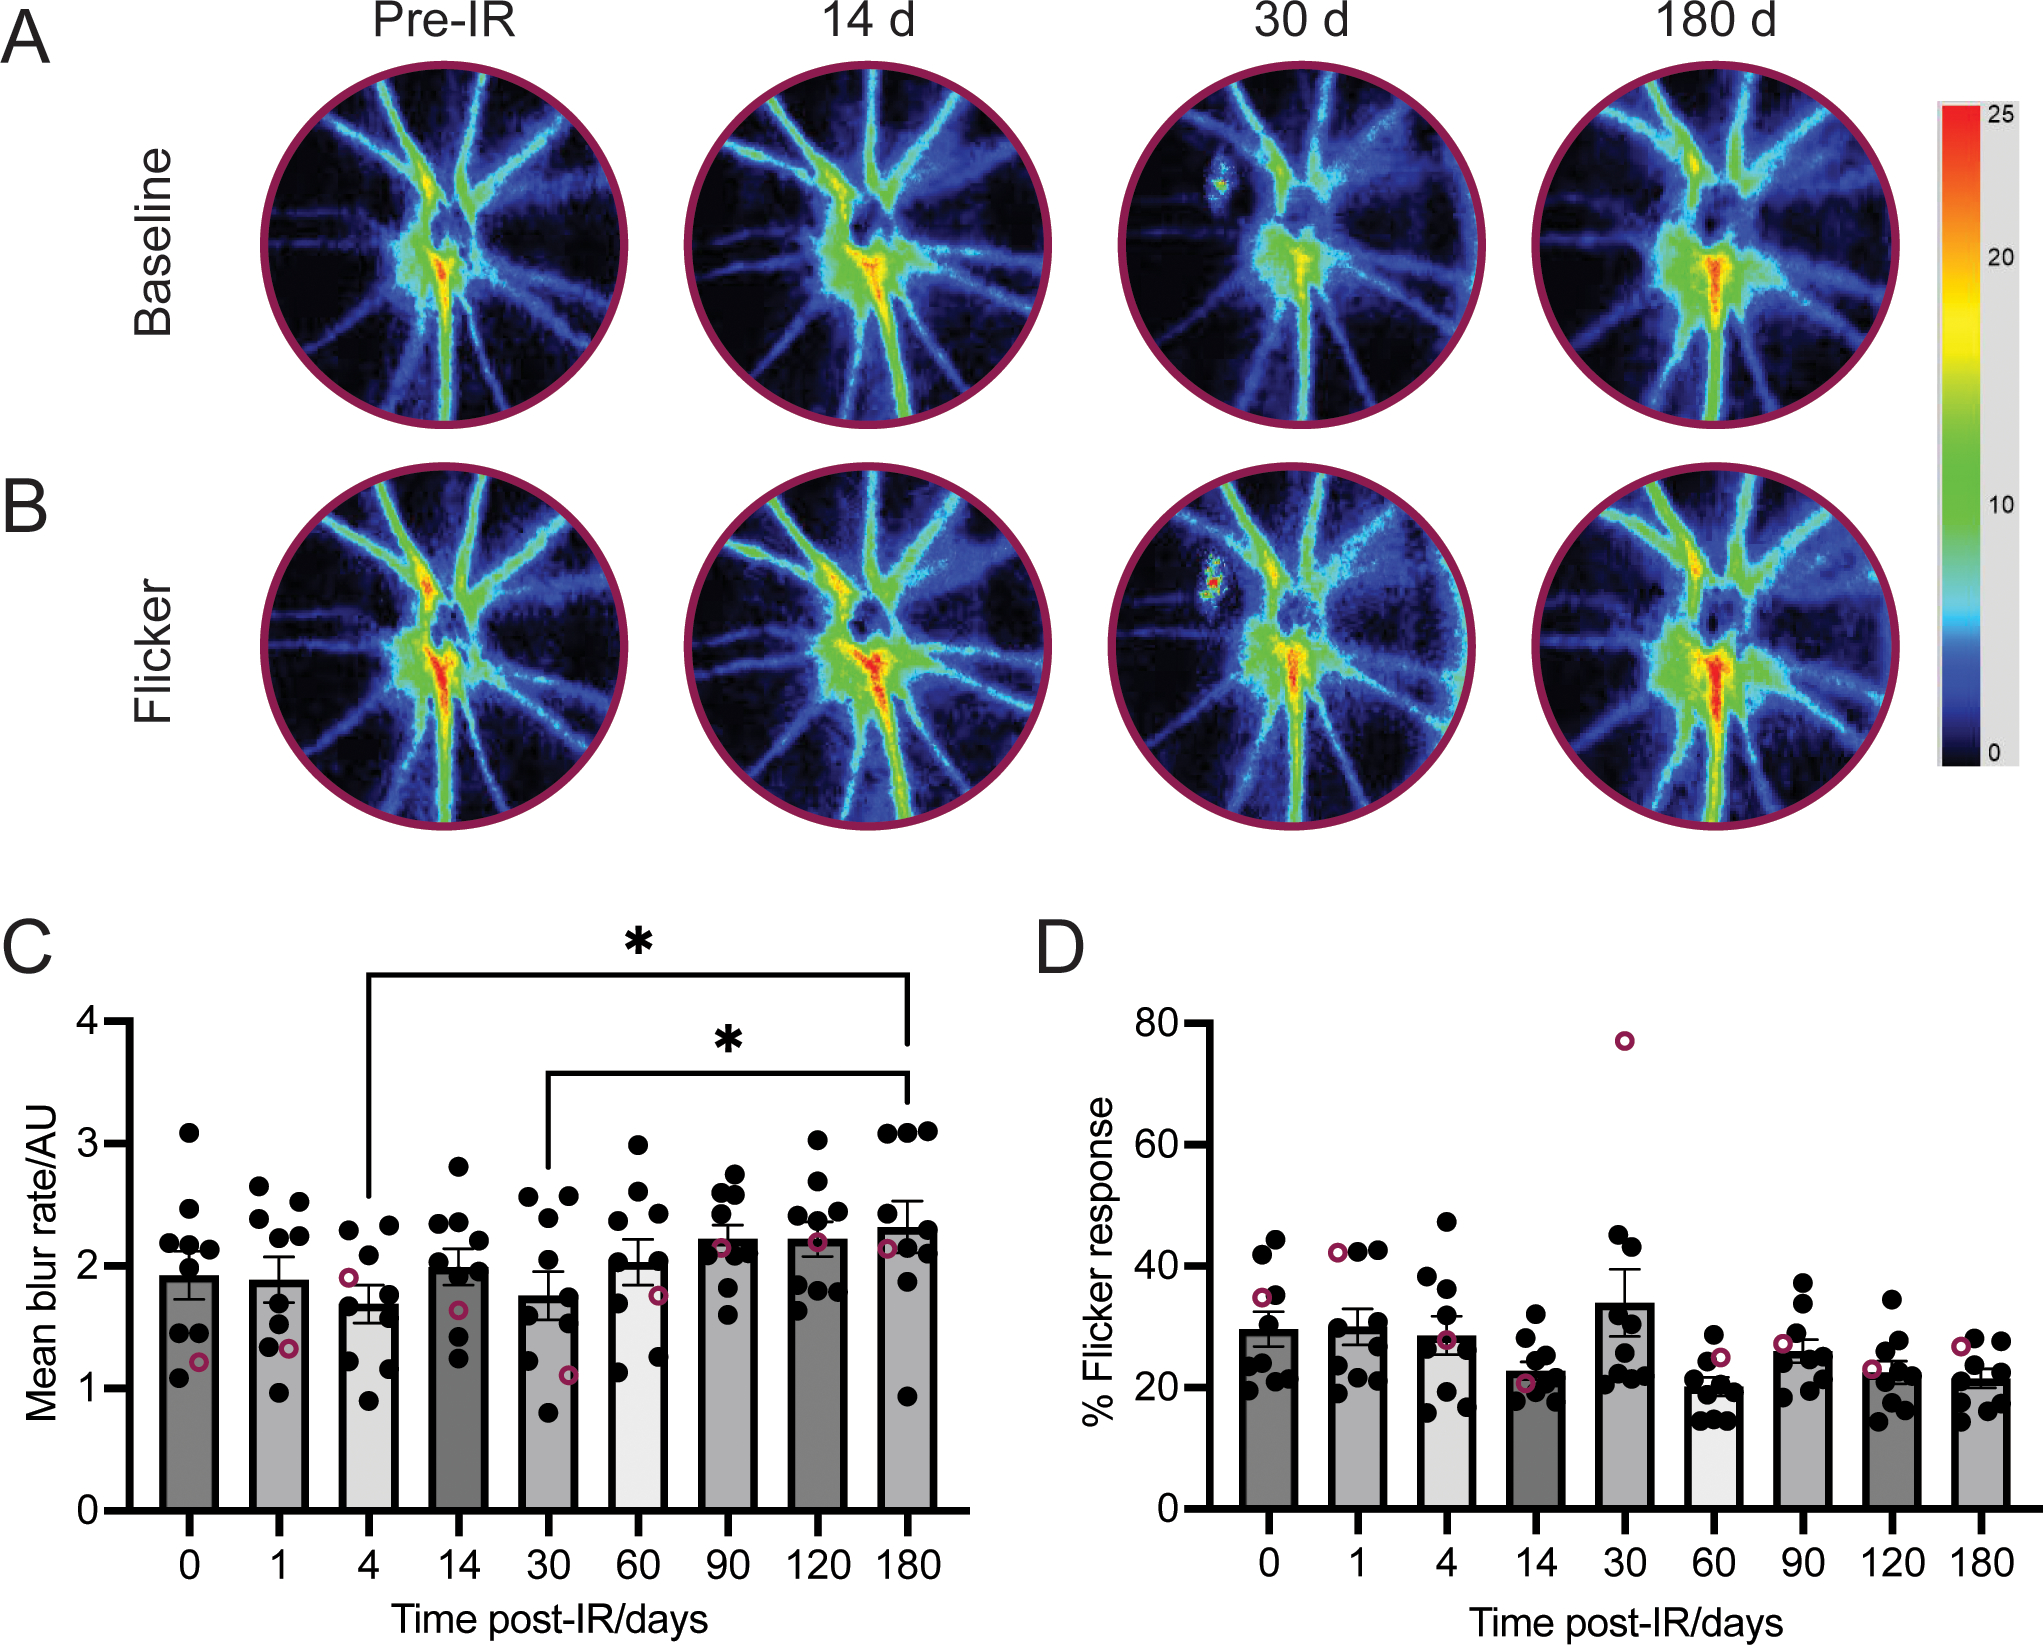
Results: The vascular density decreased in the plexiform layers starting at 30 days after irradiation. No impairment in retinal flow velocity was seen. Subtle perivascular leakage was present at 10 days, in particular in the outer plexiform layer. This corresponded to increased width of this layer. However, no significant change in the retinal thickness was detected by OCT-B scans. At 365 days after irradiation, the nuclear density was significantly reduced compared to baseline. Apoptosis was detected at 30 days and less prominent at 365 days.

Conclusions: By histology, vascular leakage at 10 days was followed by increased neuronal apoptosis and loss of neuronal and vascular density. However, in vivo imaging approaches that are commonly used in human patients did not detect pathology in mice.

Keywords: Apoptosis; Capillaries; Mouse; Radiation retinopathy.


Figures

Figure 1:
Figure 1:. Perivascular leakage and decreased vessel density after irradiation.
(A) Ten-μm transverse sections of the mouse retina adjacent to the optic nerve head were stained with lectin TL (green, top) or IgG (red, bottom) and DAPI (blue). Magnification 20X, scale bar 100 μm. All images were captured in within 200 μm from the optic nerve head with the same settings and post-processing. (B, C) Mean gray value of lectin labeling in the inner (B) and outer plexiform layer (C) as a measure of staining intensity per area. (D, E) Mean gray value of IgG immunofluorescence in the inner (D) and outer plexiform layer (E) as a measure of staining intensity per area. Error bar indicates mean +/− SEM. * p < 0.05, ** p < 0.01 by ordinary one-way ANOVA with Tukey’s multiple comparisons test (B, C), or Kruskal-Wallis test with Dunn’s multiple comparisons test (D, E). Data points represented by open circles in (B-E) correspond to images in (A).
Figure 2:
Figure 2:. Variations in layer thickness by hematoxylin and eosin staining.
(A) H&E staining of 10-μm transverse sections of the mouse retina adjacent to the optic nerve head. Five measurements of each layer were averaged per section. (B-E) Quantification of layer thickness of the inner (IPL, B) and outer plexiform layer (OPL, C) and inner (INL, D) and outer nuclear layer (ONL, E). Error bar indicates mean +/− SEM. Magnification 20X, scale bar 100 μm. * p < 0.05, ** p < 0.01 by ordinary one-way ANOVA with Holm-Šídák’s multiple comparisons test (B, D), Kruskal-Wallis with Dunn’s multiple comparisons test (C), or one-way ANOVA with Tukey’s multiple comparisons test (E). Data points represented by open circles in (B-E) correspond to images in (A).
Figure 3:
Figure 3:. Decreased outer nuclear density by 365 d post-irradiation.
(A) Nuclear labeling by DAPI staining (blue) in the mouse retina at time points after irradiation as indicated. (B) Images were processed for cell counting using Phansalkar thresholding methods. (C, D) Quantification of layer thickness as a measure of pixel count per segment area for the inner (B) and outer (C) nuclear layers. (E, F) Quantification of DAPI signal as a measure of cell body density in the inner (E) and outer (F) nuclear layers. Magnification 20X, scale bar 100 μm. Error bar indicates mean +/− SEM. ** p < 0.01 by Kruskal-Wallis with Dunn’s multiple comparisons test (B), or ordinary one-way ANOVA with Tukey’s multiple comparisons test (C). Data points represented by open circles in (C-F) correspond to images in (A-B).
Figure 4:
Figure 4:. Apoptosis after irradiation.
(A) Representative images of TUNEL staining (red) and nuclear labeling (blue) in the mouse retina at time points after irradiation as indicated. Images and processing performed with identical settings for all time points. Magnification 20X, scale bar 100 μm. (B, C) Quantification of TUNEL-positive pixels in the inner (INL, B) and outer nuclear layer (ONL, C). Error bar indicates mean +/− SEM. * p < 0.05, ** p < 0.01, *** p < 0.001 by Kruskal-Wallis with Dunn’s multiple comparisons test (B, C). Data points represented by open circles in (B, C) correspond to images in (A).
Figure 5:
Figure 5:. In vivo assessment of retinal thickness before and 30 d after irradiation by OCT.
(A) Representative OCT scans in the mouse retina before (left, black) and 30 d after irradiation (right, teal), cropped at the disc center to highlight retinal layer structure. Thickness was measured manually in the inner (B), outer (C), and total (D) retinal sections grouped as indicated in (A). Error bars indicate mean +/− SEM. Comparison nonsignificant by two-tailed unpaired t-test (B-D). Data points represented by open circles in (B-D) correspond to images in (A).
Figure 6:
Figure 6:. Inner retinal blood flow does not change significantly by 180 d after irradiation.
(A, B) Representative images taken during a baseline recording (A) and flicker stimulus (B) before irradiation and at 14, 30, and 180 d post-irradiation in a single mouse. Area between the two dashed lines was used to analyze inner retinal flow. (C) Quantification of retinal blood flow and (D) percent change in flow at peak response to flicker stimulus in 5 male and 5 female C57BL/6J mice before irradiation and at 8 sessions over a 180 d-period. Error bars indicate mean +/− SEM. * p < 0.05 by repeated measures one-way ANOVA with Holm-Šídák’s multiple comparisons test. Data points represented by open circles in (C-D) correspond to images in (A-B).

References

    1. ALT C, RUNNELS JM, MORTENSEN LJ, ZAHER W & LIN CP 2014. In vivo imaging of microglia turnover in the mouse retina after ionizing radiation and dexamethasone treatment. Invest Ophthalmol Vis Sci, 55, 5314–9. - PubMed
    1. AMOAKU WM, FREW L, MAHON GJ, GARDINER TA & ARCHER DB 1989. Early ultrastructural changes after low-dose X-irradiation in the retina of the rat. Eye (Lond), 3 (Pt 5), 638–46. - PubMed
    1. ARCHER DB, AMOAKU WM & GARDINER TA 1991. Radiation retinopathy--clinical, histopathological, ultrastructural and experimental correlations. Eye (Lond), 5 (Pt 2), 239–51. - PubMed
    1. AZIZ HA, SINGH N, BENA J, WILKINSON A & SINGH AD 2016. Vision Loss Following Episcleral Brachytherapy for Uveal Melanoma: Development of a Vision Prognostication Tool. JAMA Ophthalmol, 134, 615–20. - PubMed
    1. BARAKAT MR, SHUSTERMAN M, MOSHFEGHI D, DANIS R, GERTNER M & SINGH RP 2011. Pilot study of the delivery of microcollimated pars plana external beam radiation in porcine eyes. Arch Ophthalmol, 129, 628–32. - PubMed

Publication types