. 2023 Dec 5;14(1):7871.
doi: 10.1038/s41467-023-43471-0.

Enhanced production of mesencephalic dopaminergic neurons from lineage-restricted human undifferentiated stem cells

Affiliations

Enhanced production of mesencephalic dopaminergic neurons from lineage-restricted human undifferentiated stem cells

Muyesier Maimaitili et al. Nat Commun. .

Abstract

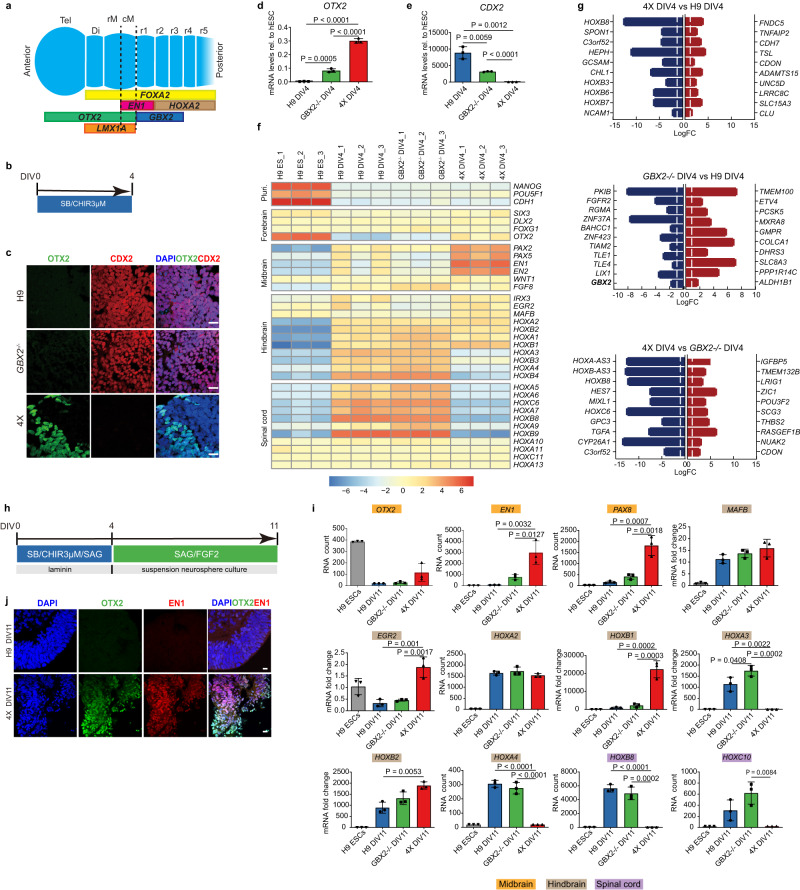
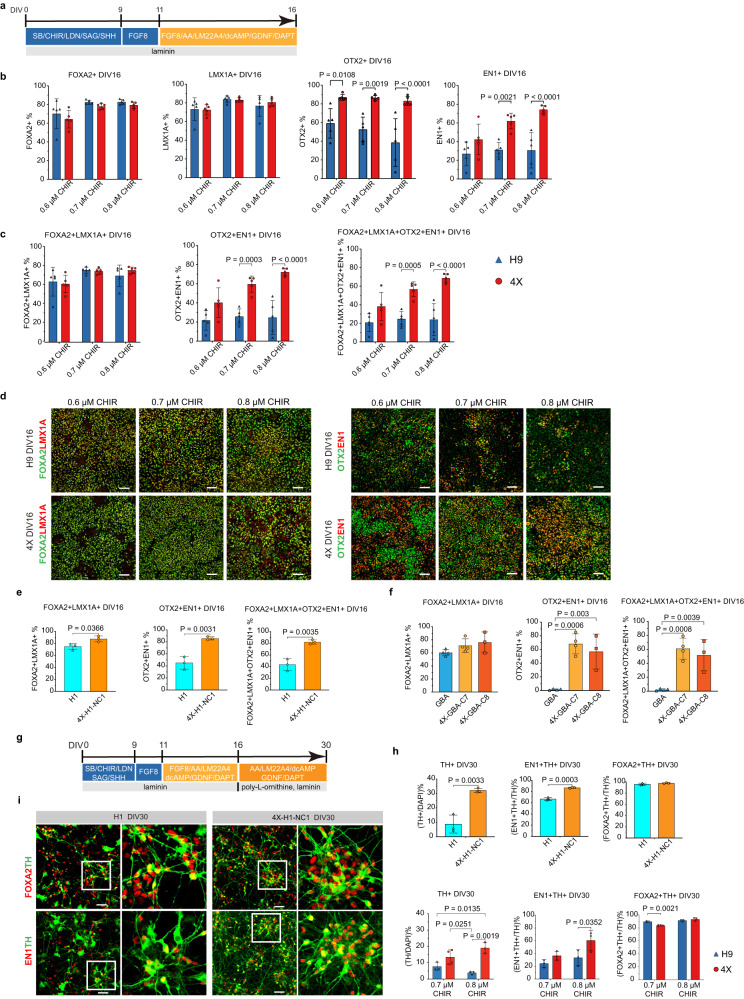
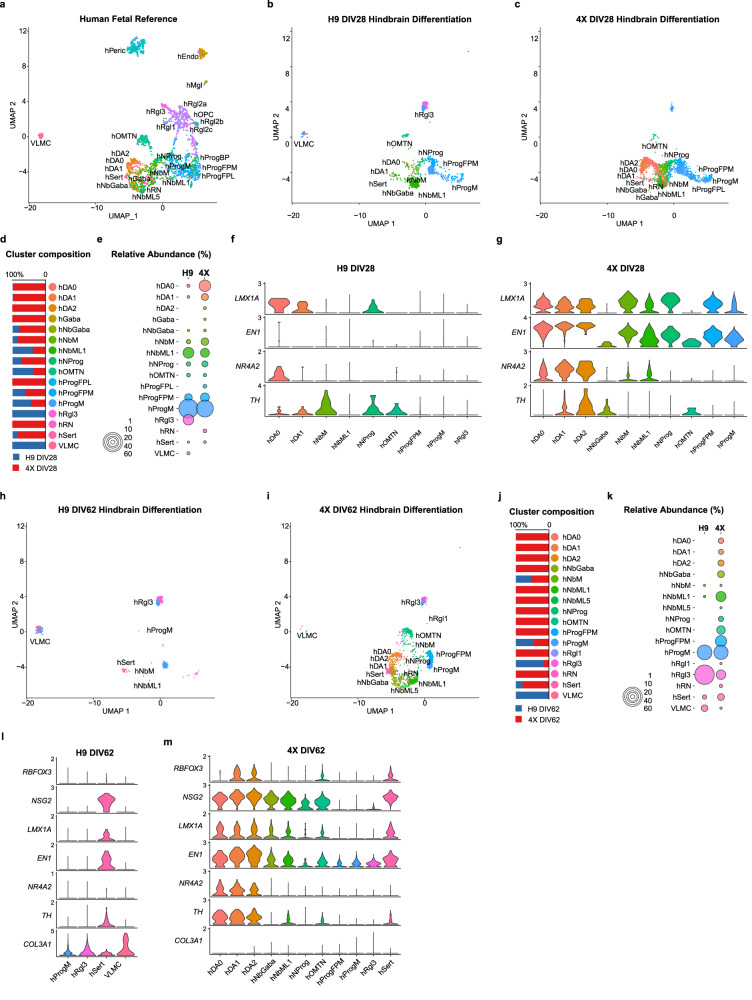
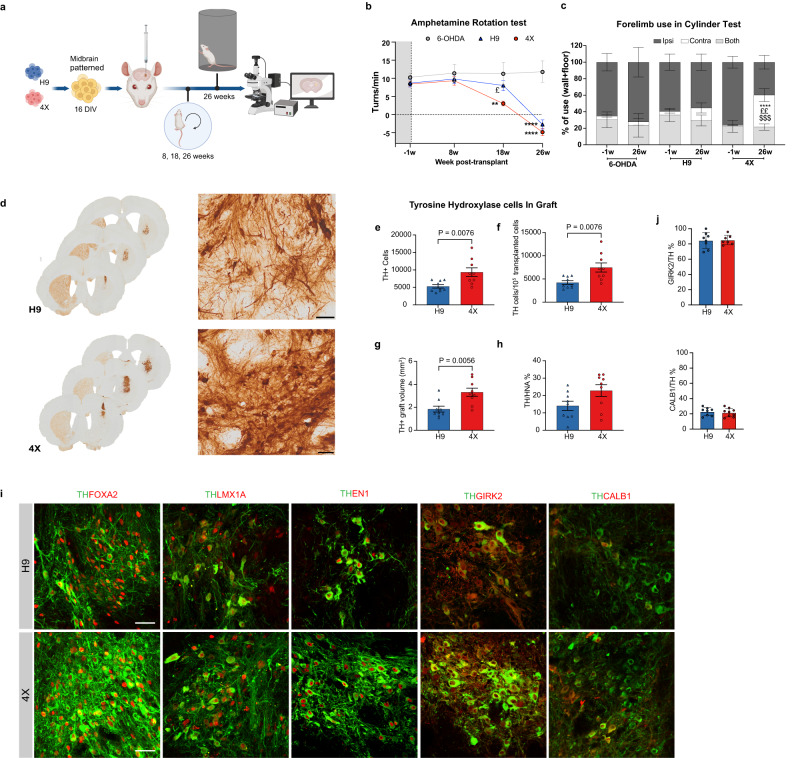
Current differentiation protocols for generating mesencephalic dopaminergic (mesDA) neurons from human pluripotent stem cells result in grafts containing only a small proportion of mesDA neurons when transplanted in vivo. In this study, we develop lineage-restricted undifferentiated stem cells (LR-USCs) from pluripotent stem cells, which enhances their potential for differentiating into caudal midbrain floor plate progenitors and mesDA neurons. Using a ventral midbrain protocol, 69% of LR-USCs become bona fide caudal midbrain floor plate progenitors, compared to only 25% of human embryonic stem cells (hESCs). Importantly, LR-USCs generate significantly more mesDA neurons under midbrain and hindbrain conditions in vitro and in vivo. We demonstrate that midbrain-patterned LR-USC progenitors transplanted into 6-hydroxydopamine-lesioned rats restore function in a clinically relevant non-pharmacological behavioral test, whereas midbrain-patterned hESC-derived progenitors do not. This strategy demonstrates how lineage restriction can prevent the development of undesirable lineages and enhance the conditions necessary for mesDA neuron generation.


Conflict of interest statement

M.M. and M.D. are inventors on a patent application filed by Aarhus University, WO2022136306A1 (National phase) that is related to the generation of lineage restricted cells. J.C.N. and J.R.C. are employed by Novo Nordisk. The remaining authors declare no competing interests.

Figures

Fig. 1
Fig. 1. Differentiation of GBX2-/- and 4X cells using a caudal neural progenitor protocol.
a Schematic gene expression profile of genes along the A-P axis that define regions from the telencephalon (Tel) to rhombomere (r)5 during embryonic development. b Schematic diagram of the DIV4 CNP differentiation protocol. c Representative immunofluorescence images of H9 and GBX2-/- cells at DIV4 showing OTX2-/CDX2+ cells. A few 4X cells were positive for OTX2, but no cells were positive for CDX2. Scale bars, 20 µm. QPCR analysis of OTX2 (d) and CDX2 (e) expression in H9, GBX2-/- and 4X cells at DIV4. The data are presented as the mean ± SD; n = 3 biological replicates. One-way ANOVA showed statistical significance, and then an unpaired t test comparing two groups was performed. f Heatmap of the expression of pluripotent and neural genes representing the forebrain, midbrain, hindbrain and spinal cord regions in H9, GBX2-/- and 4X cells at DIV4. g The top 10 downregulated (blue) and upregulated (red) genes (and additional selected gene in bold) between 4X and H9 cells, GBX2-/- and H9 cells, and 4X and GBX2-/- cells at DIV4. The threshold bar (white line) indicates a fold change of ±2. h Schematic diagram of the DIV11 CNP differentiation protocol. i RNA expression analysis of the midbrain genes (orange) OTX2, EN1 and PAX8; the hindbrain genes (gray) MAFB, EGR2, HOXA2, HOXB1, HOXA3, HOXB2, and HOXA4; and the spinal cord genes (purple) HOXB8 and HOXC10. Nanostring data shown as RNA count and QPCR as fold change. The data are presented as the mean ± SD; n = 3 biological replicates. One-way ANOVA followed by Tukey’s multiple comparisons test. j Representative immunofluorescence analysis of OTX2/EN1 double-positive cells among DIV11 4X cells. No OTX2/EN1 double-positive cells were detected among H9 cells. Scale bars, 10 µm. Diencephalon: Di, rostral midbrain: rM, caudal midbrain: cM, caudal neural progenitor: CNP. Source data are provided as a Source Data file.
Fig. 2
Fig. 2. Differentiation into ventral midbrain progenitors and mesDA neurons.
a Schematic diagram of the DIV16 midbrain differentiation protocol using different concentrations of GSK3i ranging from 0.6 µM to 0.8 µM. Flow cytometry analysis of the percentage of (b) FOXA2 + , LMX1A + , OTX2+ and EN1+ cells, and (c) FOXA2 + LMX1A + , OTX2 + EN1 + , FOXA2 + LMX1A + OTX2 + EN1+ cells among H9 and 4X at DIV16 after administration of GSK3i at concentrations ranging from 0.6 µM to 0.8 µM. The data are presented as the mean ± SD; n = 5, from independent experiments. Two-way ANOVA followed by Sidak’s multiple comparisons test. d Representative immunofluorescence analysis of FOXA2, LMX1A, OTX2, and EN1 expression in H9 and 4X cells treated with GSK3i at concentrations of 0.6 µM, 0.7 µM and 0.8 µM. Scale bars, 50 µm. e, f Flow cytometry analysis of FOXA2 + LMX1A + , OTX2 + EN1 + , FOXA2 + LMX1A + OTX2 + EN1+ cells among H1, 4X-H1-NC1, GBA, 4X-GBA-C7, and 4X-GBA-C8 cells at DIV16 when GSK3i was 0.8 µM. The data are presented as the mean ± SD; (H1, 4X-H1-NC1, 4X-GBA-C8: n = 3; GBA, 4X-GBA-C7: n = 4) from independent experiments. An unpaired two-tailed t test was used to compare groups in (e) and one way ANOVA with Dunnett’s test for (f). g Schematic diagram of the DIV30 midbrain differentiation protocol. h Quantification of TH/DAPI, (FOXA2 + TH + )/TH, (EN1 + TH + )/TH-percentage cells among H9, 4X, at DIV30 when GSK3i were 0.7 µM and 0.8 µM, and H1 and 4X-H1-NC1 at DIV30 when GSK3i was 0.8 µM. The data are presented as the mean ± SD; (n = 3 all conditions excect n = 4 for 4X when GSK3i was 0.8 µM), from independent experiments. Two-way ANOVA followed by Sidak’s multiple comparisons test was used for H9 and 4X. An unpaired two-tailed t test was used to compare H1 and 4X-H1-NC1 groups. i Representative images for FOXA2, TH, EN1 staining at DIV30. Scale bars: 50 µm. Source data are provided as a Source Data file.
Fig. 3
Fig. 3. Single-cell sequencing of H9 and 4X progenitors at DIV16 using a hindbrain differentiation protocol.
a Diagram of hindbrain differentiation protocol. b Graph of the cluster composition for H9 and 4X at DIV16. c Graph showing abundance of H9 and 4X cells in each cluster at DIV16. d UMAP of H9 and 4X cells at DIV16 (H9 cell spheres: n = 10; 4X cell spheres: n = 10; total of 4682 cells). e Heatmap of selected genes expressed in each cluster. f Feature plot of the contribution of each cell line to each cluster and feature plot of gene expression levels of OTX2, EN1, LMX1A, FOXA2, FGF8, HOXA/B family members and STMN2. g Percentage of H9 and 4X cells expressing OTX2 and EN1. h Representative immunofluorescence analysis of OTX2/EN1, OTX2/FOXA2 and FOXA2/LMX1A expression in H9 and 4X cells treated with 1 µM GSK3i on DIV16, n = 3 independent experiments. DAPI was used as a nuclear stain. Scale bars, 50 µm. Source data are provided as a Source Data file.
Fig. 4
Fig. 4. Single-cell sequencing of hindbrain differentiated H9 and 4X cells at DIV28 and DIV62.
a UMAP of human fetal reference dataset. UMAP of H9 (b) and 4X (c) cells at DIV28 after anchoring with reference data (H9 cultures: n = 4, total of 2670 cells; 4X cultures: n = 4; total of 3280 cells). d Composition of cluster by H9 and 4X at DIV28. e Graph showing the abundance of each cluster in H9 and 4X cells at DIV28. Violin plot of H9 (f) and 4X (g) DIV28 clusters for LMX1A, EN1, NR4A2, and TH. Integration UMAP of H9 (h) and 4X (i) at DIV62. j Composition of the cluster by H9 and 4X at DIV62. k Graph showing the abundance of each cluster in H9 and 4X cells at 62 DIV (H9 cell cultures: n = 4, total of 3392 cells; 4X cell cultures: n = 4; total of 2902 cells). Violin plot of H9 (l) and 4X(m) DIV62 clusters for RBFOX3, NSG2, LMX1A, EN1, NR4A2, TH, and COL3A1. Source data are provided as a Source Data file.
Fig. 5
Fig. 5. Generation of functional ventral midbrain DA neurons in vitro.
a Representative response (top trace) to a depolarizing current injection (bottom trace) showing firing of repetitive action potentials. b Example of spontaneous firing at a resting membrane potential of −45 mV showing burst-like events. Overshooting spikes occurred in groups interspersed by periods of subthreshold membrane oscillation. c Frequency distribution of spontaneous cell firing showing firing frequencies ranging between 1 and 5 Hz (n = 16 cells). d Response to a 3-step current injection protocol, displaying a sag potential upon delivery of −100 pA. e Phase contrast image of a patched 4X neuron and with Biocytin backfilled during whole-cell recording (n = 21 cells). Scale bar, 10 µm. f Immunofluorescence shows the expression of TH in the biocytin-labeled, recorded neuron (n = 9 cells). Scale bar, 10 µm. g Dopamine content (normalized to the protein concentration) in 4X and H9 cells at DIV79, as measured by HPLC. The data are presented as the mean ± SD; n = 3 biological replicates. An unpaired two-tailed t-test was used to compare groups. h Illustration of the experiment with lentiviral and rabies viral vectors. Created with BioRender.com. The tracing vector transduces the MSNs, termed starter MSNs, with a nuclear GFP, the TVA receptor, and G replication factor necessary for rabies infection. After rabies viral infection, starter MSNs express mCherry, and spread the rabies viruses retrogradely to the traced neurons due to the presence of GP. i Representative image of TH+ mesDA neurons (DANs) seeded in the microfluidic device. n = 2 independent experiments. Scale bar, 50 µm. j Representative images of rabies traced connectivity between MSNs and DANs from H9 and 4X groups. Starter MSNs are positive for both GFP and mCherry indicating rabies viral infection, while DANs express only mCherry, indicating spreading of the rabies viruses and a stable neuronal connection to the MSNs. n = 2 independent experiments. Scale bars, 100 µm. Source data are provided as a Source Data file.
Fig. 6
Fig. 6. In vivo analysis of hindbrain patterned cells transplanted into a Parkinson’s disease rat model.
a Overview of the in vivo study. Created with BioRender.com. b Amphetamine-induced rotational asymmetry. Two-way repeated measures ANOVA followed by Sidak’s multiple comparison test; time: P < 0.0001; treatment: P < 0.0001. **P < 0.01, ****P < 0.0001 vs. 4X group at the same time point. §§P < 0.01, §§§§P < 0.0001 vs. the same group at week −1. c Cylinder test. Two-way repeated measures ANOVA followed by Sidak’s multiple comparison test. Time x treatment: both: P = 0.0259; ipsilateral: P = 0.0038; contralateral: P = 0.0244. *P < 0.05,**P < 0.01 vs. the same group at week −1. $P < 0.05 vs. 6-OHDA group at the same time point. £P < 0.05, ££P < 0.01 vs. H9 group at the same time point. The data in (b, c) are mean ± SEM. 6-OHDA: n = 7, H9: n = 8, 4X: n = 9 rats. d Representative photos of coronal sections from all groups immunostained for TH. Scale bars, 50 μm. e Estimated numbers of TH-positive cells in the grafts. f Yield of TH-positive neurons per 100,000 grafted cells. g Volume of the TH-positive graft. h Estimated percentage of TH-positive cells within the HNA cells. The data in (eh) are mean ± SEM. n = 9 rats per group. An unpaired two-tailed t test was used to compare groups. Representative photomicrographs showing HNA-positive and TH-positive cells within H9 (i) and 4X cell grafts (j). The squares in (i, j) and (i’-j’) indicate the magnified areas shown in (i’-j’) and (i”-j”), respectively. Scale bars, 200 μm (i, j) and 50 μm (i’-j’). n = 9 rats per group. Representative immunofluorescence images of cells double-positive for TH/FOXA2 (k), TH/LMX1A (l), TH/EN1 (m), TH/GIRK2 (n) and TH/CALB1 (o) within 4X cell grafts. (k’-o’) High-power images of (ko). Scale bar, 50 μm. km n = 3 rats, (n) and (o), n = 9 rats. p Quantitative analysis of GIRK2/TH and CALB1/TH double-positive cells within TH cells in 4X cell grafts, mean ± SD (n = 9 rats).
Fig. 7
Fig. 7. In vivo analysis of midbrain patterned cells transplanted into a Parkinson’s disease rat model.
a Overview of the in vivo study. Created with BioRender.com. b Amphetamine-induced rotational asymmetry. Two-way repeated measures ANOVA followed by Sidak’s multiple comparison test; time: P < 0.0001; treatment: P = 0.0009. **P = 0.0072 and ****P < 0.0001 vs. the same group at week −1. £P = 0.0225 vs. H9 group at the same time point. The data are presented as the mean ± SEM. 6-OHDA group n = 6, H9 group n = 9, and 4X group n = 9 rats. c Cylinder test. Two-way repeated measures ANOVA followed by Sidak’s multiple comparison test. Time x treatment: contra: P = 0.0039; ****P < 0.0001 vs. the same group at week −1. $$$P = 0.0003 vs. the 6-OHDA group at the same time point. ££P = 0.0048 vs. the H9 group at the same time point. The data are presented as the mean ± SEM. 6-OHDA group n = 4, H9 group n = 6, and 4X group n = 7 rats. d Representative photos of coronal sections H9 and 4X cell-transplanted groups for TH. Scale bars, 50 µm. e Estimated numbers of TH-positive cells in the grafts. f The yield of TH-positive neurons per 100,000 grafted cells. g TH-positive graft volume. h The estimated percentage of TH-positive cells within the HNA cells. The data in e-h are mean ± SEM. n = 9 rats per group. An unpaired two-tailed t test was used to compare groups in (e, f, h) and a Mann–Whitney two-tailed test for (g). i Representative immunofluorescence images of cells double-positive for TH/FOXA2, TH/LMX1A, TH/EN1 (n = 3 rats), TH/GIRK2 and TH/CALB1 (n = 9 rats) within H9 and 4X cell grafts. Scale bars, 50 μm. j Quantitative analysis of the immunofluorescence data showing the percentages of GIRK2/TH and CALB1/TH double-positive cells within TH cells in H9 and 4X cell grafts. The data are mean percentage ± SD (CALB1, H9: n = 8, 4X: n = 9; GIRK2, H9: n = 8, 4X: n = 7 rats).

References

    1. Hynes M, et al. Induction of midbrain dopaminergic neurons by sonic hedgehog. Neuron. 1995;15:35–44. doi: 10.1016/0896-6273(95)90062-4. - DOI - PubMed
    1. Castelo-Branco G, et al. Differential regulation of midbrain dopaminergic neuron development by Wnt-1, Wnt-3a, and Wnt-5a. Proc. Natl. Acad. Sci. USA. 2003;100:12747–12752. doi: 10.1073/pnas.1534900100. - DOI - PMC - PubMed
    1. Echelard Y, et al. Sonic hedgehog, a member of a family of putative signaling molecules, is implicated in the regulation of CNS polarity. Cell. 1993;75:1417–1430. doi: 10.1016/0092-8674(93)90627-3. - DOI - PubMed
    1. Nordström U, Jessell TM, Edlund T. Progressive induction of caudal neural character by graded Wnt signaling. Nat. Neurosci. 2002;5:525–532. doi: 10.1038/nn0602-854. - DOI - PubMed
    1. Hidalgo-Sánchez M, Millet S, Simeone A, Alvarado-Mallart R-M. Comparative analysis of Otx2, Gbx2, Pax2, Fgf8 and Wnt1 gene expressions during the formation of the chick midbrain/hindbrain domain. Mech. Dev. 1999;81:175–178. doi: 10.1016/S0925-4773(98)00224-X. - DOI - PubMed

Publication types

Substances

Associated data