. 2023 Dec 5;14(1):8059.
doi: 10.1038/s41467-023-43834-7.

Phox2b-expressing neurons contribute to breathing problems in Kcnq2 loss- and gain-of-function encephalopathy models

Affiliations

Phox2b-expressing neurons contribute to breathing problems in Kcnq2 loss- and gain-of-function encephalopathy models

J Soto-Perez et al. Nat Commun. .

Abstract

Loss- and gain-of-function variants in the gene encoding KCNQ2 channels are a common cause of developmental and epileptic encephalopathy, a condition characterized by seizures, developmental delays, breathing problems, and early mortality. To understand how KCNQ2 dysfunction impacts behavior in a mouse model, we focus on the control of breathing by neurons expressing the transcription factor Phox2b which includes respiratory neurons in the ventral parafacial region. We find Phox2b-expressing ventral parafacial neurons express Kcnq2 in the absence of other Kcnq isoforms, thus clarifying why disruption of Kcnq2 but not other channel isoforms results in breathing problems. We also find that Kcnq2 deletion or expression of a recurrent gain-of-function variant R201C in Phox2b-expressing neurons increases baseline breathing or decreases the central chemoreflex, respectively, in mice during the light/inactive state. These results uncover mechanisms underlying breathing abnormalities in KCNQ2 encephalopathy and highlight an unappreciated vulnerability of Phox2b-expressing ventral parafacial neurons to KCNQ2 pathogenic variants.


Conflict of interest statement

The authors declare no competing interests.

Figures

Fig. 1
Fig. 1. Phox2b-expressing RTN neurons preferentially express Kcnq2 but not Kcnq3 channels.
Coronal sections from Phox2Cre/+::Ai14 reporter mice were obtained for multiplex in situ hybridization analysis of Kcnq2 and Kcnq3 transcript expression in for Phox2b-expressing brainstem populations. A Photomicrographs of coronal sections from the RTN, 7N, NTS, and LC show tdT-labeled Phox2b+ neurons (yellow) in the RTN express Kcnq2 transcript (cyan) but low Kcnq3 signal (magenta). Insets (right), shows fluorescent in situ hybridization results for the boxed region at a higher magnification where Kcnq2, Kcnq3, and Phox2b-tdT (yellow), the DAPI (blue). Signal was filtered to improve visualization. White arrows identify cells that express Kcnq2 but not Kcnq3, red arrows identify cells that co-express both transcripts, and yellow arrows designate cells that express Kcnq3 but not Kcnq2. Scale bars are 100 µm and 50 µm (insets). B Summary of fluorescent in-situ hybridization results (n = 3 mice, 30–40 days postnatal) show that 90% of tdT-Phox2b labeling in the ventral parafacial region co-localized with Kcnq2 labeling (white) and of these only 24% also showed Kcnq3 labeling (yellow), whereas 10% of tdT-Phox2b neurons in this region lacked both Kcnq2 and Kcnq3 signal (red). In contrast to the RTN, the majority of Kcnq2 signal detected in the 7N, LC and NTS co-localized with Kcnq3 labeling and in some cases only Kcnq3 labeling was observed (cyan). C Summary data plotted as mean ± maximum and minimum show the proportion of Phox2b-expressing cells per slice that express Kcnq2 transcript in the absence of Kcnq3 in the RTN (n = 66 slices, red), 7N (n = 17 slices, white), NTS (n = 23 slices, white), LC (n = 16 slices, white). Significance was determined using the Kruskal-Wallis test; RTN vs NTS (p < 0.0001), RTN vs LC (p < 0.0001), RTN vs. 7N (p < 0.0001). These results show that Phox2b-expressing neurons in the ventral parafacial region have a higher proportion of Phox2b+ neurons that uniquely express Kcnq2 mRNA than other medullary Phox2b-expressing neural populations. 7N, facial motor nucleus; LC, locus coeruleus; nucleus tractus solitarius (NTS).
Fig. 2
Fig. 2. Characterization of Kcnq2 cKO and Kcnq2 GOF mouse models.
A Schematic of Kcnq2 wild-type locus and targeting construct containing the inverted mutated exon 4 (mE4). When Cre recombinase is expressed, wild type exon 4 is removed and mE4 exon is inverted to effectively replace wild-type exon 4 with one expressing R201C. We crossed the Kcnq2 floxed line with mice that express Cre under control of the Phox2b promotor to express Kcnq2R201C conditionally (B6(Cg)‐Tg(Phox2b‐cre)3Jke/J::Kcnq2R201C/+; Kcnq2 GOF). B Genotyping PCR analysis for Kcnq2 GOF and Kcnq2 cKO mice. The PCR products run to the expected sizes for each genotype and primer set (Kcnq2 GOF primers span exon 4, including residue 201 of exon 4; Kcnq2 cKO primers include a loxP site). Water was used as a no-template negative control. C, Immunohistochemistry was performed to characterize expression of Kcnq2 protein in Phox2b-expressing ventral parafacial neurons in brainstem sections from Kcnq2+/+, Kcnq2 GOF, and Kcnq2 cKO mice. Images of coronal medullary sections (~6.24 mm behind bregma) from Kcnq2+/+ and Kcnq2 GOF mice show robust Kcnq2 signal (green) co-localized with Phox2b labeling (red); and confirm reduction of Kcnq2 protein in Phox2b-expressing ventral parafacial neurons in sections from Kcnq2 cKO mice. Right, summary of immunohistochemistry results shows the relative proportions of Phox2b-expressing neurons in the ventral parafacial region is comparable between Kcnq2+/+ (N = 3 animals; n = 1240 cells), Kcnq2 GOF (N = 3 animals, n = 956 cells), and Kcnq2 cKO (N = 2 animals, n = 486 cells) mice. We also found similar proportions of Phox2b-expressing cells in sections from Kcnq2+/+ (59%) and Kcnq2 GOF (57%) mice are Kcnq2-immunoreactive (Kcnq2-IR), whereas approximately a quarter of Phox2b-expressing cells did not show detectable levels of Kcnq2, and a relatively modest level of Kcnq2-IR was also observed in Phox2b-negative cells. As expected, virtually all (96%) Phox2b-expressing neurons in the ventral parafacial region in sections from Kcnq2 cKO mice lack expression of Kcnq2. Scale bar 50 µm. D survival curves for each experimental group as well as floxed-only control mice (Phox2b+/+::Kcnq2R201C/+) show that each genotype exhibits normal survival. These results were compared using Kaplan-Meier survival curve comparison.
Fig. 3
Fig. 3. Loss and Gain of Kcnq2 function in Phox2b neurons differentially affects baseline breathing and central chemoreception.
A Traces of respiratory activity from Kcnq2+/+ (white), Kcnq2 GOF (red), and Kcnq2 cKO (green) mice during exposure to room air and graded increases in CO2 (0–7%; balance O2). Summary data (n = 15 Kcnq2+/+; n = 9 Kcnq2 GOF; n = 9 Kcnq2 cKO) plotted as mean ± maximum and minimum show respiratory frequency (B; p < 0.0001), tidal volume (C; p = 0.0282) and minute ventilation (D; p < 0.0001) are increased under room air conditions in Kcnq2 cKO mice compared to control or Kcnq2 GOF mice (one-way ANOVA and Tukey’s multiple comparison test). Summary data (Kcnq2+/+ n = 15; Kcnq2 GOF n = 9; Kcnq2 cKO n = 9) plotted as mean ± SEM of frequency (E; p < 0.0001), tidal volume (F; p < 0.0001) and minute ventilation (G; p < 0.0001) show that Kcnq2 GOF mice have a reduced capacity to increase respiratory output in response to graded increases in CO2. Means are compared using two-way ANOVA followed by Tukey’s multiple comparison test and slope of the minute ventilation 0–7% CO2 response is compared using one-way ANCOVA. Asterisk (*) indicates the difference between genotypes; # used to distinguish within genotype differences from control. One symbol = p < 0.05, two symbols = p < 0.01, three symbols = p < 0.001, four symbols = p < 0.0001.
Fig. 4
Fig. 4. Kcnq2 cKO mice show increased baseline breathing preferentially during the light/inactive state.
A Traces of respiratory activity from Kcnq2+/+ (white) and Kcnq2 cKO (green) mice in room air, 100% O2 and 3–7% CO2 (balance O2) during the light/inactive and dark/active states. Summary data (n = 9 Kcnq2+/+ and n = 12 Kcnq2 cKO mice) plotted as mean ± maximum and minimum frequency (B; p = 0.2180), tidal volume (C; p = 0.0009) and minute ventilation (D; p = 0.0187) shows that Kcnq2 cKO mice exhibit higher baseline respiratory activity during the light/inactive state but not during dark/active conditions. Summary data (Kcnq2+/+ n = 9 and Kcnq2 cKO n = 12 mice) plotted as mean ± SEM of minute ventilation show that Kcnq2+/+and Kcnq2 cKO mice exhibit similar ventilatory responses to CO2 during the light/inactive (E, p = 0.9621) and dark/active states (F, p = 0.0717). Means are compared using two-way ANOVA followed by Tukey’s multiple comparison test and the slope of the minute ventilation 0–7% CO2 response are compared using one-way ANCOVA. Asterisk (*) indicates the difference between genotypes and # designates within genotype differences from control; one symbol = p < 0.05, two symbols = p < 0.01, three symbols = p < 0.001, four symbols = p < 0.0001.
Fig. 5
Fig. 5. Kcnq2 GOF mice show a blunted ventilatory response to CO2 during the light/inactive state.
A Traces of respiratory activity from Kcnq2+/+ (white) and Kcnq2 GOF (red) mice in room air, 100% O2 and 3–7% CO2 (balance O2) during the light/inactive and dark/active states. Summary data (light/inactive n = 8 mice/genotype; dark/active n = 6 mice/genotype) plotted as mean ± maximum and minimum respiratory frequency (B; p < 0.0001), tidal volume (C; p = 0.0021) and minute ventilation (D; p < 0.0001) show that both genotypes exhibit a characteristic arousal-dependent increase in respiratory activity in the dark/active state and no genotype differences were observed under room air conditions. Summary data (light/inactive n = 8 mice/genotype; dark/active n = 6 mice/genotype) plotted as mean ± SEM of minute ventilation show that CO2/H+-dependent respiratory output in Kcnq2 GOF mice is suppressed in the light/inactive state (E, same data as shown in Fig. 3g, p < 0.0001) but not during the dark/active state where the slope of the ventilatory response to CO2/H+ was similar to control (p = 0.27). Means are compared using two-way ANOVA followed by Tukey’s multiple comparison test and slope of the minute ventilation 0–7% CO2 response are compared using one-way ANCOVA. Asterisk (*) indicates the difference between genotypes and # designates within genotype differences from control; one symbol = p < 0.05, two symbols = p < 0.01, three symbols = p < 0.001, four symbols = p < 0.0001.
Fig. 6
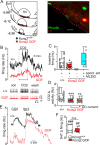
Fig. 6. RTN neurons in slices from Kcnq2 GOF mice show reduced baseline activity and CO2/H+ sensitivity.
A Computer-assisted plot shows the location of RTN neurons from each genotype in the ventral parafacial region. Sp5, spinal trigeminal nucleus. Right, double-immunolabeling shows a Lucifer Yellow (LY)-filed CO2/H+ sensitive RTN neuron recorded in a Kcnq2 GOF slice is immunoreactive for Phox2b (green). We confirmed Phox2b immunoreactivity in RTN neurons from control (n = 11) and Kcnq2 GOF (n = 10) tissue. Numbers to the left of each section designate millimeters from bregma. Scale bar: 20 µm. 7N, facial motor nucleus. B Traces of firing rate and segments of membrane potential (spikes are truncated) from chemosensitive RTN neurons in slices from Kcnq2+/+ (black) and Kcnq2 GOF (red) mice show examples of spontaneous activity under control conditions (5% CO2; pH 7.3) and that neurons from both genotypes respond to 10% CO2 (pH 7.0). Summary data shows that all RTN neurons in control tissue (n = 24 cells; white) are spontaneously activated (C) and respond to 10% CO2 with a robust increase in firing (D). Conversely, only approximately half of RTN neurons in slices from Kcnq2 GOF mice are spontaneously active (n = 19, 66%; red) under control conditions (C) and both spontaneous and non-spontaneous (with baseline adjusted to ~1 Hz by application of a DC current; orange) RTN neurons from Kcnq2 GOF slices show a diminished firing response to CO2 compared to RTN neurons from control tissue (D; p = 0.0002) (One-Way ANOVA with Tukey’s multiple comparison test). E, F, Firing rate traces and summary data (plotted as mean ± maximum and minimum) show responses of chemosensitive RTN neurons in slices from Kcnq2+/+ (black; n = 7 cells) and Kcnq2 GOF (red; n = 5 cells) mice to 10% CO2 and serotonin (5 HT; 10 µM). We found that exposure to 5HT increased activity of RTN neurons in slices from Kcnq2+/+ and Kcnq2 GOF to an amount that was not different between genotypes (p = 0.5837; one-sided, non-parametric Mann-Whitney test).
Fig. 7
Fig. 7. Expression of Kcnq2 GOF limits repetitive firing of RTN neurons whereas pharmacological inhibition of Kcnq2 favors depolarizing block.
A Segments of membrane potential from RTN neurons in slices from Kcnq2+/+ (black) and Kcnq2 GOF (red) mice during depolarizing current injections (0 to +125pA, 1 s duration) from a membrane potential of −65 mV under control conditions and in the presence of a selective Kcnq2 channel blocker (ML252; 10 µM; Kcnq2+/+ + ML252 = orange; Kcnq2 GOF + ML252 = Cyan). B Input-output relationships (plotted as mean ± SEM) show that under control conditions (top) RTN neurons in slices from Kcnq2 GOF mice (n = 11) generate fewer action potentials in response to depolarizing current injection compared to RTN neurons from control tissue (n = 8) (p = 0.0063; area under curve was compared by unpaired T-test). Note also that bath application of ML252 (10 µM) normalized the response of RTN neurons from each genotype to modest depolarizing current injections (up to 50 pA) but resulted in depolarizing block at more positive steps (B, bottom, p = 0.8162). C Summary data (plotted as mean ± maximum and minimum) show that RTN neurons from Kcnq2 GOF mice (n = 10) have a hyperpolarized resting membrane potential compared to RTN neurons from Kcnq2+/+ mice (n = 9) under control conditions but not in the presence of ML252 (10 µM) (F3,27 = 10.48; p < 0.0001; one-way ANOVA with Tukey’s multiple comparison test). D Summary results (plotted as mean ± maximum and minimum) show that input resistance measured during −100 pA step was similar between genotypes (Kcnq2+/+ n = 9; Kcnq2 GOF n = 8) under control conditions and in the presence of ML252 (10 µM; Kcnq2+/+ + ML252 n = 5; Kcnq2 GOF + ML252 n = 7; one-way ANOVA with Tukey’s multiple comparison test).

Comment in

References

    1. Cornet MC, Cilio MR. Genetics of neonatal-onset epilepsies. Handb. Clin. Neurol. 2019;162:415–433. doi: 10.1016/B978-0-444-64029-1.00020-5. - DOI - PubMed
    1. Berg AT, Mahida S, Poduri A. KCNQ2-DEE: developmental or epileptic encephalopathy? Ann. Clin. Transl. Neurol. 2021;8:666–676. doi: 10.1002/acn3.51316. - DOI - PMC - PubMed
    1. Dirkx N, Miceli F, Taglialatela M, Weckhuysen S. The Role of Kv7.2 in Neurodevelopment: Insights and Gaps in Our Understanding. Front. Physiol. 2020;11:570588. doi: 10.3389/fphys.2020.570588. - DOI - PMC - PubMed
    1. Miceli F, et al. KCNQ2 R144 variants cause neurodevelopmental disability with language impairment and autistic features without neonatal seizures through a gain-of-function mechanism. EBioMedicine. 2022;81:104130. doi: 10.1016/j.ebiom.2022.104130. - DOI - PMC - PubMed
    1. Vanoye CG, et al. High-throughput evaluation of epilepsy-associated KCNQ2 variants reveals functional and pharmacological heterogeneity. JCI Insight. 2022;7:e156314. doi: 10.1172/jci.insight.156314. - DOI - PMC - PubMed

Publication types

Associated data