. 2023 Dec 5;14(1):8031.
doi: 10.1038/s41467-023-43855-2.

Secretory GFP reconstitution labeling of neighboring cells interrogates cell-cell interactions in metastatic niches

Affiliations

Secretory GFP reconstitution labeling of neighboring cells interrogates cell-cell interactions in metastatic niches

Misa Minegishi et al. Nat Commun. .

Abstract

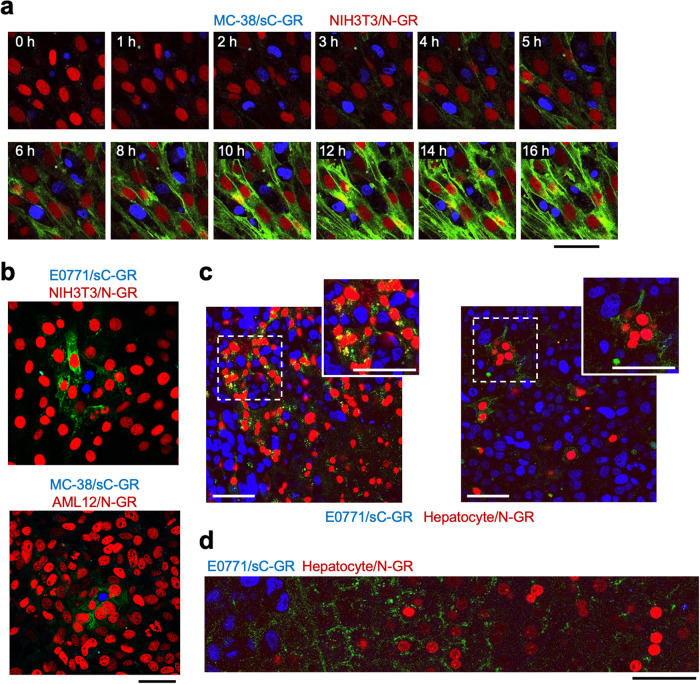
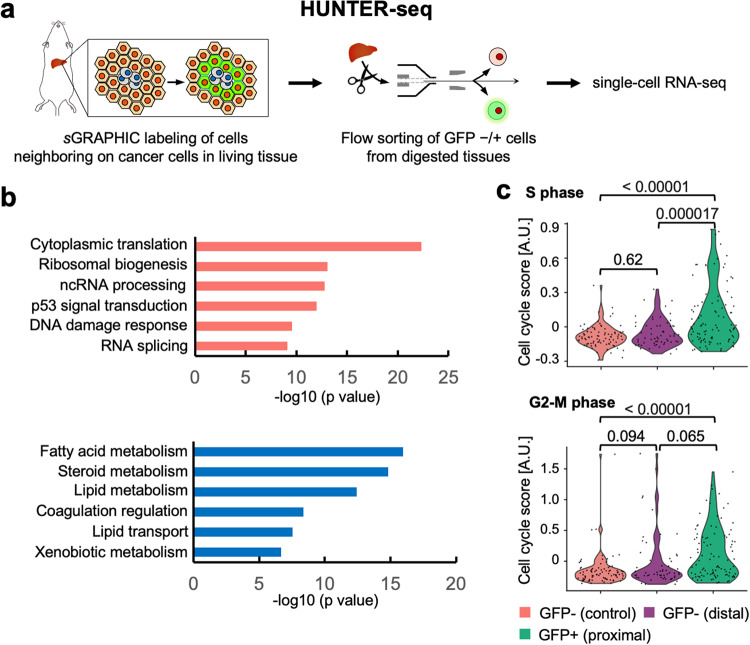
Cancer cells inevitably interact with neighboring host tissue-resident cells during the process of metastatic colonization, establishing a metastatic niche to fuel their survival, growth, and invasion. However, the underlying mechanisms in the metastatic niche are yet to be fully elucidated owing to the lack of methodologies for comprehensively studying the mechanisms of cell-cell interactions in the niche. Here, we improve a split green fluorescent protein (GFP)-based genetically encoded system to develop secretory glycosylphosphatidylinositol-anchored reconstitution-activated proteins to highlight intercellular connections (sGRAPHIC) for efficient fluorescent labeling of tissue-resident cells that neighbor on and putatively interact with cancer cells in deep tissues. The sGRAPHIC system enables the isolation of metastatic niche-associated tissue-resident cells for their characterization using a single-cell RNA sequencing platform. We use this sGRAPHIC-leveraged transcriptomic platform to uncover gene expression patterns in metastatic niche-associated hepatocytes in a murine model of liver metastasis. Among the marker genes of metastatic niche-associated hepatocytes, we identify Lgals3, encoding galectin-3, as a potential pro-metastatic factor that accelerates metastatic growth and invasion.


Conflict of interest statement

The authors declare no competing interests.

Figures

Fig. 1
Fig. 1. Development of a system for secretory GFP reconstitution labeling of neighboring cells.
a Schematic of sGRAPHIC strategy for GFP labeling of metastatic niche cells. C-terminal GFP fragments are secreted from sC-GR expressing cells. The secreted C-terminal GFP fragments are reconstituted with N-terminal GFP fragments displayed on the plasma membrane of N-GR expressing cells. b sGRAPHIC labeling in HEK293T cells. sGRAPHIC specifically labeled N-GR expressing HEK293T cells (red nuclei) neighboring on sC-GR expressing HEK293T cells (blue nuclei). The white-rectangle area is enlarged in the right panel. Similar results were observed in multiple fields of view in independent duplicate experiments. Scale bars indicate 50 µm. c Flow cytometry analysis of sGRAPHIC labeling. HEK293T/N-GR cells and HEK293T/sC-GR cells were co-cultured in equal numbers for 6 or 24 h, and the GFP intensity of mCherry-positive cells was measured. Similar results were observed in independent triplicate experiments. Source data are provided as a Source Data file. d Flow cytometry analysis of Cherry-niche labeling. The same number of HEK293T/Cherry-niche cells and HEK293T/H2B-Azurite cells were co-cultured for 6 or 24 h, and the mCherry intensity of Azurite-positive cells was measured. Similar results were observed in independent triplicate experiments. Source data are provided as a Source Data file. e Labeling efficiency of sGRAPHIC and Cherry-niche in flow cytometry measurements. Data were statistically analyzed with two-tailed Student’s t-test (n = 3 biologically independent samples). The p-values are indicated in the graph. Data are presented as mean values ± SEM. Source data are provided as a Source Data file.
Fig. 2
Fig. 2. In vitro and in vivo characterization of sGRAPHIC labeling.
a Snapshots of time-lapse fluorescence imaging for co-culturing MC-38/sC-GR cells and NIH3T3/N-GR cells from Supplementary Movie 1. Similar results were observed in independent triplicate experiments. b Fluorescence imaging of sGRAPHIC labeling of cancer cell–tissue-resident cell interactions (cancer cell:tissue-resident cell = 1:50). Similar results were observed in independent duplicate experiments. c Confocal imaging of sGRAPHIC labeling of hepatocytes neighboring on metastatic colonies in the murine liver. Confocal fluorescence imaging was performed three weeks after E0771/sC-GR cells (blue nuclei) transplantation. Similar results were observed in multiple fields of view in independent duplicate experiments. d Wide-field confocal imaging of sGRAPHIC labeling in the liver metastatic lesion. Confocal fluorescence imaging was performed three weeks after E0771/sC-GR cells (blue nuclei) transplantation. Similar results were observed in multiple fields of view in independent duplicate experiments. All scale bars indicate 50 µm.
Fig. 3
Fig. 3. sGRAPHIC-leveraged transcriptomics of metastatic niches in a murine model.
a Schematic of HUNTER-seq. HUNTER-seq combines sGRAPHIC, flow sorting, and scRNA-seq. b Gene ontology of upregulated (top) and downregulated (bottom) genes (one-sided version of Fisher’s exact test, adjusted p-value < 0.1, Log 2 FC absolute value > 0.3) in the proximal hepatocytes as compared to the distal and control hepatocytes. c Violin plots of cell cycling score (S phase and G2-M phase) for the hepatocytes. Cell cycling scores were plotted in arbitral unit (AU). Data were statistically analyzed with analysis of variance and Tukey honestly significant difference test (95% family-wise confidence level). The adjusted p-values are shown in the graph.
Fig. 4
Fig. 4. HUNTER-seq analysis of cell–cell interactions in the liver metastatic niche.
a t-Distributed stochastic neighbor embedding (t-SNE) plot of the GFP- hepatocytes from the healthy liver (control, n = 87) or the metastasized liver (distal, n = 59) and GFP+ hepatocytes from the metastasized liver (proximal, n = 99). Marker genes (two-sided version of Wilcoxon Rank-Sum test, adjusted p-value < 0.1, Log 2 FC > 0.25) among hepatocytes (proximal, distal, control) were used for clustering. Inserted numbers indicate cluster identification (left panel). The fraction rate of the hepatocytes in each cluster identified in the t-SNE plot (right panel). b Heatmap displaying expression level of clusters 2 and 3 marker genes of the top 20 ranked by Log 2 FC (two-sided version of Wilcoxon Rank-Sum test, adjusted p-value < 0.05) expressions in the GFP+ proximal hepatocytes. c The expression level of Lgals3 in the proximal, distal, and control. Data were statistically analyzed with analysis of variance and Tukey honestly significant difference test (95% family-wise confidence level). The adjusted p-values are shown in the graph. d Representative immunofluorescent staining images of galectin-3 in a metastasized liver section. Cancer cells (H2B-Azurite), hepatocytes (H2B-mCherry), and galectin-3 signals in the area of the hepatic tissue–metastasized colonies border (Liver–Meta border), distal liver tissue (Distal liver) and non-peripheral area of the metastatic colony (Non-peri meta) are shown. Similar results were observed in independent duplicate experiments. A scale bar indicates 20 µm. e Tumor spheroid proliferation assay of E0771 cells treated with galectin-3 in three-dimensional culture. Data were statistically analyzed with Holm-Sidak adjusted multiple t-test (n = 102, 93, 90 and 72 for 0, 3, 5, 10 µg/mL galectin-3 respectively). The p-values are indicated in the graph. Data are presented as mean values ± SEM. Similar results were observed in independent duplicate experiments. Source data are provided as a Source Data file. f Transmigration assay of E0771 with recombinant galectin-3. Data were statistically analyzed with Holm-Sidak adjusted multiple t-test (n = 3 biologically independent samples). The p-values are indicated in the graph. Data are presented as mean values ± SEM. Similar results were observed in independent duplicate experiments. Source data are provided as a Source Data file.

References

    1. Kiel MJ, Morrison SJ. Maintaining hematopoietic stem cells in the vascular niche. Immunity. 2006;25:862–864. doi: 10.1016/j.immuni.2006.11.005. - DOI - PubMed
    1. Comazzetto S, Shen B, Morrison SJ. Niches that regulate stem cells and hematopoiesis in adult bone marrow. Dev. Cell. 2021;56:1848–1860. doi: 10.1016/j.devcel.2021.05.018. - DOI - PMC - PubMed
    1. Valkenburg KC, de Groot AE, Pienta KJ. Targeting the tumour stroma to improve cancer therapy. Nat Rev. Clin. Oncol. 2018;15:366–381. doi: 10.1038/s41571-018-0007-1. - DOI - PMC - PubMed
    1. Langley RR, Fidler IJ. The seed and soil hypothesis revisited—the role of tumor-stroma interactions in metastasis to different organs. Int. J. Cancer. 2011;128:2527–2535. doi: 10.1002/ijc.26031. - DOI - PMC - PubMed
    1. Celia-Terrassa T, Kang Y. Metastatic niche functions and therapeutic opportunities. Nat. Cell Biol. 2018;20:868–877. doi: 10.1038/s41556-018-0145-9. - DOI - PubMed

Publication types

Substances