. 2023 Dec 5;9(1):120.
doi: 10.1038/s41421-023-00620-5.

Structural basis of nucleosomal H4K20 recognition and methylation by SUV420H1 methyltransferase

Affiliations

Structural basis of nucleosomal H4K20 recognition and methylation by SUV420H1 methyltransferase

Folan Lin et al. Cell Discov. .

Abstract

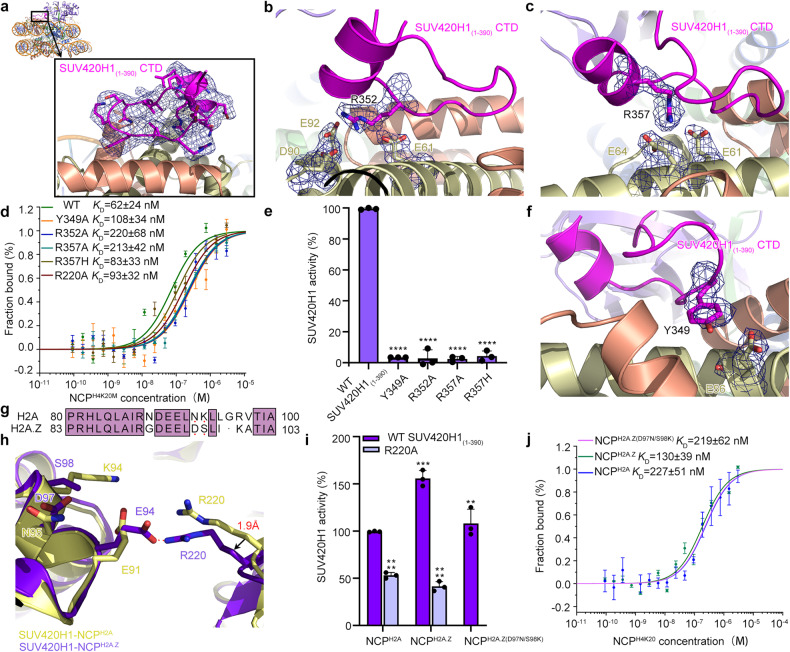
Histone lysine methyltransferase SUV420H1, which is responsible for site-specific di-/tri-methylation of histone H4 lysine 20 (H4K20), has crucial roles in DNA-templated processes, including DNA replication, DNA damage repair, and chromatin compaction. Its mutations frequently occur in human cancers. Nucleosomes containing the histone variant H2A.Z enhance the catalytic activities of SUV420H1 on H4K20 di-methylation deposition, regulating early replication origins. However, the molecular mechanism by which SUV420H1 specifically recognizes and deposits H4K20 methyl marks on nucleosomes remains poorly understood. Here we report the cryo-electron microscopy structures of SUV420H1 associated with H2A-containing nucleosome core particles (NCPs), and H2A.Z-containing NCPs. We find that SUV420H1 makes extensive site-specific contacts with histone and DNA regions. SUV420H1 C-terminal domain recognizes the H2A-H2B acidic patch of NCPs through its two arginine anchors, thus enabling H4K20 insertion for catalysis specifically. We also identify important residues increasing the catalytic activities of SUV420H1 bound to H2A.Z NCPs. In vitro and in vivo functional analyses reveal that multiple disease-associated mutations at the interfaces are essential for its catalytic activity and chromatin state regulation. Together, our study provides molecular insights into the nucleosome-based recognition and methylation mechanisms of SUV420H1, and a structural basis for understanding SUV420H1-related human disease.


Conflict of interest statement

The authors declare no competing interests.

Figures

Fig. 1
Fig. 1. Biochemical analysis of SUV420H1 and the overall structure of the SUV420H1(1–390)–NCPH2A.Z complex.
a Schematic illustration of the domain structures of SUV420H1 and SUV420H2. Highlighted in the rectangle include the N-terminal domain, SET domain, post-SET domain, and SUV420H1(1–390) CTD, and the region colored in magenta indicates the de novo modeling region. b MST assays of the binding of human SUV420H1(1–390) to NCPH2A and NCPH2A.Z. Dissociation constants (KD) = 227 ± 51 nM (NCPH2A) and 130 ± 39 nM (NCPH2A.Z). Error bars represent mean ± SEM based on three independent measurements. c Catalytic activity of the SUV420H1(1–390) on NCPH2A and NCPH2A.Z by end-point HMT assays in vitro. Each assay was repeated at least 3 times with similar results. n = 3 independent experiments, two-tailed, unpaired t-test. ***P = 0.00086. d, e Cryo-EM density map (d) and atomic model (e) of human SUV420H1(1–390)–NCPH2A.Z complex, shown in side (left) and top (right) view. The cryo-EM map is segmented and colored according to the components of the SUV420H1(1–390)–NCPH2A.Z complex.
Fig. 2
Fig. 2. Interfaces between SUV420H1(1–390) and the H4 tail together with DNA.
a Overview of the recognition interfaces between SUV420H1(1–390) and nucleosomal H4 tail and DNA components. SUV420H1(1–390) domains are colored as shown in Fig. 1d. Histones H4 and DNA are colored in light green and orange, respectively. b Detailed view of the interactions between SUV420H1(1–390) and the phosphate backbone of nucleosome SHL 2 DNA. Important residues at the interface are shown as sticks. c Detailed view of the interactions between SUV420H1(1–390) and the H4 tail Q27. Important residues at the interface are shown as sticks. d Detailed view of the recognition interfaces between SUV420H1 and nucleosomal H4 tail. Residues at the interface of H4 are shown as sticks in green. H3 is colored in blue. SAM is colored in yellow. e Catalytic activity of wild-type SUV420H1(1–390) and various mutants on NCPH2A by end-point HMT assays in vitro. Adjusted P values for pairwise ANCOVA comparison of wild-type SUV420H1(1–390) and each mutant are reported: **** P < 0.0001. f MST binding assays of wild-type SUV420H1(1–390) and SUV420H1(1–390) mutants on NCPH2A. Error bars represent mean ± SEM based on 3 independent measurements. g Alignment of the apo SUV420H1 (Protein Data Bank (PDB) code 3S8P, grey) with SUV420H1(1–390)–NCPH2A complex (colored as in Fig. 1d). Directions of shifted regions of SUV420H1(1–390)–NCPH2A are indicated with black arrows. h Catalytic activity of SUV420H1(1–390) on NCPH2A and NCPH4Q27A by end-point HMT assays in vitro. ****P < 0.0001. i Detailed view of the interaction interface of SUV420H1 residue K258 in a negatively charged pocket. The important residues are shown as sticks.
Fig. 3
Fig. 3. Contacts with H2A–H2B acidic patch by SUV420H1(1–390) CTD domain orient SUV420H1 onto nucleosome.
a Overview of the contacts between SUV420H1(1–390) CTD domain and nucleosomal H2A–H2B acidic patch. SUV420H1(1–390) are colored the same as Fig. 1d. Histones H2A and H2B are colored in yellow and pink, respectively. b, c, f Detailed view of the recognition of the acidic patch of the nucleosome by arginine anchors. Important residues at the interface are shown as sticks. d MST binding assays of wild-type SUV420H1(1–390) and SUV420H1(1–390) mutants with NCPH4K20M. Error bars represent mean ± SEM based on three independent measurements. e Catalytic activity of wild-type SUV420H1(1–390) and various mutants on NCPH2A by end-point HMT assays in vitro. Each assay was repeated at least three times with similar results. ****P < 0.0001. g Sequence alignment of the region containing D97 and S98 of H2A.Z and the corresponding region of H2A (in single-letter code). The same residues are boxed in a purple background. h Conformational changes and shifts of residue 220 in SUV420H1(1–390)–NCPH2A and SUV420H1(1–390)–NCPH2A.Z complexes. Directions of shifted regions are indicated with black arrows. i Catalytic activity of SUV420H1(1–390) on NCPH2A, NCPH2A.Z and NCPH2A.Z(D97N/S98K) by end-point HMT assays in vitro. The catalytic activity of SUV420H1(1–390) R220A on NCPH2A and NCPH2A.Z by end-point HMT assays in vitro. Each assay was repeated at least three times with similar results. ***P = 0.0006, **P = 0.0086. j MST binding assays of wild-type SUV420H1(1–390) on NCPH2A, NCPH2A.Z, NCPH2A.Z(D97N/S98K) containing H4K20.
Fig. 4
Fig. 4. Functional validation of SUV420H1–NCP complex.
a Western blot assay shows the enrichment of H4K20me2, SUV420H1 and ORC1 on Flag-H2A or Flag-H2A.Z nucleosomes, after mono-nucleosome IP. Mono-nucleosome IP was performed in wild-type HeLa cells, SUV420H1–/– HeLa cells and SUV420H1–/– HeLa cells ectopically expressing Myc-SUV420H1(1–550) or Myc-SUV420H1(1–550)-R220A mutant. b Western blot assay shows the levels of H3K4me1/2/3 after over-expressing SUV420H1 (1–550) or SUV420H1 (1–550) with a single mutation of K258E, S255F, S283L, Y349A, R352A, R357H or R220A in SUV420H1–/– HeLa cells, whose expression is indicated by Myc. The stars indicate a non-specific signal from H4K20me1 or H4K20me3 antibody. c Venn plot shows the overlapping of ATAC-seq peaks from wild-type and SUV420H1–/– HeLa cells. d Dot plot shows the dynamics of ATAC-seq signal in wild-type and SUV420H1–/– HeLa cells within the ATAC-seq peaks (n = 75,999) from SUV420H1–/– HeLa cells. Up (n = 18,222) and down (n = 2846) indicate peaks with increased or decreased ATAC-seq signal filtered with two-fold changes and P < 0.01. e Dot plot shows the dynamic changes of ATAC-seq signal after over-expressing SUV420H1(1–550) in SUV420H1–/– HeLa cells, within the ATAC-seq peaks (n = 75,999) from SUV420H1–/– HeLa cells. Up (n = 273) and down (n = 8857) indicate peaks with increased or decreased ATAC-seq signal filtered with two-fold changes and P < 0.01. f Bar plot shows the number of peaks with decreased ATAC-seq signal after over-expressing SUV420H1 (1–550) or SUV420H1 (1–550) with a single mutation of K258E, S255F, S283L, Y349A, R352A, R357H or R220A, filtered with two-fold changes and P < 0.01. g Heatmap shows the ATAC-seq signal around the center of the 8857 “down” ATAC-seq peaks as indicated in e, from SUV420H1–/– HeLa cells or SUV420H1–/– HeLa cells over-expressing SUV420H1(1–550) or SUV420H1 (1–550) with a single mutation as indicated in f.

Similar articles

Cited by

References

    1. Luger K, Mäder A, Richmond R, Sargent D, Richmond T. Crystal structure of the nucleosome core particle at 2.8 Å resolution. Nature. 1997;389:251–260. doi: 10.1038/38444. - DOI - PubMed
    1. Kouzarides T. Chromatin modifications and their function. Cell. 2007;128:693–705. doi: 10.1016/j.cell.2007.02.005. - DOI - PubMed
    1. Faundes V, et al. Histone lysine methylases and demethylases in the landscape of human developmental disorders. Am. J. Hum. Genet. 2018;102:175–187. doi: 10.1016/j.ajhg.2017.11.013. - DOI - PMC - PubMed
    1. Husmann D, Gozani O. Histone lysine methyltransferases in biology and disease. Nat. Struct. Mol. Biol. 2019;26:880–889. doi: 10.1038/s41594-019-0298-7. - DOI - PMC - PubMed
    1. Edwards CR, Dang W, Berger SL. Histone H4 lysine 20 of Saccharomyces cerevisiae is monomethylated and functions in subtelomeric silencing. Biochemistry. 2011;50:10473–10483. doi: 10.1021/bi201120q. - DOI - PMC - PubMed