. 2023 Dec 5;14(1):7720.
doi: 10.1038/s41467-023-43125-1.

Choroidal and retinal thinning in chronic kidney disease independently associate with eGFR decline and are modifiable with treatment

Affiliations

Choroidal and retinal thinning in chronic kidney disease independently associate with eGFR decline and are modifiable with treatment

Tariq E Farrah et al. Nat Commun. .

Abstract

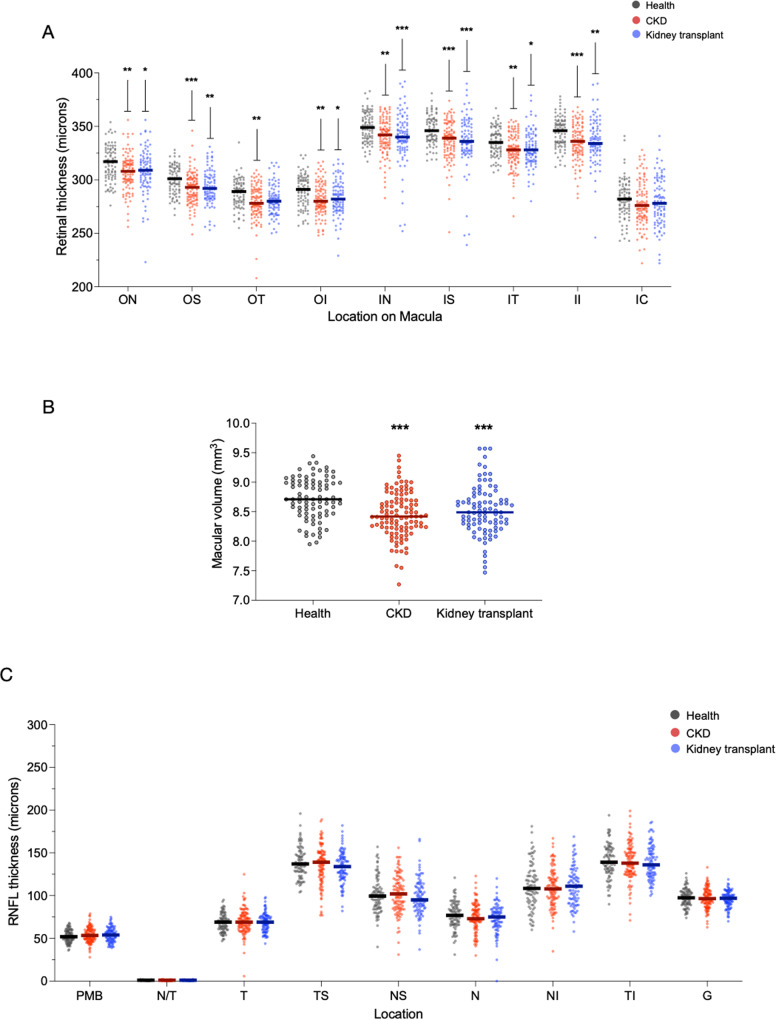
In patients with chronic kidney disease (CKD), there is an unmet need for novel biomarkers that reliably track kidney injury, demonstrate treatment-response, and predict outcomes. Here, we investigate the potential of retinal optical coherence tomography (OCT) to achieve these ends in a series of prospective studies of patients with pre-dialysis CKD (including those with a kidney transplant), patients with kidney failure undergoing kidney transplantation, living kidney donors, and healthy volunteers. Compared to health, we observe similar retinal thinning and reduced macular volume in patients with CKD and in those with a kidney transplant. However, the choroidal thinning observed in CKD is not seen in patients with a kidney transplant whose choroids resemble those of healthy volunteers. In CKD, the degree of choroidal thinning relates to falling eGFR and extent of kidney scarring. Following kidney transplantation, choroidal thickness increases rapidly (~10%) and is maintained over 1-year, whereas gradual choroidal thinning is seen during the 12 months following kidney donation. In patients with CKD, retinal and choroidal thickness independently associate with eGFR decline over 2 years. These observations highlight the potential for retinal OCT to act as a non-invasive monitoring and prognostic biomarker of kidney injury.


Conflict of interest statement

The authors declare no competing interests.

Figures

Fig. 1
Fig. 1. Schematic overview of study participants, imaging schedule and primary outcomes.
OCT optical coherence tomography, CKD chronic kidney disease, eGFR estimated glomerular filtration rate.
Fig. 2
Fig. 2. Retinal and nerve fibre layer thickness in health and kidney disease.
Scatter dot plots of retinal thickness (A), macular volume (B) and retinal nerve fibre layer thickness (RNFL, C) of healthy volunteers (grey, n = 86), patients with chronic kidney disease (CKD, red, n = 112) and patients with a kidney transplant (blue, n = 92) at different areas across the macula as defined in Supplementary Fig. 1. For retinal thickness (A): ON outer nasal *p = 0.02, **p = 0.009; OS outer superior **p = 0.002, ***p < 0.001; OT outer temporal **p = 0.004; OI outer inferior *p = 0.04, **p = 0.003; IN inner nasal **p = 0.002, ***p < 0.001; IS, inner superior ***p < 0.001; IT inner temporal *p = 0.04, **p = 0.004; II inner inferior **p = 0.006, ***p < 0.001; IC inner circle. For macular volume, ***p < 0.001. For RNFL (C) T temporal, TS temporal-superior, NS nasal-superior, N nasal, NI nasal-inferior, TI temporal-inferior. PMB papillo-macular bundle, N/T nasal-temporal ratio, G average RNFL thickness. Lines represent mean. p values are vs. healthy volunteers. Two-sided analysis by ANOVA with Tukey correction for multiple comparisons. Source data are provided as a source data file.
Fig. 3
Fig. 3. Choroidal thickness in health and kidney disease.
A Scatter dot plots of choroidal thickness in healthy volunteers (grey, n = 86), patients with chronic kidney disease (CKD, red, n = 112) and patients with a kidney transplant (blue, n = 92) at location I (2 mm nasal to fovea), location II (subfoveal) and location III (2 mm temporal to fovea). Lines represent mean. Patients with CKD vs. health volunteers: location I *p = 0.014, location II ***p < 0.001, location III *p = 0.021; patients with a kidney transplant vs. patients with CKD, location I p = 0.031, location II p = 0.012. Two sided analysis by ANOVA with Tukey correction for multiple comparisons. B Scatter dot plots of subfoveal choroidal thickness (upper panel) grouped by KDIGO CKD stage as defined by estimated glomerular filtration rate (eGFR, lower panel). Red—patients with CKD stage 4/5, n = 26; Orange—patients with CKD stage 3, n = 47; Yellow—patients with CKD stage 2, n = 28; Green—patients with CKD stage 1, n = 14. Lines represent mean. Two-sided analysis by ANOVA for linear trend, p = 0.004. Source data are provided as a source data file.
Fig. 4
Fig. 4. OCT metrics and kidney transplantation.
Dot plots of change in pre-transplant choroidal thickness (A) and macular volume (B) at 1 week and 1 month after living donor kidney transplantation. Grey—choroidal thickness 2 mm nasal to fovea; red – subfoveal choroidal thickness; blue—choroidal thickness 2 mm temporal to fovea. Lines represent mean. For choroidal thickness, at 1 week, ***p < 0.001 vs. pre-transplant; at 1 month, *p = 0.030, **p = 0.003, ***p < 0.001 vs. pre-transplant. n = 25. Analysis by mixed effects model with Sidak correction for multiple comparisons. For macular volume, ***p < 0.001. Analysis by mixed-effects model with Sidak correction for multiple comparisons. Source data are provided as a source data file.
Fig. 5
Fig. 5. OCT metrics and kidney donation.
Dot plots of change in choroidal thickness (A) and macular volume (B) at 1 week, 1, 3, 6 and 12 months after donor nephrectomy. Grey—choroidal thickness 2 mm nasal to fovea; red—subfoveal choroidal thickness; blue—choroidal thickness 2 mm temporal to fovea. Lines represent mean. For choroidal thickness at 1 week, *p = 0.01, **p = 0.002, *** p < 0.001 vs. pre-donation. For choroidal thickness at 6 months, **p = 0.004 vs. pre-donation. n = 22. Analysis by mixed-effects model with Sidak correction for multiple comparisons. For macular volume, **p = 0.009 vs. pre-donation. Analysis by mixed-effects model with Sidak correction for multiple comparisons. Source data are provided as a source data file.

References

    1. GBD Chronic Kidney Disease Collaboration Global, regional, and national burden of chronic kidney disease, 1990−2017: a systematic analysis for the Global Burden of Disease Study 2017. Lancet. 2020;395:709–733. doi: 10.1016/S0140-6736(20)30045-3. - DOI - PMC - PubMed
    1. Israni AK, et al. Predicting coronary heart disease after kidney transplantation: patient outcomes in renal transplantation (PORT) study. Am. J. Transpl. 2010;10:338–353. doi: 10.1111/j.1600-6143.2009.02949.x. - DOI - PubMed
    1. Fox CS, et al. Associations of kidney disease measures with mortality and end-stage renal disease in individuals with and without diabetes: a meta-analysis. Lancet. 2012;380:1662–1673. doi: 10.1016/S0140-6736(12)61350-6. - DOI - PMC - PubMed
    1. Gansevoort RT, et al. Chronic kidney disease and cardiovascular risk: epidemiology, mechanisms, and prevention. Lancet. 2013;382:339–352. doi: 10.1016/S0140-6736(13)60595-4. - DOI - PubMed
    1. Hewitt SM, Dear J, Star RA. Discovery of protein biomarkers for renal diseases. J. Am. Soc. Nephrol. 2004;15:1677–1689. doi: 10.1097/01.ASN.0000129114.92265.32. - DOI - PubMed

Publication types