. 2023 Dec 5;14(1):8061.
doi: 10.1038/s41467-023-43833-8.

Functional divergence of a bacterial enzyme promotes healthy or acneic skin

Affiliations

Functional divergence of a bacterial enzyme promotes healthy or acneic skin

Irshad A Hajam et al. Nat Commun. .

Abstract

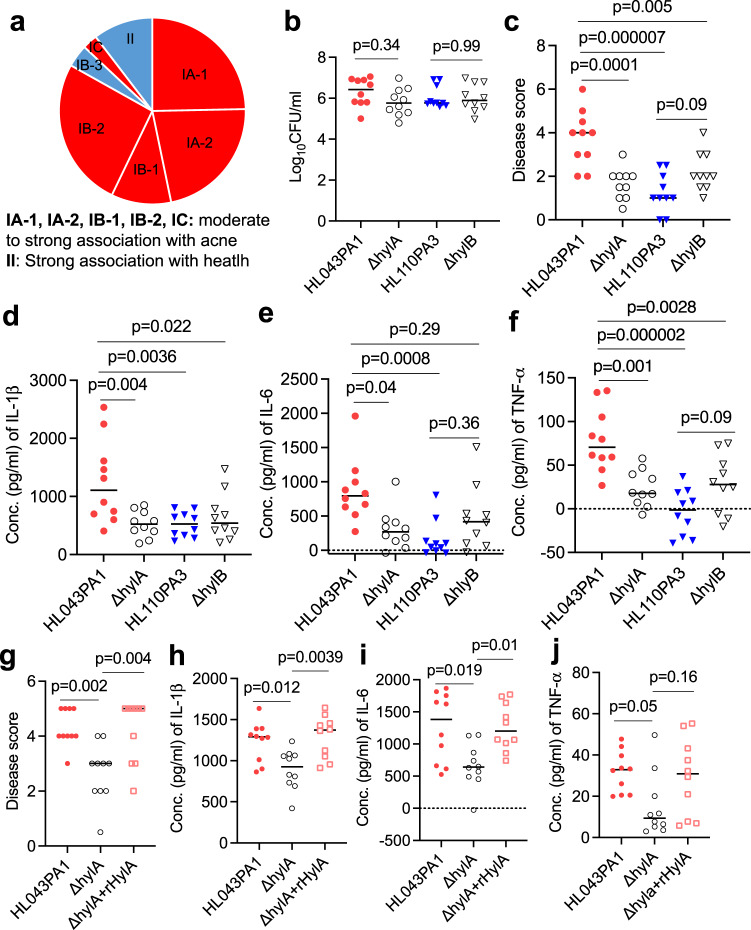
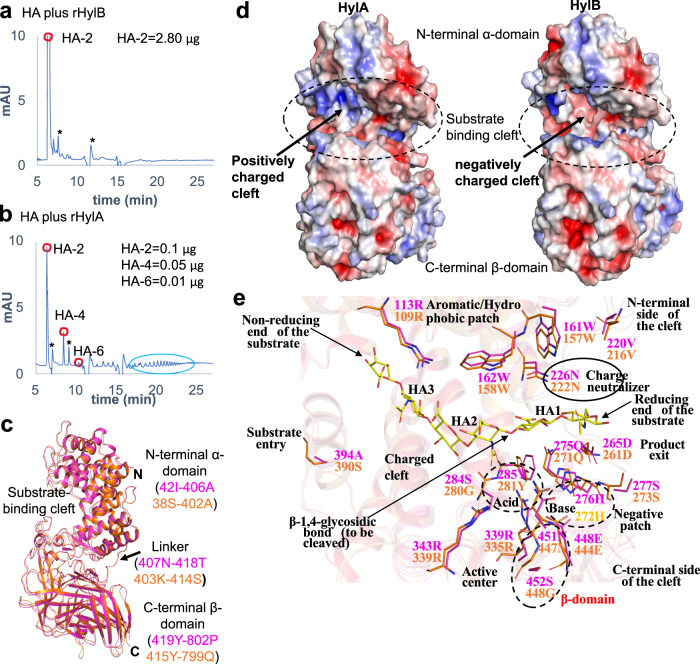
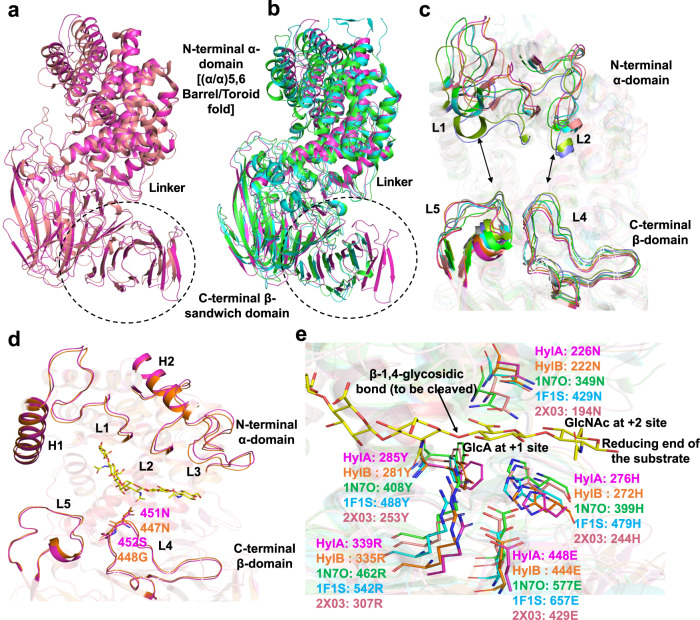
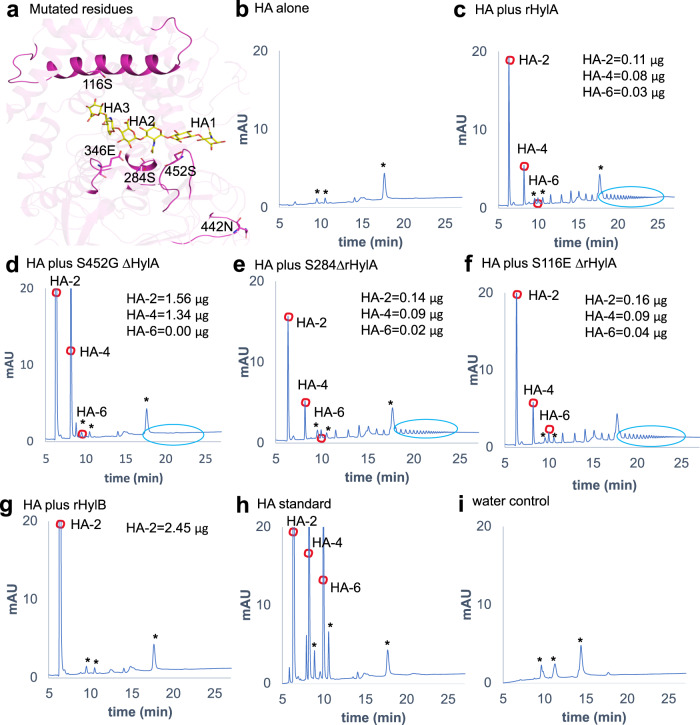
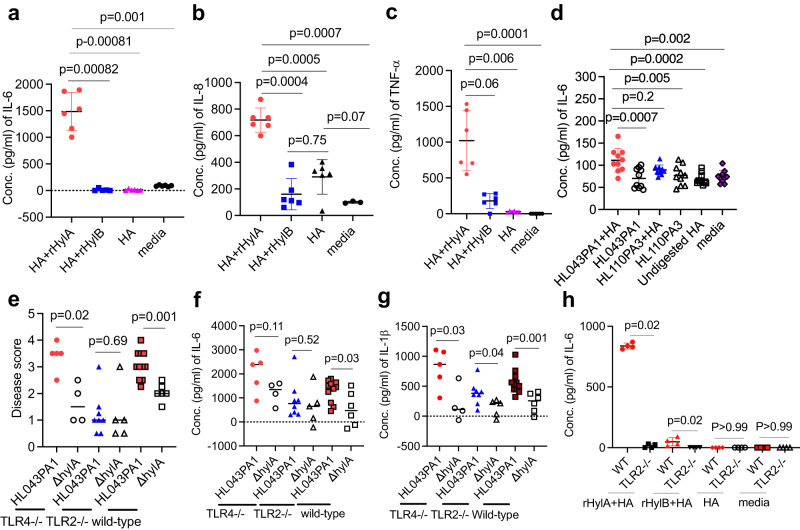
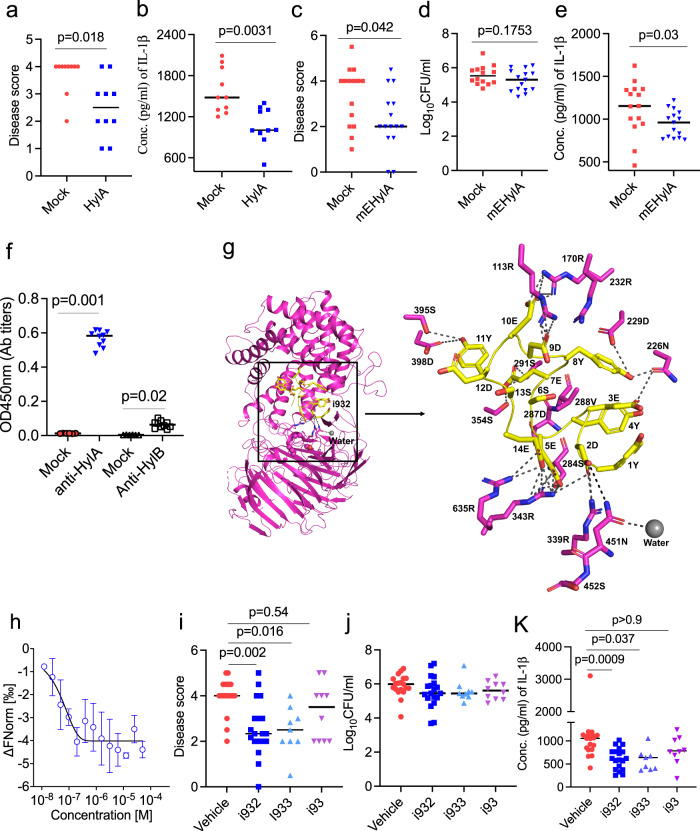
Acne is a dermatologic disease with a strong pathologic association with human commensal Cutibacterium acnes. Conspicuously, certain C. acnes phylotypes are associated with acne, whereas others are associated with healthy skin. Here we investigate if the evolution of a C. acnes enzyme contributes to health or acne. Two hyaluronidase variants exclusively expressed by C. acnes strains, HylA and HylB, demonstrate remarkable clinical correlation with acne or health. We show that HylA is strongly pro-inflammatory, and HylB is modestly anti-inflammatory in a murine (female) acne model. Structural and phylogenic studies suggest that the enzymes evolved from a common hyaluronidase that acquired distinct enzymatic activity. Health-associated HylB degrades hyaluronic acid (HA) exclusively to HA disaccharides leading to reduced inflammation, whereas HylA generates large-sized HA fragments that drive robust TLR2-dependent pathology. Replacing an amino acid, Serine to Glycine near the HylA catalytic site enhances the enzymatic activity of HylA and produces an HA degradation pattern intermediate to HylA and HylB. Selective targeting of HylA using peptide vaccine or inhibitors alleviates acne pathology. We suggest that the functional divergence of HylA and HylB is a major driving force behind C. acnes health- and acne- phenotype and propose targeting of HylA as an approach for acne therapy.


Conflict of interest statement

R.M., G.Y.L., I.A.H. and S.K. have filed for a patent application for the use of selective HylA inhibitors and vaccines as therapeutics. The remaining authors declare no competing interests.

Figures

Fig. 1
Fig. 1. HylA enzyme is a major virulence factor in acne pathogenesis.
a pie chart showing health-and acne-associated C. acnes phylotypes and association with hylA or hylB gene,. bf CD1 mice (n = 10) were infected intradermally (i.d.) with 2x10⁷CFU WT (HL043PA1 or HL110PA3) or isogenic mutant (∆hylA or ∆hylB) C. acnes, followed by topical application of sebum daily. Bacterial burden (b), disease score (c), and cytokines (df) at 2 d (48 h) post-infection. gj CD1 mice (n = 10) were infected as above with either HL043PA1, ∆hylA or ∆hylA plus recombinant (r) HylA protein (10 μg). Disease score (g), and tissue cytokines (h, j) at 2d post-infection. bj Data were from two independent experiments with each data point representing one mouse. Bars denote median. The data in b, c and ei were analyzed by one-way ANOVA with Tukey’s post-hoc test. The data in d and j were analyzed by non-parametric Kruskal-Wallis one-way ANOVA test. Source data are provided as a Source Data file.
Fig. 2
Fig. 2. HA degradation and structural features of HylA and HylB enzymes.
a, b HPLC profile of HMW-HA (2 mg/ml) digested for 24 hr with rHylB or rHylA (0.35 ug). Digested HA peaks (HA-2, −4 and −6) were quantified using known concentrations of purified HA oligosaccharides (see Supplementary Figs. 3, 4). Larger-sized HA fragments, highlighted with a green circle, were visualized only with rHylA-digested HA. Asterisk (*) in a, b represents non-specific peaks. The results are representative of at least 2 independent experiments. c comparison of HylA (PDB: 8FYG) and HylB (PDB: 8FNX) HylB crystal structures. HylA and HylB are shown by cartoon in magenta and orange, respectively. The structural domains, linker and substrate-binding cleft are labeled. d the electrostatic surface view is shown for the HylA and HylB crystal structures. The substrate binding cleft is highlighted in dashed oval. Red and blue correspond to potentials of −5 kT e−1 and 5 kT e−1, respectively. The electrostatic potentials were calculated by APBS in PyMol. e the residue-wise similarities and differences at the substrate-binding cleft of HylA and HylB. The HA-6 ligand is taken from the Streptococcus pneumoniae Hyl (SpHyl) crystal structure (PDB: 1LOH). Source data are provided as a Source Data file.
Fig. 3
Fig. 3. Comparison of HylA and HylB with bacterial and animal Hyl.
a superimposition of HylA (PDB: 8FYG) crystal structure with Hyl from Streptomyces coelicolor (ScHyl). b comparison of HylA crystal structure with Hyl from Streptococcus pneumoniae (SpnHyl) and Streptococcus agalactiae (SaHyl). HylA, ScHyl, SpnHyl, and SaHyl are shown by cartoon representation in magenta, salmon red, green, and cyan, respectively. The PDB IDs for ScHyl, SpnHyl, and SaHyl are 2X03, 2BRW, and 1F1S, respectively. The structural domains and linker are labeled. c the conformations of the substrate-binding cleft are shown. The relative positions of (i.e., the distances between) the L1 and/or L2 loops from the α-domain and the L4 and/or L5 loops from the β-domain defines the open/closed conformation of the Hyl cleft and is denoted by black arrows. The Hyl enzyme’s cleft from different bacteria, including the crystal structures HylA, HylB (PDB: 8FNX), 2X03, 2WCO, 2BRW, 1LOH, 1F1S, and 1LXM are shown by magenta, orange, salmon red, slate blue, green, splitpea green, cyan, and grey70, respectively. d HylA and HylB structural elements that define the catalytic cleft are shown in cartoon representation. HylA and HylB are shown in magenta and orange, respectively. The HA−6 ligand is taken from the SpnHyl crystal structure (PDB: 1LOH) and is shown by sticks in yellow. e the catalytic tetrad (Tyr-His-Arg-Glu) and residues (Asx) involving in the neutralization of the substrate’s acid moiety are shown. The corresponding residues from HylA, HylB, ScHyl, SpnHyl and SaHyl are shown by sticks in magenta, orange, salmon red, green, and cyan, respectively. The HA-6 ligand is taken from the SpnHyl crystal structure (PDB: 1LOH).
Fig. 4
Fig. 4. Enzymatic activity of HylA mutants with single amino acid substitutions.
a position of the amino acid residues (shown by sticks in magenta) on HylA (PDB: 8FYG) crystal structure that were mutated to corresponding HylB residues. The HA−6 ligand is taken from the SpnHyl crystal structure (PDB: 1LOH). bf HPLC profile of HMW-HA after 24 hr coincubation with WT or mutant HylA (0.35 µg): HA alone (b), rHylA (c), or rHylA with single amino acid substitutions (df). g HPLC profile of HMW-HA after 24 hr coincubation with WT rHylB (0.35 µg). h quantification of HA-digested peaks was performed using known concentrations of purified HA oligosaccharides. i water alone run as a blank control. Asterisk (*) in bi represents non-specific peaks, present in water control as well. Data are representative of two independent experiments. Source data are provided as a Source Data file.
Fig. 5
Fig. 5. Proinflammatory properties and TLR2 dependence of Hyl degradation products.
HaCaT cells were stimulated with HA, that had been predigested with either rHylA or rHylB, for 24 hr followed by IL-6 (a), IL-8 (b) and TNF- α (c) measurements in the culture supernatant. d HaCaT cells were stimulated with the HA, predigested with either supernatant from HL043PA1, HL110PA3 or corresponding isogenic mutant for 24 hr followed by IL-6 measurement in the culture supernatant. WT, TLR2-/- and TLR4-/- mice were infected i.d. with WT or isogenic ∆hylA HL043PA1 (2x10⁷CFU) strain as above. Disease score (e) and skin cytokines (f, g) at 24 hr post-infection. h IL-6 in WT or TLR2-/- BMDM culture supernatant after stimulation with rHylA or rHylB digested HA. Data in a (n = 5 for HA + rHylA and 6 for other conditions), b (n = 3 for media and 6 for other conditions), c (n = 6), d (n = 10), h (n = 4), are presented as mean ± SD and each data point represents one well. The data are representative of two independent experiments. eg Bars denote median, and each data point represents one individual mouse (n = 5 TLR4-/-, n = 8 for TLR2-/- or n = 11 for WT mice infected with HL043PA1, and n = 4 for TLR4-/-, n = 5 for TLR2-/- or n = 6 for WT mice infected with isogenic ∆hylA). The p values in a, b were calculated by one-way Welch ANOVA test, p values in c, d were calculated by non-parametric Kruskal-Wallis one-way ANOVA test, and p values in eh were calculated by non-parametric two-tailed Mann-Whitney U test. Source data are provided as a Source Data file.
Fig. 6
Fig. 6. Selective neutralization of HylA improves acne lesions and mitigates inflammation.
a, b CD1 mice (n = 10) immunized with either Alum (Mock) or Alum-rHylA (HylA) were challenged i.d. with HL043PA1. Disease score (a) and IL-1b in skin homogenate at d2 post-challenge. ce mice (n = 15) were immunized intraperitoneally (i.p.) with alum plus C-terminus of tetanus protein (TT) or multiple HylA epitopes linked to TT (mEHylA), then challenged i.d. with HL043PA1 C. acnes strain. Disease score (c) bacterial burden (d), and IL-1b (e) at d2 post-challenge. f serum (1:100,000 diluted) anti-HylA or anti-HylB IgG antibody titers after the third immunization with mEHylA vaccine. g, modeling of the HylA-i932 peptide complex. The i932 peptide docked in the HylA (PDB: 8FYG) active site cleft. The peptide is represented as yellow cartoon with the side chains shown by sticks. h, microscale thermophoresis (MST) analysis of HylA binding to peptide i932. MST dose response curve obtained by titrating the i932 peptide (50 μM to 1.5 nM) against 30 nM fluorescent labeled HylA. ik, inhibitors (i932, i933, or i93) at 10 µg and HL043PA1 strain (2 × 107CFU/mouse) were co-injected i.d. into CD1 mice (n = 19 for vehicle and i932, n = 9 for i933 and n = 10 for i93). Disease score (i), CFU (j), and skin IL-1b (k) d1 (24 hr) post-infection. Bars denote median. Data are from two (a, b, f, ik) or three (ce) independent experiments with each data point representing one mouse. Data in h is represented as mean ±SD of triplicates of one independent experiment and the experiment was repeated three times. The data in ae were analyzed by non-parametric two-tailed Mann-Whitney U test, and in f, ik by non-parametric Kruskal-Wallis one-way ANOVA test. Source data are provided as a Source Data file.

References

    1. Barnard E, et al. The balance of metagenomic elements shapes the skin microbiome in acne and health. Sci. Rep. 2016;6:39491. doi: 10.1038/srep39491. - DOI - PMC - PubMed
    1. Johnson T, et al. Strain-level differences in porphyrin production and regulation in Propionibacterium acnes Elucidate Disease Associations. mSphere. 2016;1:e00023–15. doi: 10.1128/mSphere.00023-15. - DOI - PMC - PubMed
    1. McLaughlin J, et al. Propionibacterium acnes and Acne Vulgaris: New insights from the integration of population genetic, multi-omic, biochemical and host-microbe studies. Microorganisms. 2019;7:128. doi: 10.3390/microorganisms7050128. - DOI - PMC - PubMed
    1. Agak GW, et al. Phenotype and antimicrobial activity of Th17 cells induced by propionibacterium acnes strains associated with healthy and acne skin. J. Invest. Dermatol. 2018;138:316–324. doi: 10.1016/j.jid.2017.07.842. - DOI - PMC - PubMed
    1. Yu Y, et al. Different Propionibacterium acnes phylotypes induce distinct immune responses and express unique surface and secreted proteomes. J. Invest. Dermatol. 2016;136:2221–2228. doi: 10.1016/j.jid.2016.06.615. - DOI - PMC - PubMed

Publication types