. 2023 Dec 5;14(1):8048.
doi: 10.1038/s41467-023-43790-2.

Leukemia-intrinsic determinants of CAR-T response revealed by iterative in vivo genome-wide CRISPR screening

Affiliations

Leukemia-intrinsic determinants of CAR-T response revealed by iterative in vivo genome-wide CRISPR screening

Azucena Ramos et al. Nat Commun. .

Abstract

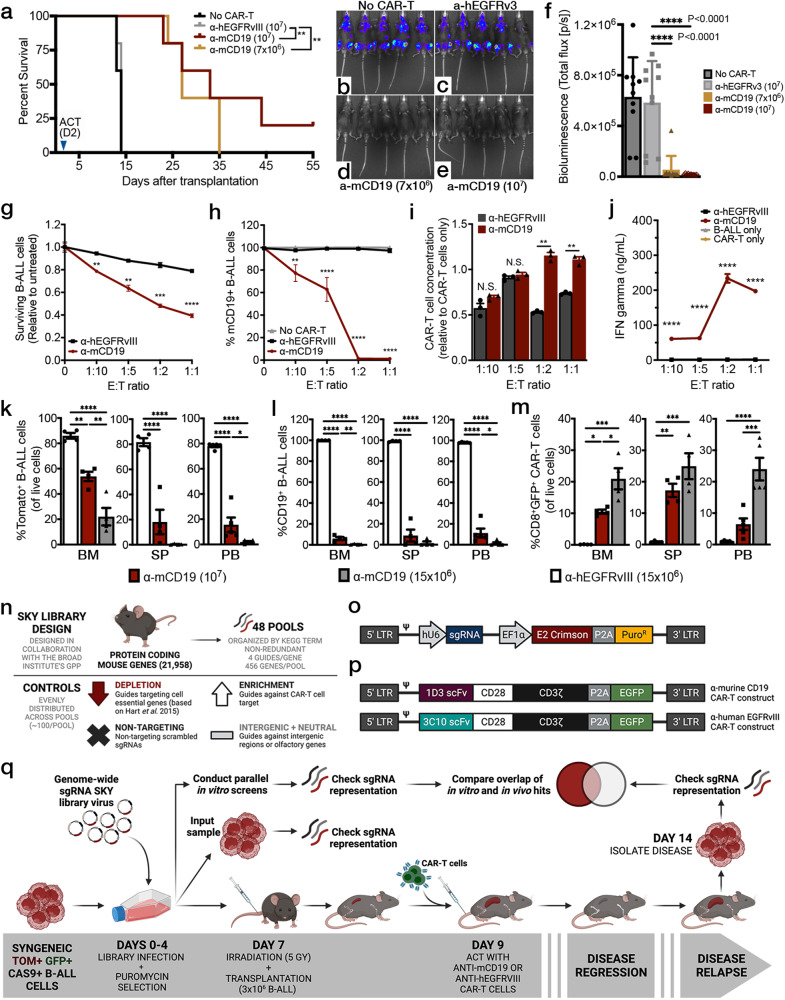
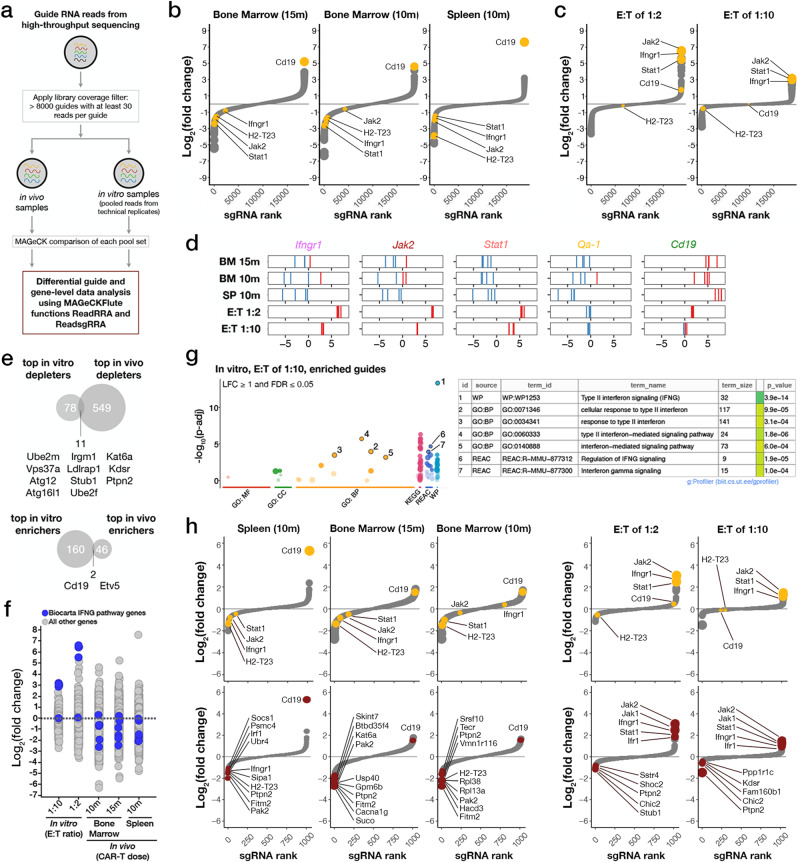
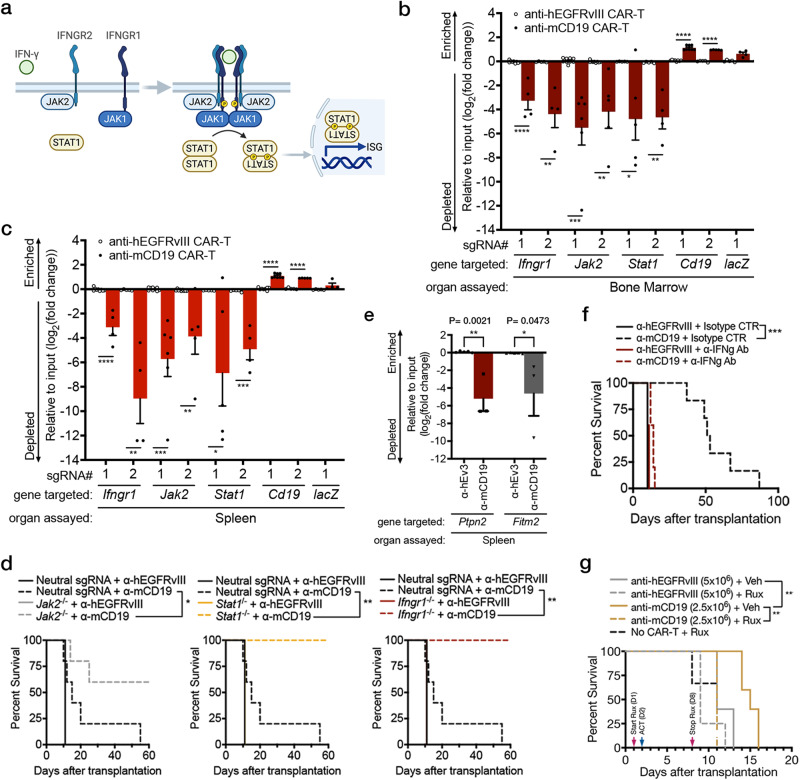
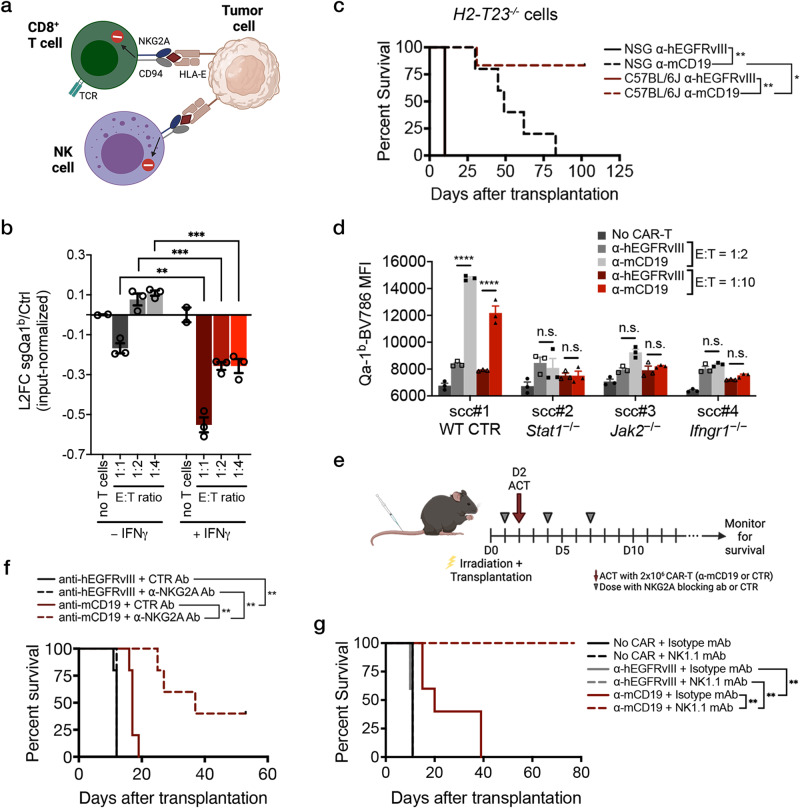
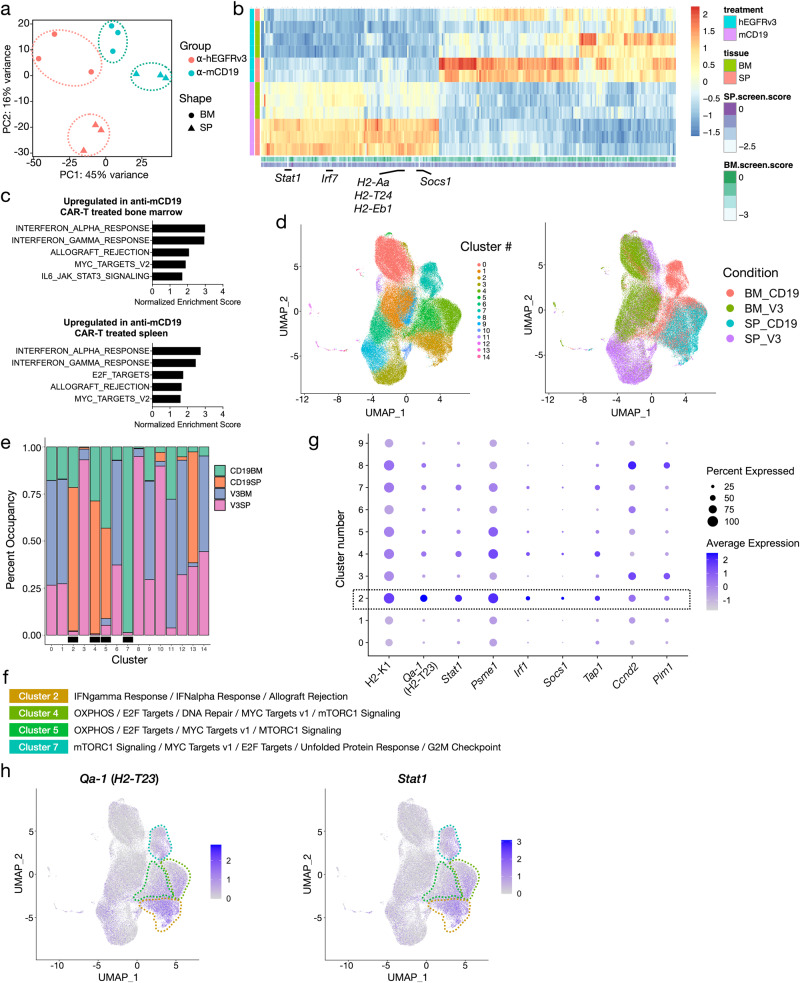
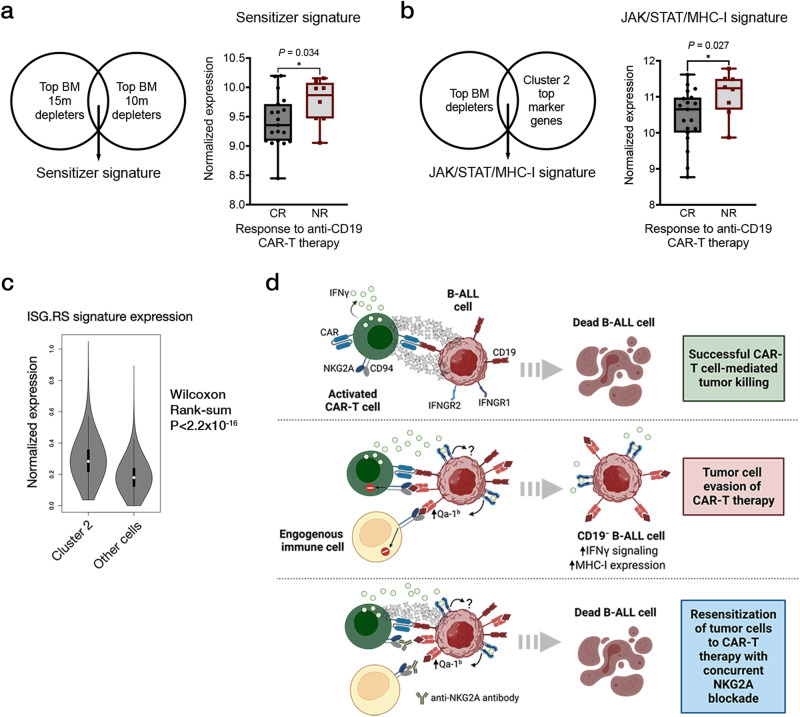
CAR-T therapy is a promising, novel treatment modality for B-cell malignancies and yet many patients relapse through a variety of means, including loss of CAR-T cells and antigen escape. To investigate leukemia-intrinsic CAR-T resistance mechanisms, we performed genome-wide CRISPR-Cas9 loss-of-function screens in an immunocompetent murine model of B-cell acute lymphoblastic leukemia (B-ALL) utilizing a modular guide RNA library. We identified IFNγR/JAK/STAT signaling and components of antigen processing and presentation pathway as key mediators of resistance to CAR-T therapy in vivo; intriguingly, loss of this pathway yielded the opposite effect in vitro (sensitized leukemia to CAR-T cells). Transcriptional characterization of this model demonstrated upregulation of these pathways in tumors relapsed after CAR-T treatment, and functional studies showed a surprising role for natural killer (NK) cells in engaging this resistance program. Finally, examination of data from B-ALL patients treated with CAR-T revealed an association between poor outcomes and increased expression of JAK/STAT and MHC-I in leukemia cells. Overall, our data identify an unexpected mechanism of resistance to CAR-T therapy in which tumor cell interaction with the in vivo tumor microenvironment, including NK cells, induces expression of an adaptive, therapy-induced, T-cell resistance program in tumor cells.


Conflict of interest statement

M.V.M. is on the Board of Directors of 2SeventyBio, and holds equity in TCR2, Century Therapeutics, Oncternal, and Neximmune, and has served as a consultant for multiple companies involved in cell therapies. R.T.M. has received consulting or speaking fees from Bristol Myers Squibb, Gilead Sciences and Immunai Therapeutics, has equity ownership in OncoRev, and receives research funding from Calico Life Sciences. M.G.V.H. declares he is an advisory board member for Agios Pharmaceuticals, Aeglea Biotherapeutics, Faeth Therapeutics, Drioa Ventures and iTeos Therapeutics, and a co-founder of Auron Therapeutics. M.E.B. is an equity holder in 3 T Biosciences, and is a co-founder, equity holder, and consultant of Kelonia Therapeutics and Abata Therapeutics. AR is a co-founder and equity holder of Celsius Therapeutics, an equity holder in Immunitas and, until 31 July 2020, was a scientific advisory board member of Thermo Fisher Scientific, Syros Pharmaceuticals, Neogene Therapeutics and Asimov. AR is an employee of Genentech from August 1st, 2020. The remaining authors declare no competing interests.

Figures

Fig. 1
Fig. 1. A fully immunocompetent mouse model of BCR-ABL1+ B-ALL enables parallel in vivo and in vitro genome-wide screens for CAR-T resistance.
a Survival curves of irradiated B6 mice inoculated with B-ALL cells and treated with indicated CAR-T cell type. Both significant P values displayed = 0.0035. Bioluminescence imaging four days after adoptive cell transfer (ACT) in b untreated mice, c mice treated with 107 control CAR-T cells, d treated with 7 × 106 anti-mCD19 CAR-T cells, or e treated with 107 anti-mCD19 CAR-T cells, and quantified in (f), both significant P values displayed <0.001; n = 10 mice per group from two independent experiments). g In vitro cytotoxicity assays show significant depletion of tumor cells along with h target epitope loss when B-ALL cells are treated with anti-mCD19 CAR-T cells at increasing effector to target cell (E:T) ratios. i Concomitantly, CAR-T cells expand and j release IFNγ when co-cultured with mCD19+ B-ALL cells. For (g–j), n = 3 biologically independent samples per group except for (j) where n = 6 biologically independent samples for the B-ALL only group. km Experiments to determine the appropriate CAR-T cell dose for either the bone marrow (BM) or spleen (SP) using flow cytometry analysis. Peripheral blood (PB) was also assessed (n = 4 mice per group). l Target epitope loss and m significant CAR-T cell persistence was also observed in all of the organs harvested from mice treated with anti-mCD19 CAR-T cells. n Schematic showing the overall design and o lentiviral backbone used to create the SKY library. p Retroviral vectors encoding the 1D3 single chain variable fragment (scFv) targeting mCD19 (top) and the 3C10 scFv targeting hEGFRvIII (bottom). q Diagram of screening layout. Data are mean ± s.e.m. All experiments were repeated at least twice with representative data shown. The significance for survival experiments was determined using log-rank tests. For all other experiments, significance is determined using unpaired two-sided student’s t-tests with Bonferroni correction for multiple comparisons, or using one-way ANOVA with Tukey’s correction for multiple comparisons when more than two groups were compared. *P < 0.05; **P  <  0.01; ***P  <  0.001; ****P  <  0.0001. Exact P values for each comparison shown in (gj) and (km) can be found in Supplementary Data 3.
Fig. 2
Fig. 2. In vivo genome-wide primary and subsequent validation CRISPR-Cas9-mediated knockout screens identify IFNγR/JAK/STAT signaling and antigen presentation pathways involved in resistance to CAR-T therapy.
a Schematic of the data analysis and screen hit discovery workflow. b, c Waterfall plots of log-fold changes of the representation of sgRNAs against different genes in anti-mCD19 CAR-T cell treated animals b or cells c compared to anti-hEGFRvIII CAR-T cell treated animals b or cells c at indicated doses (15 m or 1.5 × 107 CAR-T cells, 10 m or 1 × 107 CAR-T cells, effector to target (E:T) ratios of 1:2, or 1:10). For in vivo screens, the organ from which guide-bearing B-ALL cells were collected is also indicated. Genes are ranked by the average log2fold changes (L2FC) of all sgRNAs against each gene, and point sizes are proportional to the magnitude (absolute value) of L2FC. Waterfall plots display relative biological effect of each hit versus guide ranks. d Relative enrichment/depletion of individual guides against top depleting genes Ifngr1, Jak2, Stat1, and Qa-1b are shown in each arm of the screen. Guide RNAs against Cd19 are also shown as an indicator of CAR-T treatment pressure. Enriched gRNAs are shown in red. Depleted gRNAs are shown in blue. e Venn diagrams showing overlap of top hits from the primary in vitro and in vivo screens. f A strip chart representation of the L2FC of sgRNAs targeting genes in the Biocarta_IFNG_Pathway (shown in blue) upon treatment with Cd19 CAR-T cells in vitro (left two columns) or in vivo (right three columns). g (Left) A gprofiler plot showing the pathways targeted by the most enriched sgRNAs in the in vitro E:T of 1:10 treatment cohort. (Right) A table showing a list of pathways targeted by the most enriched sgRNAs. h Waterfall plots from the validation screen showing the representation of sgRNAs targeting different genes in anti-mCD19 CAR-T cell treated animals or cultured cells compared to control treated organs or cultured cells. Waterfall plots on top show sgRNAs targeting Cd19 and select interferon gamma pathway genes (in yellow). Waterfall plots below show the top ten depleted, or top five depleted/enriched sgRNAs in each context.
Fig. 3
Fig. 3. Loss of components of the IFNγR/JAK/STAT pathway sensitizes tumors to CAR-T therapy in vivo.
a Schematic showing the IFNγR signaling pathway. b, c In vivo competitive assays demonstrate specific depletion of Cas9+ RH62 B-ALL cells lacking components of the IFNγR/JAK/STAT pathway and enrichment of B-ALL cells lacking mCD19 after treatment with anti-mCD19 CAR-T cells in b the bone marrow and c spleen. For b, c, n = 9 for the groups Ifngr1 sgRNA#1, Jak2 sgRNA#1 and 2, treated with anti-hEGFRvIII CAR-T cells; n = 8 for the groups Cd19 sgRNA#1 treated with anti-hEGFRvIII or anti-mCD19 CAR-T cells; n = 6 for the group Jak2 sgRNA#1 treated with anti-mCD19; n = 4 for the groups Ifngr1 sgRNA#1 and 2, Stat1 sgRNA#2, and lacZ sgRNA#1, treated with anti-mCD19 CAR-T cells; n = 5 for all other groups. d Kaplan-Meier curves showing survival in immunocompetent mice transplanted with B-ALL cells deficient in the indicated IFNγR/JAK/STAT pathway member. e In vivo competitive assays demonstrate specific depletion of Cas9+ RH62 B-ALL cells lacking Ptpn2 or Fitm2 after treatment with anti-mCD19 CAR-T cells in the spleen. Data shown is from flow cytometry analyses examining the proportion of live B-ALL cells that are APC+ and therefore, also guide-bearing. In these experiments, n = 5 mice in groups treated with anti-hEGFRvIII CAR-T cells and n = 3 mice in groups treated with anti-mCD19 CAR-T cells. f A Kaplan–Meier curve showing overall survival in leukemia-bearing mice treated with 2.5 × 106 control or anti-mCD19 CAR-T cells in the presence or absence of blocking IFNγ antibody. g A Kaplan-Meier curve of overall survival in leukemia-bearing mice treated with control or 2.5 × 106 anti-mCD19 CAR-T cells in the presence or absence of Ruxolitinib, a JAK1/2 inhibitor. In vivo competition assays were repeated three times. Survival experiments were completed twice. Pharmacologic studies using anti-IFNγ blocking antibodies or JAK inhibitor were completed twice. The significance of survival experiments was determined using log-rank tests. For all other experiments, significance was determined using unpaired two-sided student’s t-tests with Bonferroni correction for multiple comparisons. Data are mean ± s.e.m. *P < 0.05; **P  <  0.01; ***P  <  0.001; ****P  <  0.0001. Exact P values for each comparison shown in (b-d) and (f-g) can be found in Supplementary Data 3.
Fig. 4
Fig. 4. Loss of Qa-1b, a component of the MHC-I pathway, or pharmacologic blockade of NKG2A, the only known receptor of Qa-1b, sensitizes B-ALL cells to CAR-T therapy in vivo.
a Schematic showing known effects of the HLA-E/NKG2A/CD94 axis in human NK and CD8+ T-cells. b In vitro competitive assays where CD19-expressing H2-T23−/− and CD19-expressing H2-T2+/+ pancreas cancer cells were mixed in a 50:50 ratio and exposed to the indicated concentration of anti-mCD19 CAR-T cells. The log2fold change (L2FC) of H2-T23−/− to control cells is shown. Cells were either pre-treated (right) with exogenous recombinant IFNγ or left untreated throughout the experiment (left). For the no T cells groups, n = 2 biologically independent samples; n = 5 for all other groups. c Immunocompetent (C57BL/6 J) mice transplanted with H2-T23−/− cells show increased survival compared to immunocompromised (NSG) mice transplanted with the same H2-T23−/− cells and treated with anti-mCD19 CAR-T cells (n = 5 mice per group). d Mean fluorescence intensity (MFI) of Qa-1b-Brilliant Violet 786 (BV786) after in vitro CAR-T treatment of single cell clones (scc) deficient in IFNγR/JAK/STAT pathway members at two different E:T ratios. Wildtype scc were also assayed, as shown. e Treatment schedule for the anti-NKG2A blocking antibody experiment. f A Kaplan-Meier curve showing overall survival in mice treated with a murine version of the anti-NKG2A antibody, monalizumab or a control antibody, concurrently with mCD19 or control hEGFRvIII CAR-T cells, as indicated. g Kaplan-Meier curves showing overall survival in mice treated concurrently with either anti-NK1.1 or isotype control antibodies along with either anti-mCD19, anti-hEGFRvIII, or no CAR-T cells. In this experiment, mice were pre-treated with anti-NK1.1 antibody one day prior to CAR-T therapy. The survival experiments and in vitro CAR-T treatment of H2-T23−/− cells were completed at least twice and were paired each time. Pharmacologic experiments were completed once. The significance of survival experiments was determined using log-rank tests. For all other experiments, significance was determined using unpaired two-sided student’s t-tests with Bonferroni correction for multiple comparisons. Data are mean ± s.e.m. *P < 0.05; **P  <  0.01; ***P  <  0.001; ****P  <  0.0001. Exact P values for each comparison shown in (bd) and (fg) can be found in Supplementary Data 3.
Fig. 5
Fig. 5. Bulk and single cell gene expression profiling pinpoints specific cell subsets and expression programs as a source of CAR-T cell resistance in B-ALL.
a PCA plot of bulk RNA-seq profiles of bone marrow (BM) and spleen (SP) samples collected from mice treated with either anti-mCD19 or anti-hEGFRvIII (control) CAR-T cells. b Heatmap of genes differentially expressed between anti-mCD19 and anti-hEGFRvIII CAR-T cell-treated samples. Scores of genes from the screen are shown next to each gene’s expression profile (column). Top depleting sgRNAs in the BM and SP are labeled. c Top Hallmark gene sets enriched among genes overexpressed in mCD19 CAR-T cell therapy compared to control treated BM or SP samples. Bar graphs show normalized enrichment scores for each of the top 5 enriched pathways. Enrichment analysis was performed using GSEA and all pathways shown have FDR < 0.05. d 2-dimensional UMAP plots of single cell gene expression profiles collected from mice treated with either anti-mCD19 or anti-hEGFRvIII CAR-T cells. Data are collected from n = 3 mice per treatment group. Left: cells color-coded by clusters discovered through unsupervised clustering. Right: cells color-coded by treatment and tissue groups. e Participation of cells from each tissue/treatment group in each cluster. Bar graphs show percentage of cells in each cluster belonging to each tissue/treatment group (anti-mCD19 CAR-T cell treated BM or SP labeled CD19BM and CD19SP, respectively; anti-hEGFRvIII control CAR-T treated BM or SP labeled V3BM and V3SP, respectively). Clusters where there is substantial enrichment of cells under anti-mCD19 CAR-T therapy are marked with a black box underneath the bar plots. f Hallmark gene sets enriched in the 4 treatment-specific clusters as labeled in (e). g Dot plot showing relative expression patterns of cluster 2 genes which are also among top depleting sgRNAs (L2FC < −1.75) in the BM samples of the in vivo screen. Dot size is proportional to the percentage of cells in each cluster expressing each gene and dot color indicates average expression of each gene in each cluster. h UMAP plots showing expression of Qa-1b and Stat1 in single cell samples, with cells color-coded by expression levels.
Fig. 6
Fig. 6. JAK/STAT signaling is a potential therapeutic target in human B-ALL that can be exploited to enhance CAR-T therapy.
a Normalized expression of a sensitizer gene signature (composed of top depleting genes in the BM arms of our screen) in pre-treatment leukemia samples from patients who are complete responders (CR) or non-responders (NR) to anti-hCD19 CAR-T therapy. The five number summaries of the CR and NR boxplots are 8.45, 9.09, 9.36, 9.72, 10.20, and 9.05, 9.47, 9.87, 10.08, 10.15, respectively. b Normalized expression of a JAK/STAT/MHC-I resistance signature in the same pre-treatment leukemia samples shown in (a). The five number summaries of the CR and NR boxplots are 8.77, 10.01, 10.65, 10.98, 11.62, and 9.87, 10.64, 11.24, 11.50, 11.78, respectively. For (a-b), the plots are graphed from minima to maxima and all data points are overlaid. c Normalized expression of the immune checkpoint blockade resistance-associated interferon-stimulated genes (ISG.RS) signature in B-ALL cells (after CAR-T failure) residing in expression cluster 2 or other cells. The ISG.RS signature is associated with poor outcomes in patients with large B-cell lymphoma treated with anti-CD19 CAR-T cells. A two-sided Wilcoxon rank-sum test was performed to compare the two distributions shown. An exact P value cannot be numerically determined due to ties in rank sum tests. A numerically approximate P value is shown. The plots are graphed in the Tukey method. The five-number summary for cluster 2 cells (left) is 0.036, 0.22, 0.28, 0.36, 0.57, and 0, 0.12, 0.18, 0.24, 0.42 for all other cells (right). d A final model for how high IFNγR/JAK/STAT signaling in tumor cells can promote resistance to CAR-T therapy via the upregulation of the NK and CD8+ T-cell inhibitory molecule Qa-1b, the murine homolog of HLA-E. Except where indicated, significance is determined using unpaired two-sided student’s t-tests with Bonferroni correction for multiple comparisons. Data are mean ± s.e.m. *P < 0.05; **P  <  0.01; ***P  <  0.001; ****P  <  0.0001.

References

    1. Tang J, Shalabi A, Hubbard-Lucey VM. Comprehensive analysis of the clinical immuno-oncology landscape. Ann. Oncol. 2018;29:84–91. doi: 10.1093/annonc/mdx755. - DOI - PubMed
    1. June CH, Sadelain M. Chimeric antigen receptor therapy. N. Engl. J. Med. 2018;379:64–73. doi: 10.1056/NEJMra1706169. - DOI - PMC - PubMed
    1. June CH, O’Connor RS, Kawalekar OU, Ghassemi S, Milone MC. CAR T cell immunotherapy for human cancer. Science (1979) 2018;359:1361–1365. - PubMed
    1. Locke FL, et al. Phase 1 results of ZUMA-1: a multicenter study of KTE-C19 anti-CD19 CAR T cell therapy in refractory aggressive lymphoma. Mol. Ther. 2017;25:285–295. doi: 10.1016/j.ymthe.2016.10.020. - DOI - PMC - PubMed
    1. Maude SL, et al. Tisagenlecleucel in children and young adults with B-cell lymphoblastic leukemia. N. Engl. J. Med. 2018;378:439–448. doi: 10.1056/NEJMoa1709866. - DOI - PMC - PubMed

Publication types

Substances

Associated data