. 2023 Dec;20(12):2034-2047.
doi: 10.1038/s41592-023-02080-x. Epub 2023 Dec 5.

In vitro modeling of the human dopaminergic system using spatially arranged ventral midbrain-striatum-cortex assembloids

Affiliations

In vitro modeling of the human dopaminergic system using spatially arranged ventral midbrain-striatum-cortex assembloids

Daniel Reumann et al. Nat Methods. 2023 Dec.

Abstract

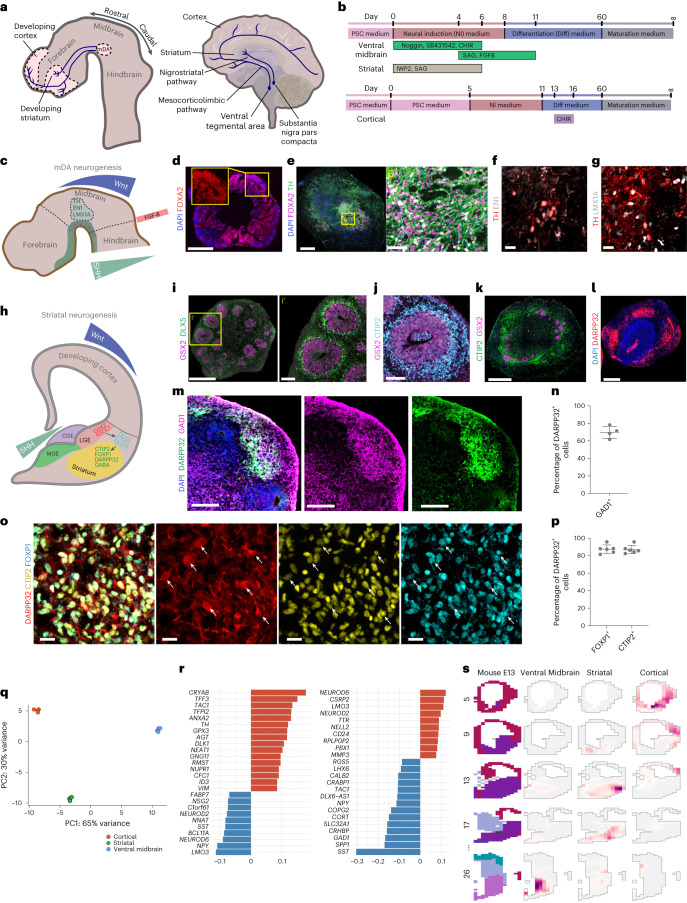
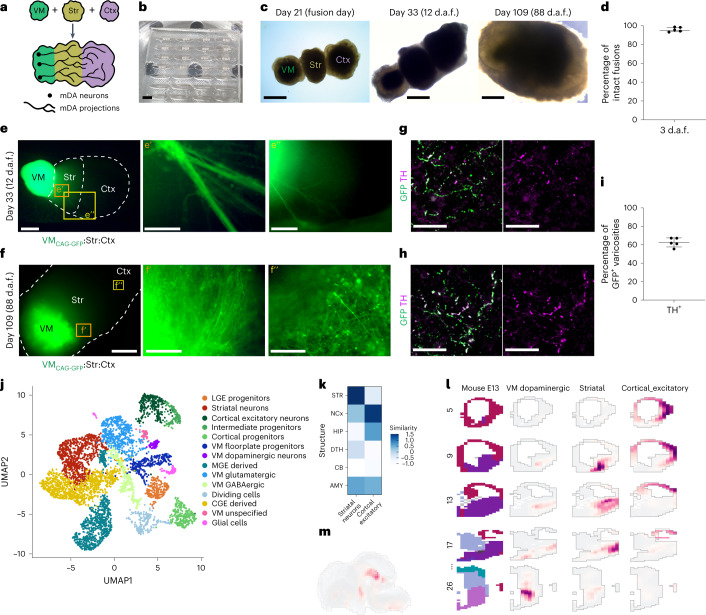
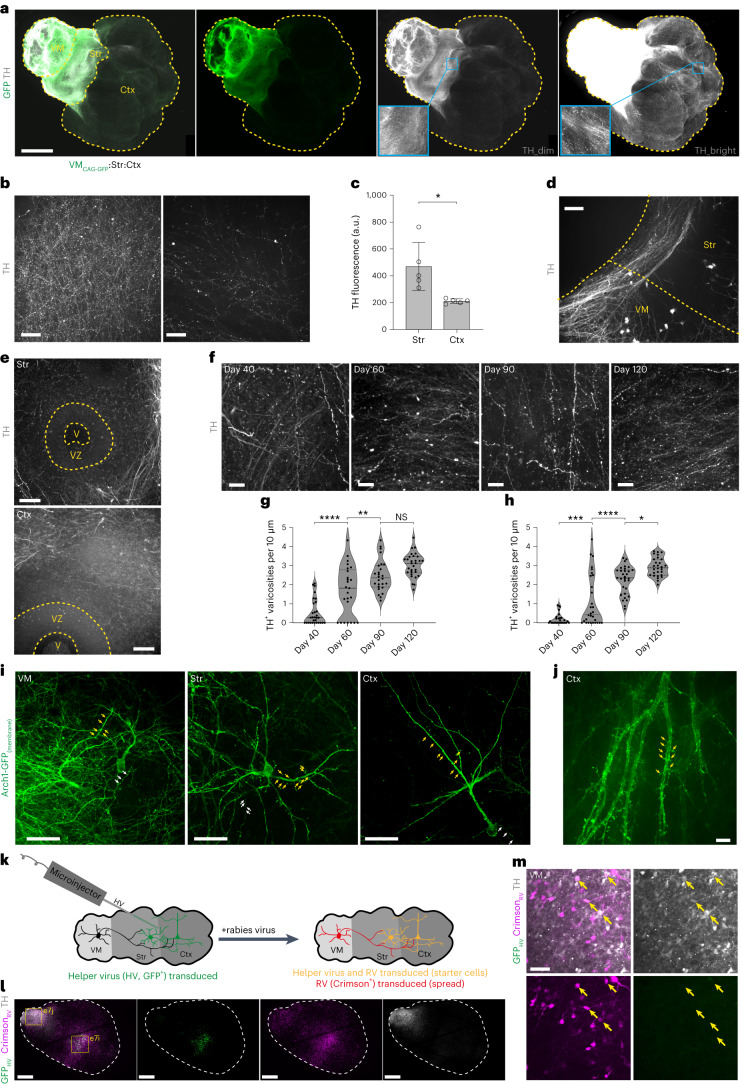
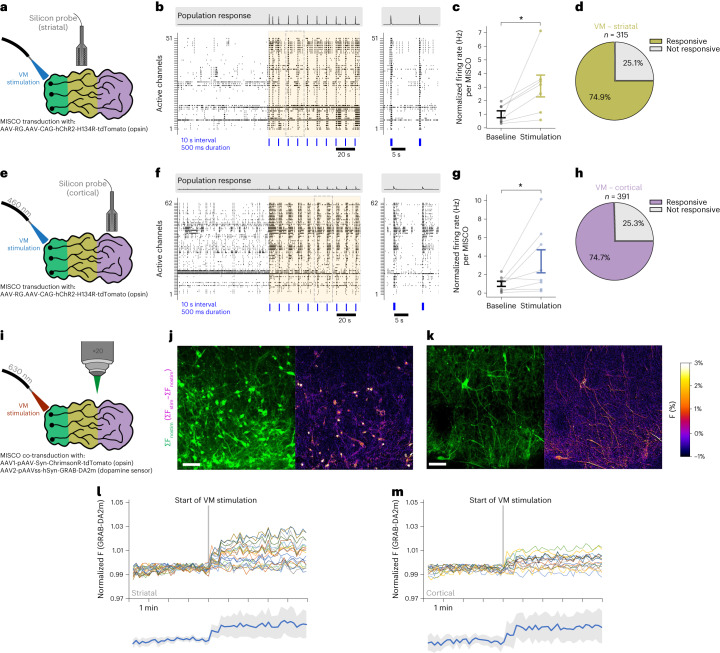
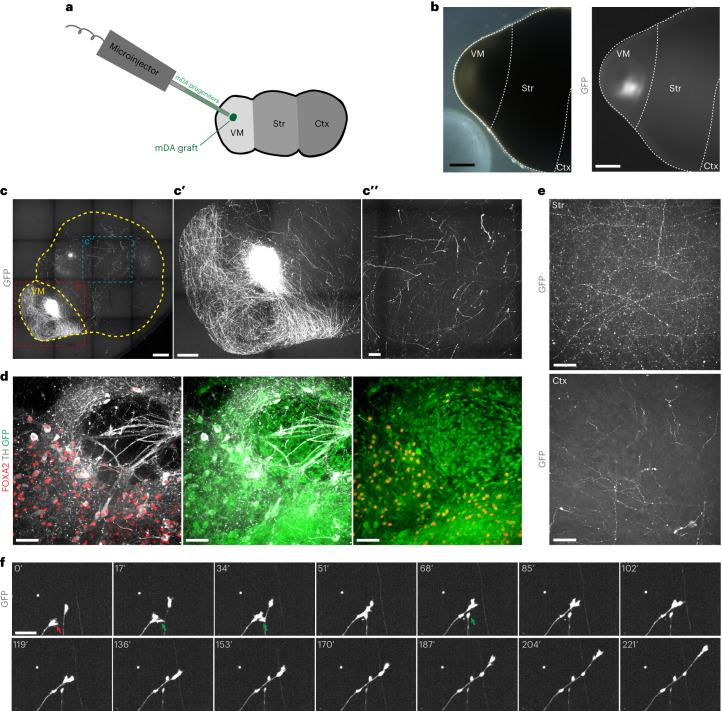
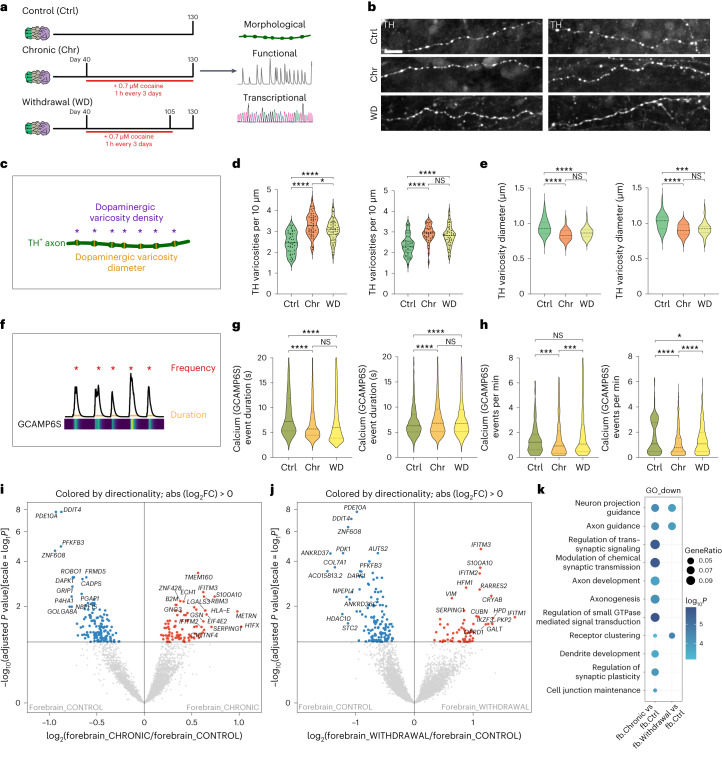
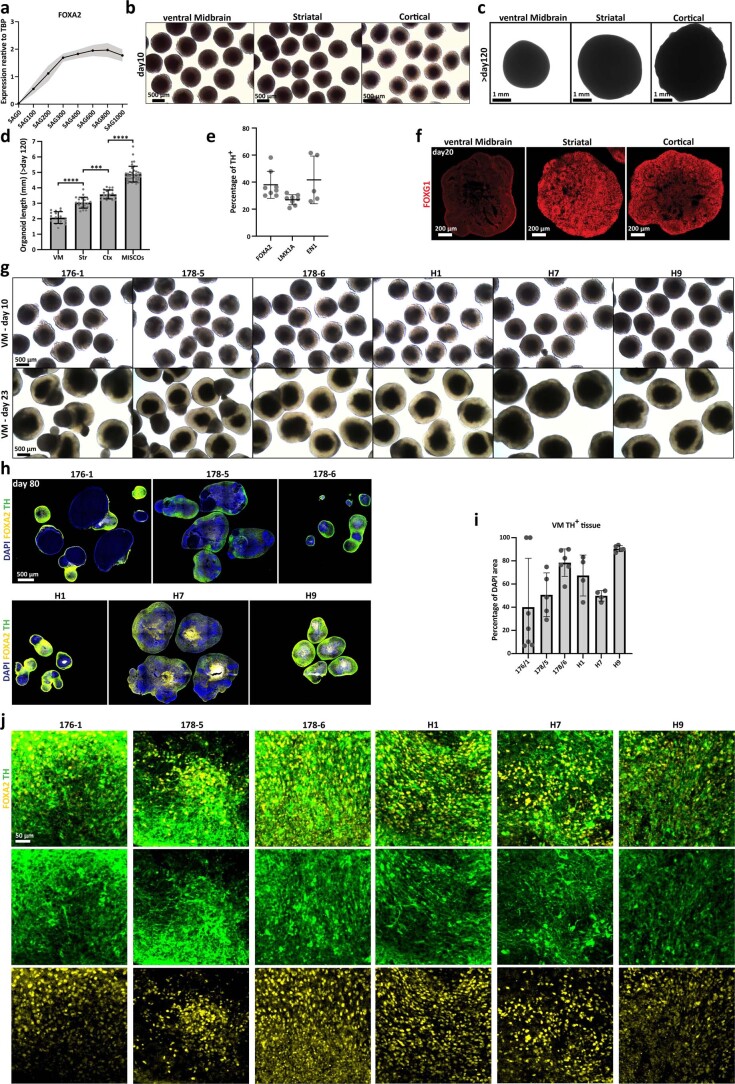
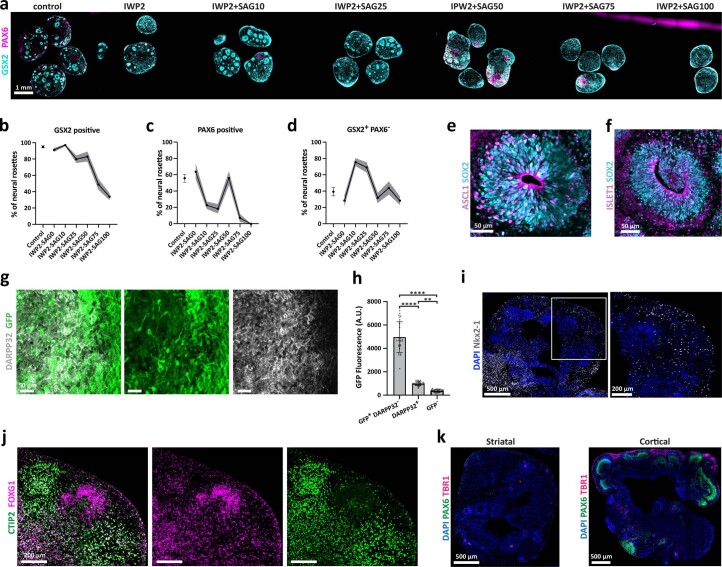
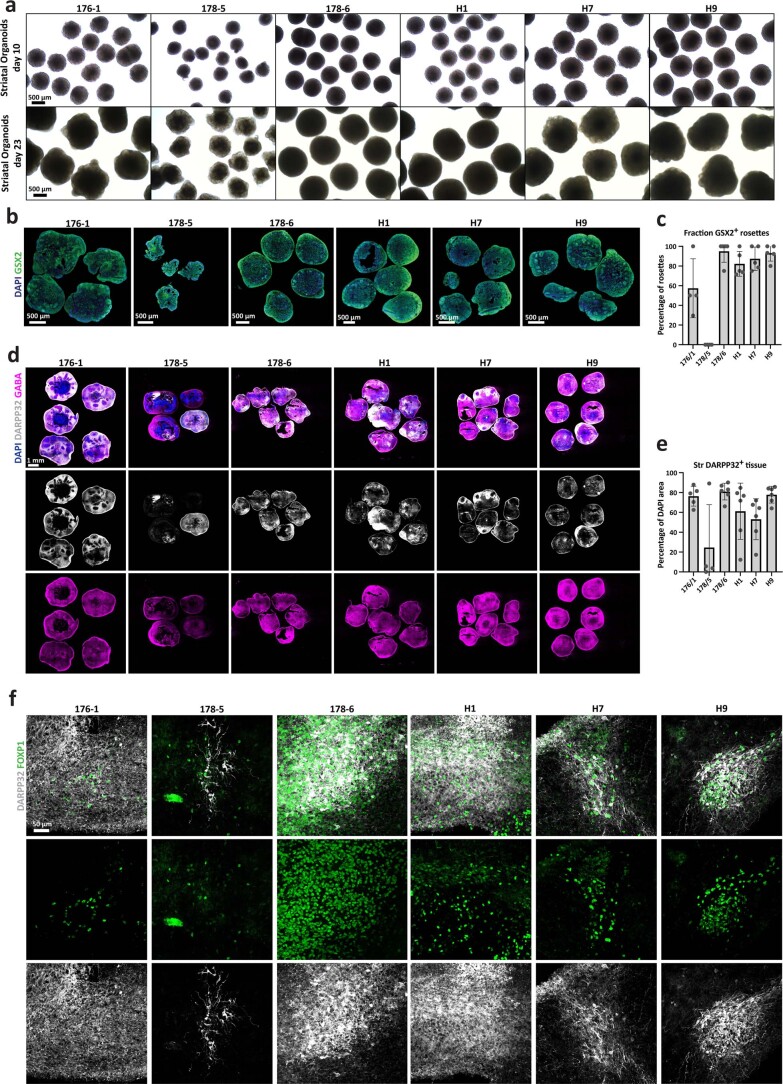
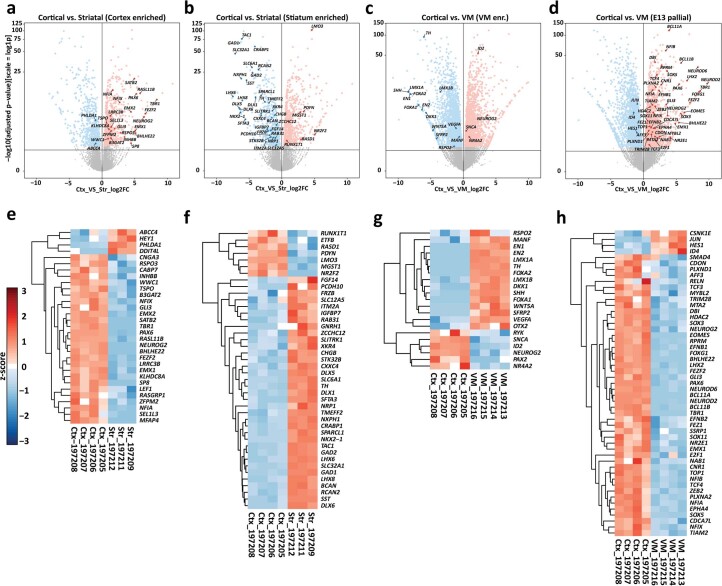
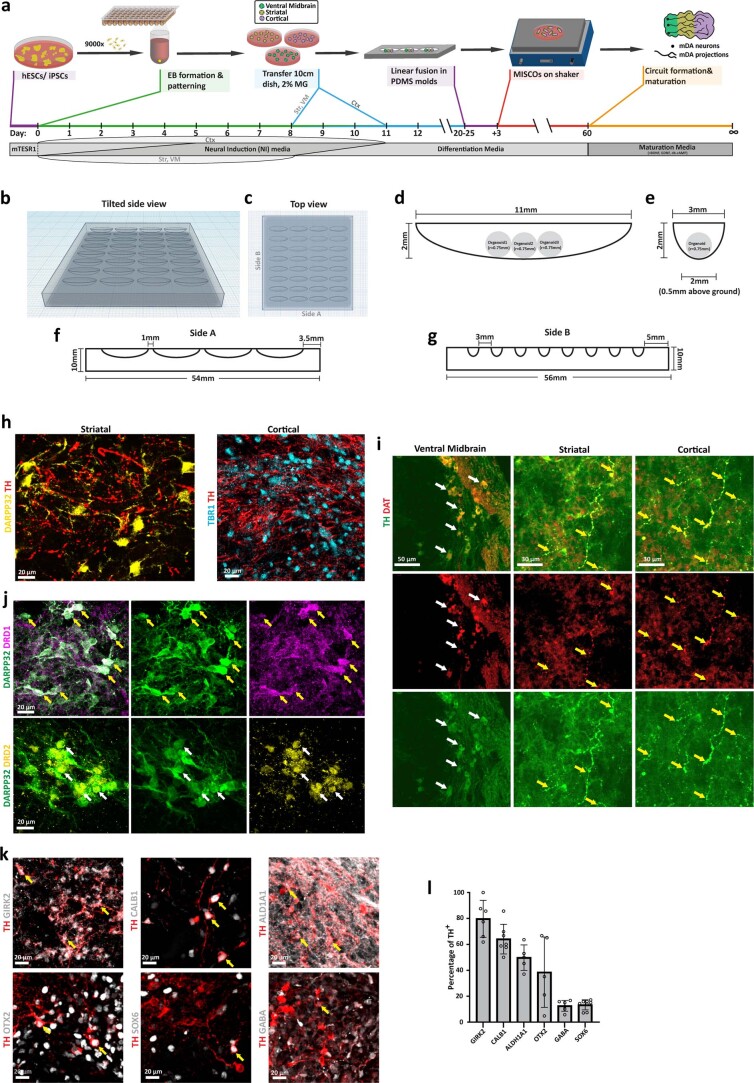
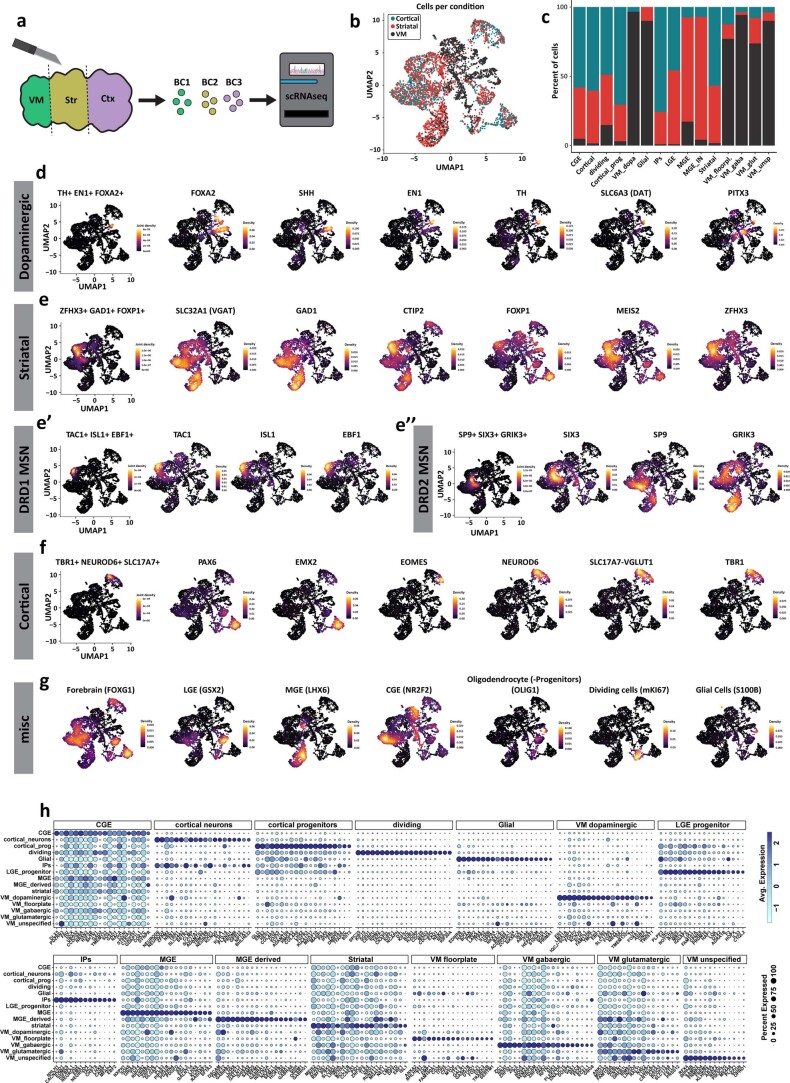
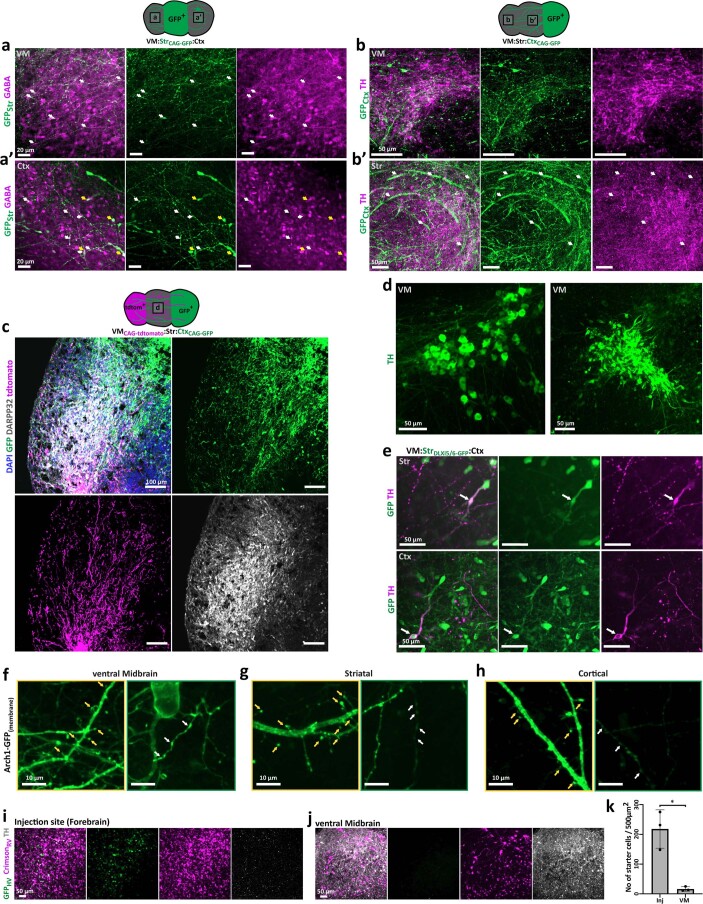
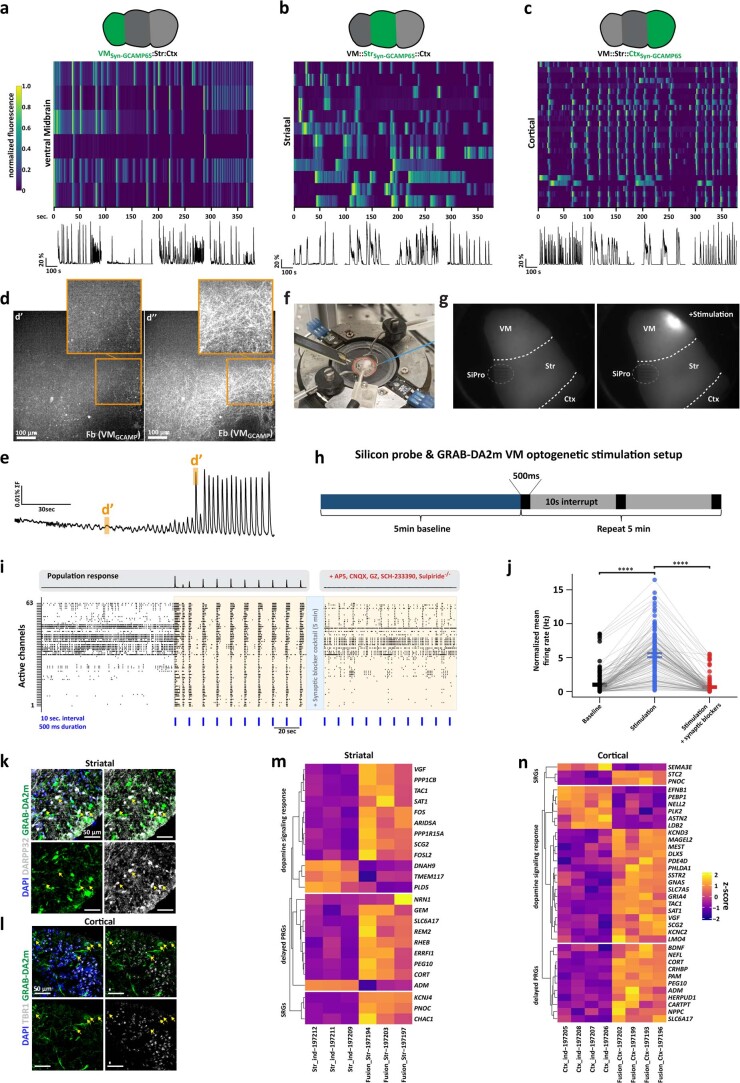
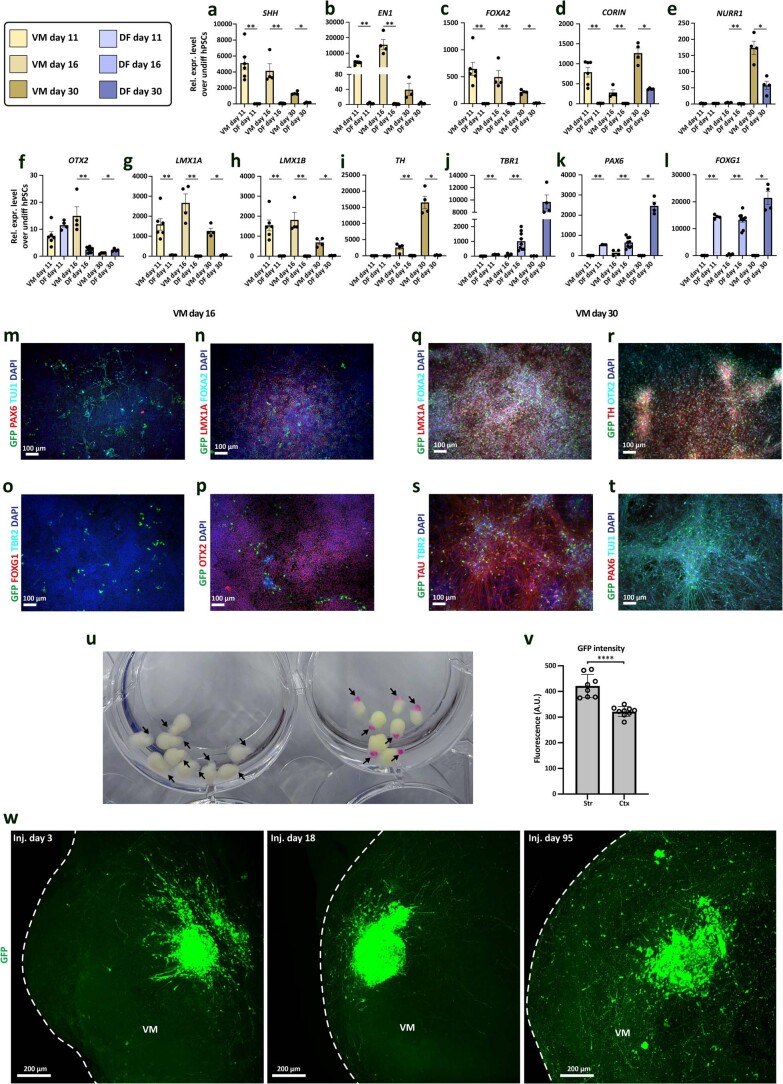
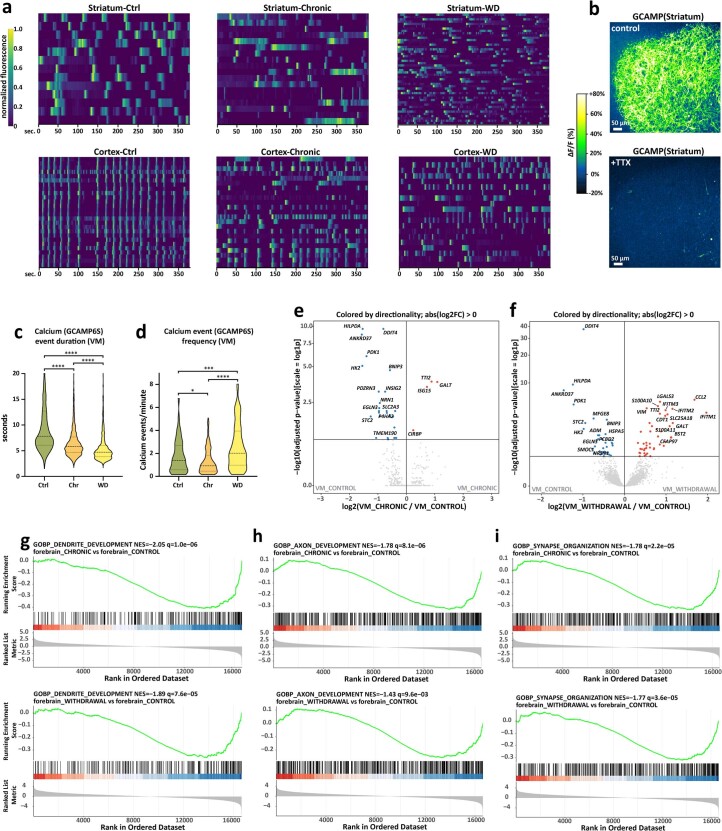
Ventral midbrain dopaminergic neurons project to the striatum as well as the cortex and are involved in movement control and reward-related cognition. In Parkinson's disease, nigrostriatal midbrain dopaminergic neurons degenerate and cause typical Parkinson's disease motor-related impairments, while the dysfunction of mesocorticolimbic midbrain dopaminergic neurons is implicated in addiction and neuropsychiatric disorders. Study of the development and selective neurodegeneration of the human dopaminergic system, however, has been limited due to the lack of an appropriate model and access to human material. Here, we have developed a human in vitro model that recapitulates key aspects of dopaminergic innervation of the striatum and cortex. These spatially arranged ventral midbrain-striatum-cortical organoids (MISCOs) can be used to study dopaminergic neuron maturation, innervation and function with implications for cell therapy and addiction research. We detail protocols for growing ventral midbrain, striatal and cortical organoids and describe how they fuse in a linear manner when placed in custom embedding molds. We report the formation of functional long-range dopaminergic connections to striatal and cortical tissues in MISCOs, and show that injected, ventral midbrain-patterned progenitors can mature and innervate the tissue. Using these assembloids, we examine dopaminergic circuit perturbations and show that chronic cocaine treatment causes long-lasting morphological, functional and transcriptional changes that persist upon drug withdrawal. Thus, our method opens new avenues to investigate human dopaminergic cell transplantation and circuitry reconstruction as well as the effect of drugs on the human dopaminergic system.


Conflict of interest statement

J.A.K. is an inventor on a patent describing cerebral organoid technology (European patent application no. EP2743345A1), and is a co-founder and member of the scientific advisory board of a:head bio AG. J.A.K. and D.R. are inventors on a patent application describing brain organoid fusion technology (patent application no. EP22177191.8). M.M.S, K.I.R.-R., D.R. and J.A.K. are inventors on a patent describing organoid technology (patent submission ID: GB2206768.0). M. Parmar is the owner of Parmar Cells that holds related intellectual property (US patent 15/093,927, 570 PCT/EP17181588), performs paid consultancy to Novo Nordisk AS and serves on the scientific advisory board for Arbor Biotechnologies. C.B. is an inventor on a patent about cell culture media for neuronal cell culture (BrainPhys) (international publication number: WO2014/172580A1). All other authors have no competing interests.

Figures

Fig. 1
Fig. 1. Generation of patterning protocols for ventral midbrain and striatal organoids.
a, The dopaminergic system during development (left) and in the adult human brain (right). The axons of midbrain dopaminergic (mDA) neurons innervating striatal and cortical tissue are highlighted in blue. b, Patterning timings and factors used for the generation of ventral midbrain, striatal and cortical organoids. c, Schematic diagram of ventral midbrain dopaminergic neurogenesis including key morphogenic gradients. d, Ventral midbrain patterned organoids treated with 300 nM SAG express the floor plate marker FOXA2 on day 20 (representative image, similar results in n = 20 of 20 organoids of five cell lines). e, 44-day-old ventral midbrain organoids show clusters of TH-positive and FOXA2-positive mDA neurons (representative image, similar results in n = 8 of 8 organoids of two batches and two cell lines). Yellow box: magnified view in eʹ. f,g, 80-day-old TH-positive neurons express the mDA neuronal markers EN1 and LMX1A. h, Schematic diagram of striatal neurogenesis including key morphogenic gradients. i,j, Day 30 striatal patterned organoids show GSX2-positive rosettes (representative images, similar results in n = 28 of 32 organoids of six cell lines with one cell line (178-5) failing to produce GSX2-positive rosettes (Extended Data Fig. 4b,c)) and produce DLX5-positive (i) and CTIP2-positive (j) neurons (representative image, similar results in n = 4 of 4 organoids). Yellow box in i: magnified view in iʹ. k, Day 60 striatal organoids still contain GSX2-positive LGE progenitors and are broadly composed of CTIP2-positive neurons (representative image, similar results in n = 9 of 9 organoids of two batches). l, Striatal patterned organoids produce DARPP32-positive clusters of neurons (representative image, similar results in 35 of 38 organoids of six cell lines with one iPS cell line (178-5) being mostly negative for DARPP32 (Extended Data Fig. 4c)). m,n, DARPP32-positive neurons broadly express the GABAergic marker GAD1 (n = 4 of 4 organoids of two batches). o,p, DARPP32-positive cells express the striatal markers CTIP2 and FOXP1 (n = 6 of 6 organoids of two batches). White arrows indicate triple-positive cells. q, PCA of the top 500 variable genes of RNA-seq of individual ventral midbrain, striatal and cortical, patterned organoids on day 60 (n = 3–4 organoids per group). r, Genes with the highest loading on PC1 (left) and PC2 (right), by PCA of the top 500 variable genes. s, VoxHunt spatial similarity mapping of bulk RNA-seq data of ventral midbrain, striatal and cortical organoids to E13.5 Allen Developing Mouse Brain Atlas data with sections colored by scaled expression similarity scores. Data given as mean ± s.d. Scale bars: d,e,i,k,l, 500 µm; m, 200 µm; ,, 100 µm; j, 50 µm; f,g,o, 20 µm. Source data
Fig. 2
Fig. 2. PDMS mold-assisted spatially arranged fusion of ventral midbrain, striatal and cortical organoids enables the observation of dopaminergic innervation into striatal and cortical tissues.
a, Schematic diagram of the generation of linear anterior–posterior-positioned fused organoids from ventral midbrain (VM), striatal (Str) and cortical (Ctx) organoids. b, PDMS embedding molds with juxtaposed VM–striatal–cortical organoids. c, Triple-fused organoids readily grow together and form a homogeneous tissue. d.a.f., days after fusion. (Representative images; similar results in n = 3–6 organoids per timepoint.) d, Quantification of fusion efficiency of five batches and a total of 365 fusions. A mean of 96% (±2.4% s.d.) of fusions remained intact after the fusion procedure across multiple batches. e, 12 days after fusion (day 33 of organoid age), the first neurite outgrowth can be observed in CtxWT-StrWT-VMCAG-GFP-labeled MISCOs (representative images, similar results in n = 6 of 6 organoids of two batches). Orange and yellow boxes: magnified view in and eʹʹ. f, On day 109 the striatal () and cortical (fʹʹ) tissue are strongly innervated by the VM tissue (representative images; similar results in n = 3 of 3 organoids). Orange and yellow boxes: magnified view in and fʹʹ. g,h, GFP-positive neurites in cortical (g) and striatal (h) tissue were broadly double positive for the dopaminergic marker TH on day 90 (representative images; similar results in n = 3 organoids per region in cryosectioned tissue, 4–5 organoids of an independent batch in 3D tissue-cleared batch). i, Fraction of dopaminergic varicosities: 63% of all GFP-positive axons in the forebrain were of dopaminergic identity (n = 5 organoids; s.d., 4.9%). j, scRNA-seq of day 60 MISCOs showing that all major populations of the dopaminergic circuit (mDA, striatal and cortical neurons) were present, together with clusters of cortical and LGE progenitors, MGE- and CGE-derived cells and VM GABAergic and glutamatergic neurons (n = 3 pooled MISCOs of one batch). k, Correlation of the cortical excitatory neuron and striatal neuron cluster with the BrainSpan dataset of the developing human brain (postconception weeks 20–25). AMY, amygdala; CB, cerebellum; DTH, dorsal thalamus; HIP, hippocampus; NCx, neocortex; STR, striatum. l, VoxHunt spatial similarity mapping of the cortical excitatory neuron, striatal and VM dopaminergic neuronal clusters onto E13.5 Allen Developing Mouse Brain Atlas data with sections colored by scaled expression similarity scores. m, VoxHunt spatial similarity mapping of the VM dopaminergic cluster onto E13.5 Allen Developing Mouse Brain Atlas data (sagital), colored by scaled expression similarity scores. Data given as mean ± s.d. Scale bars: c (right),f, 1 mm; b,c (left, middle), e, 500 µm; eʹʹ, 250 µm; fʹ, 100 µm; eʹ,fʹʹ, 50 µm; g,h, 20 µm. Source data
Fig. 3
Fig. 3. MISCOs form structural features of maturation.
a, 2Eci-cleared 60-day-old MISCOs with CAG-GFP expression in the VM tissue and immunolabeling for TH in gray (representative images; similar results in n = 7 of 7 organoids). b, Striatal tissue (left) had stronger innervation than cortical tissue (right). c, Quantification of peak fluorescence of 2Eci-cleared organoid recordings in striatal and cortical tissue (n = 5 organoids, *P = 0.0125, unpaired two-sided t-test). d, Dopaminergic (TH+) axons form axon bundles that project into the forebrain tissue. e, TH-positive axons generally avoid neurogenic regions (representative images; similar results in n = 17 of 17 rosettes of 8 organoids with ≤1 TH+ axon per neural rosette). V, ventricle; VZ, ventricular zone. fh, TH-positive axons in the striatum (f) and cortex (not shown) structurally mature over time, as indicated by an increase in varicosities of TH-positive axons between day 40 and 120 in the striatum (g) and cortex (h) (n = 5–7 organoids per timepoint). Statistical significance was tested using one-way ANOVA followed by Tukey’s multiple comparison test (****Padj < 0.0001, **Padj = 0.0086, NS (not signficant), Padj = 0.0877 (g), ***Padj = 0.0002, ****Padj < 0.0001, *Padj = 0.0109 (h)). i,j, Organoids transduced with an AAV expressing Syn-Arch1-GFP, a membrane-bound variant of GFP, enable observation of dendrites (yellow arrows, magnified view: Extended Data Fig. 7f–h) and axonal boutons (white arrows, magnified view: Extended Data Fig. 7f–h). Stereotypic morphologies of pyramidal neurons in cortical tissues (j, magnified view of a dendritic tree) and neurons resembling stereotypic multipolar morphology in the striatal tissue as well as heterogeneous morphologies in VM organoids were found (representative images; similar results in n = 12–20 neurons per region of 150-day-old organoids). k, Schematic diagram of monosynaptic rabies virus (RV) tracing for retrograde tracing of VM axons. Region-restricted helper virus (HV) transduction was achieved by injection of small volumes into the forebrain tissue. l, TVA-G helper virus (GFP+) transduction was locally constrained into the forebrain. Rabies virus signal (Crimson+) was predominantly found surrounding the injection site, but also in the periphery of the organoids (representative images; similar results in n = 5 of 5 organoids). Magnified views (yellow boxes) are given in Extended Data Fig. 7i (e7i) and 7j (e7j). m, In the VM, rabies virus broadly labeled neurons, among others dopaminergic (TH+) neurons (yellow arrows) (representative images; similar results in n = 5 of 5 organoids). Data given as mean ± s.d. Scale bars: a, 1 mm; l, 500 µm; d, 100 µm; b,e,i,m, 50 µm; f, 20 µm; j, 10 µm. Source data
Fig. 4
Fig. 4. MISCOs show neuronal activity and functional dopaminergic connectivity.
a,e, Schematic diagram of the optogenetic stimulation of VM with simultaneous extracellular recordings in striatal (a) and cortical (e) tissue. 140–171-day-old MISCOs were transduced with AAV-RG.AAV-CAG-hChR2-H134R-tdTomato and stimulated with 460 nm light focused on VM tissue using an optical fiber. b, Representative active channel raster plots in striatal tissue ±100 s from the initiation of optogenetic stimulation (orange box) with a 20 s recording interval (right). The 460 nm LED light pulses were 500 ms in duration and occurred every 10 s (blue lines). c, Normalized firing rate (Hz) changes in striatal tissue across 10 min baseline and 10 min optogenetic stimulation periods, calculated per MISCO across active channels (n = 7 independent experiments across two organoid batches, a total of 315 active channels, two-sided Wilcoxon signed-rank test, *P = 0.016). d, Percentage of active electrodes from extracellular recordings in striatal tissue responsive to VM optogenetic stimulation (235 of 315 active responding channels from 7 independent experiments across two organoid batches). f, Representative active channel raster plots in cortical tissue ±100 s from the initiation of optogenetic stimulation (orange box). g, Normalized firing rate (Hz) changes in cortical tissue across 10 min baseline and 10 min optogenetic stimulation periods, calculated per organoid from active channels (8 independent experiments across three organoid batches, a total of 391 active channels, two-sided Wilcoxon signed-rank test, *P = 0.039). c,g, Data given as mean ± s.e.m. h, Percentage of active electrodes in cortical tissue responsive to VM optogenetic stimulation (292 of 391 active responding channels from 8 independent experiments across three organoid batches). i, Schematic diagram of optogenetic stimulation of VM tissue and simultaneous fluorescent confocal recording of striatal and cortical tissue. MISCOs were transduced with AAVs containing the optogenetic construct ChrimsonR and the fluorescent genetic encoded dopamine sensor GRAB-DA2m. j,k, Recordings of striatal (j) and cortical (k) tissue in 130-day-old MISCOs show increased fluorescence (F) of GRAB-DA4.4 upon VM stimulation. l,m, Timelapse recording of striatal (l) and cortical (m) regions in MISCOs showing an increase of dopamine release upon stimulation of VM tissue. Bottom: Individual neural GRAB-DA4.4 intensity of both striatal and cortical tissues (mean in blue with s.d. in gray; n = 3 of 3 recordings of one batch). Scale bars: j,k, 50 µm. Source data
Fig. 5
Fig. 5. Injection of high purity ventral midbrain progenitors for Parkinson’s disease cell therapy enables study of graft innervation.
a, Schematic diagram of injection of dopaminergic progenitors into MISCOs. A total of 40,000 cells in a 200 nl volume were injected into the VM part of MISCOs. b, One month after injection, GFP-positive cells were readily visible at the injection site (representative image; similar results in n = 5 of 5 organoids). Left: brightfield of the VM side of a MISCO. Right: same position with GFP fluorescence to visualize injected GFP+ cells. c, Surface recordings 20 days after injection demonstrate graft innervation from VM (cʹ) into striatal and cortical tissues (cʹʹ) (representative images; similar results in n = 3 of 3 organoids). d, 2Eci recording of a graft in VM immunolabeled for GFP, FOXA2 and TH. e, Striatal tissue (top) had denser innervation of grafted cells than cortical tissue (bottom) in 155-day-old organoids. f, Live imaging of MISCOs with VM graft with axon outgrowth into the forebrain tissue. Growth cone (red arrow) and axon–axon interactions (green arrows) were readily observable. Scale bars: b,c, 500 µm; cʹ, 250 µm; cʹʹ, 100 µm; e, 50 µm; d,f, 20 µm.
Fig. 6
Fig. 6. Cocaine treatment of MISCOs enables the study of perturbations of the dopaminergic system in vitro.
a, Schematic diagram of the treatment of MISCOs with cocaine. Organoids were treated with 0.7 µM cocaine hydrochloride for 1 h every 3 days from day 40 until day 130 (chronic condition) and until day 105 (withdrawal condition). Functional, morphological and transcriptional analysis was performed on day 130. b, TH- immunolabeled dopaminergic axons in striatal (left) and cortical tissue (right) in control, chronic and withdrawal MISCOs (representative images; similar results in n = 6–8 organoids per condition, 39–49 axons). c, Schematic diagram of the varicosity density and varicosity diameter parameters in dopaminergic axons. d, Quantification of TH-positive varicosity density in striatal (left) and cortical (right) tissue (n = 6–8 organoids per condition, 39–49 axons). ****Padj  < 0.0001, *Padj = 0.0323 (Str), NS, Padj = 0.5420 (Ctx). e, Measurement of varicosity diameter (as mean of all boutons per axon) in striatal (left) and cortical (right) tissue (n = 6–8 organoids, 36–47 axons per condition and 1,055, 1,552, 1,347 (striatal) and 923, 1,063, 1,340 (cortical) boutons measured). ****Padj < 0.0001, ***Padj = 0.0002, NS, Padj= 0.2078 (Str) and Padj = 0.7079 (Ctx). f, Schematic diagram of the parameters frequency and duration from GCAMP traces after extraction with CaImAn. g,h, MISCOs with GCAMP6S expression in either VM, striatal or cortical tissue were recorded on day 130 in control, chronic and withdrawal conditions (10–21 organoids per condition). g, Analysis of calcium event duration showed a significant decrease in striatal (left) and an increase in cortical (right) neuron calcium event duration (striatal: 1,776, 2,144, 4,254 individual calcium events; cortical: 1,437, 6,931, 8,000 individual calcium events). ****Padj < 0.0001. NS, Padj = 0.7303 (Str) and Padj = 0.9653 (Ctx). h, Analysis of calcium event frequency for striatal neurons (left) (n = 248, 245, 680 events) and cortical neurons (right) (n = 175, 936, 885 events) in control, chronic and withdrawal conditions. ***Padj = 0.0009, ***Padj = 0.0002, NS, Padj = 0.9434 (Str). ****Padj < 0.0001 *Padj = 0.0300 (Ctx). Data given as mean ± s.d. Samples were analyzed with one-way ANOVA followed by Tukey’s multiple comparison test. i,j, Volcano plot comparing bulk RNA-seq data of day 130 forebrain organoids for chronic versus control (i) and withdrawal versus control (j) (n = 6–9 organoids of 2–3 batches). FC, fold change. k, GO term overrepresentation analysis of genes downregulated in forebrain (fb) chronic and withdrawal conditions versus forebrain control. Data given as mean ± s.d. Scale bar: b, 10 µm. Source data
Extended Data Fig. 1
Extended Data Fig. 1. VM patterning robustly induces dopaminergic neurogenesis in multiple cell lines.
a, qPCR analysis of organoids treated with a dose curve of the small molecule SAG as a replacement for SHH indicates appropriate floor plate induction at 300 nM on day 20 of organoid differentiation. 5 independent batches with 8-10 organoids per batch. Gray area indicates ±SEM. b, Representative images of 10 day-old VM, striatal and cortical patterned organoids. c, Representative images of VM, striatal and cortical organoids of > 120 days. d, Quantification of VM, striatal, cortical and MISCO organoid length. n = 17|22|21 organoids of 2 batches per condition of >120 days (individual organoids) and 39 organoids of 6 batches (MISCOs). Statistical analysis was performed with a one-way ANOVA followed by Tukey’s multiple comparisons test. Padj = <0.0001|0.0003|< 0.0001. Data show mean ± SD. e, Quantification of the fraction of FOXA2/LMX1a/EN1 positive cells expressing TH. n = 8|8|5 positions of individual organoids at day 80. Data shown as mean ± SD. f, Day 20 cortical and striatal organoids express the forebrain marker FOXG1, which is absent in VM patterned organoids (representative images, similar results in n = 3-4 organoids). g, VM patterned organoids from 6 different cell lines (3 embryonic and 3 iPSCs) on day 10 and day 23. h, Co-expression of the mDA neuronal markers FOXA2 and TH indicate VM dopaminergic neurogenesis in all 6 cell lines on day 80 of differentiation. i, Quantification of TH+ tissue as percentage of DAPI positive area of 6 different cell lines on day 80. n = 7|5|6|4|4|5 organoids of one batch per cell line. Data show mean ± SD. j, Magnified regions of TH and FOXA2-positive regions from 6 cell lines (n = 6 cell lines of one batch). Source data
Extended Data Fig. 2
Extended Data Fig. 2. Low levels of SHH activation and Wnt inhibition are sufficient to induce LGE neuroepithelium and striatal neurogenesis.
a, Dose–response curve of SAG (0-100 nM) to enrich for GSX2+ LGE neuroepithelium in day 27 old organoids (representative batch, similar results in n = 10-15 organoids per condition of 3 independent batches). b-d, Quantification of GSX2+ (b) and PAX6+ (c), as well as GSX2+ & PAX6 neural rosettes after SAG dose curve in 27-day-old organoids. n = 10-15 organoids per condition of 3 independent batches. Gray areas visualize ±SEM. e, IWP-2SAG10nM treated organoids display ASCL1 positive neural progenitors (SOX2+) (representative image, similar results in n = 4/4 organoids). f, IWP-2-SAG10nM treated organoids produce ISLET1 positive neurons (representative image, similar results in n = 4/4 organoids). g,h, DARPP32+ clusters express the subpallial marker DLX5 in a DLXi5/6-GFP reporter line, but at lower levels than interneurons (DLXi5/6-GFP+, DARPP32) on day 80 (representative image, similar results in n = 6/6 organoids). Statistical analysis was done with a one-way ANOVA followed by Tukey’s multiple comparisons test. Padj = <0.0001|0.0017|< 0.0001. Data show mean ± SD. i, Striatal patterned organoids on day 60 display NKX2-1+ interneurons scattered through the organoid (representative image, similar results in n = 5/5 organoids). j, Striatal organoids are positive for FOXG1 and CTIP2 (representative image, similar results in n = 5/5 organoids). k, Striatal organoids do not have PAX6+ regions and are negative for the cortical neuron marker TBR1, unlike cortical organoids (representative image, similar results in 39 of 41 organoids of 6 different cell lines). Source data
Extended Data Fig. 3
Extended Data Fig. 3. Striatal patterning robustly induces striatal neurogenesis in multiple cell lines.
a, Organoids from 6 different cell lines (3 embryonic and 3 induced PSCs) treated with striatal patterning on day 10 and day 23 (one batch per cell line). b, Immunohistochemistry of day 33 striatal organoids for the LGE marker GSX2. c, Quantification of GSX2+ rosettes as percentage of all neural rosettes of individual organoids of 6 different cell lines on day 33. n = 4|4|5|5|5|5 organoids of one batch per cell line. d, 5 out of 6 cell lines robustly produce DARPP32+ neurons which co-localize with immunolabeling of GABA in day 80 organoids (cell line 178-5 being broadly negative). e, Quantification of DARPP32+ tissue as percentage of DAPI positive area of 6 different cell lines on day 80. n = 5|4|6|6|6|6 organoids of one batch per cell line. f, Clusters of DARPP32-positive neurons co-express the marker FOXP1 in all cell lines in day 80 organoids (n = 6 cell lines of one batch). Data shown as mean ± SD. Source data
Extended Data Fig. 4
Extended Data Fig. 4. VM, striatal and cortical patterned organoids are enriched in corresponding brain region markers.
a-h, Volcano plots and corresponding relative gene expression heatmaps showing VM, striatal and cortical marker genes in differential expression analysis of cortical versus striatal and cortical versus VM organoids. Cortical organoids were enriched for cortical markers in comparison with striatal (a, e) and VM (d,h) tissues. b, f, Striatal organoids were enriched for striatal markers. c, g, VM organoids were enriched for mDA markers. p value was calculated using a Benjamin-Hochberg corrected Wald test using DESeq2. Source data
Extended Data Fig. 5
Extended Data Fig. 5. PDMS molds allow fusion of organoids and the observation of dopaminergic innervation.
a, Schematic for the generation of MISCOs. b-c, Tilted side view and top view of PDMS embedding molds for linear fusions. d-e, size considerations for the fusion of three organoids. f-g, Side view of the PDMS embedding mold for MISCO generation. h, Cortical (TBR1+) and striatal (DARPP32+) tissue were innervated by dopaminergic axons (representative images, similar results in n = 8 MISCOs of 2 batches). i, Dopaminergic (TH+) neurons in the VM (white arrow) as well as their axons in striatum and cortex (yellow arrows) of day 90 MISCOs express the mature mDA marker Dopamine Transporter (DAT) on day 90 (representative images, similar results in n = 9/9 MISCOs). j, DARPP32+ neurons in 120-day-old MISCOs in the striatum expressed the striatal subtype markers DRD1 (yellow arrows) and DRD2 (white arrows) (representative images, similar results in n = 6-8 MISCOs of 2-3 batches). k-l, Dopaminergic neurons in MISCOs expressed the dopaminergic subtype markers GIRK2, CALB1, ALDH1A1, OTX2, GABA and SOX6 (n = 6|7|5|5|6|8 MISCOs of 3-4 batches). Yellow arrows: representative double-positive neurons. Data shown as mean ± SD. Source data
Extended Data Fig. 6
Extended Data Fig. 6. scRNA-seq confirms neuronal populations associated with the dopaminergic system in MISCOs.
a, Schematic for barcoding of VM, striatum and cortex tissue for droplet based scRNA-seq using MULTI-seq. b, Plotting of UMAP with indication of tissue origin. c, Stacked bar plot showing barcode origin of clusters in percent. d, Density plots of floor plate (FOXA2, SHH) and dopaminergic neuron (EN1, TH, DAT, PITX3) as well as a TH, EN1 and FOXA2 joint density plot indicate mDA neuronal cluster identity. e, The striatal neuron cluster is GABAergic (VGAT, GAD1) and is positive for the striatal markers CTIP2, FOXP1, MEIS2 and ZFHX3. The joint density plot of ZFHX3, GAD1 and FOX1 indicates striatal neuron cluster identity. e’-e”, The striatal cluster expresses markers of DRD1 medium spiny neurons (e’, TAC1, ISL1, EBF1) as well as DRD2 medium spiny neurons (e”, SIX3, SP9, GRIK3). f, Density plots for cortical progenitor markers (PAX6, EMX2), the intermediate progenitor marker EOMES and the cortical neuronal markers NEUROD6, VGLUT1 and TBR1. g, Forebrain (cortical and GE patterned) clusters express the forebrain marker FOXG1. Clusters for LGE progenitors (GSX2) as well as MGE (LHX6) and CGE-derived (NR2F2) cells were observable. Additionally, clusters with the identities of oligodendrocyte (-progenitors) (OLIG1), dividing progenitors (mKI67) and glial cells (S100B) clusters were present. h, Dot plot of top marker genes expressed in at least 20% of cells in individual clusters ranked by p value, calculated by presto implementation of the Wilcoxon rank sum test and auROC analysis. Source data
Extended Data Fig. 7
Extended Data Fig. 7. MISCOs allow the study of reciprocal connections from cortical and striatal tissue.
a, Day 60 VMWT-StrCAG-GFP-CtxWT MISCOs allow to study striatal innervation and show reciprocal GABA+ innervation from striatal into VM (a) and cortical (a’) tissue (white arrows), indicating reciprocal connectivity between VM and striatal tissue. Additionally, migrated interneurons into cortical tissues could be observed (yellow arrows). (representative images, similar results in n = 8/8 60-day-old MISCOs). b, Day 60 VMWT-StrWT-CtxCAG-GFP MISCOs display innervation from cortical tissue into both VM (b) as well as striatal tissue (b’), displaying cortical projection axon bundles (white arrows in b’) in the striatum as well as axonal innervation of mDA clusters in VM tissues (representative images, similar results in n = 6/6 60-day-old MISCOs). c, Striatal DARPP32+ clusters were readily innervated from cortical and VM tissues in day 40 VMCAG-tdTomato-StrWT-CtxCAG-GFP MISCOs (representative image, similar results in 6/6 organoids). d, Dopaminergic (TH+) neurons often cluster together and display heterogeneous morphologies (representative images, similar results in n = 13/13 organoids of 3 batches). e, Co-labeling of TH and GFP in VMWT -StrDLXi5/6-GFP-CtxWT MISCOs in striatal and cortical tissues allowed the observation of TH expressing interneurons (representative neurons of 2 recordings of 2 organoids). f–h, Putative dendritic spines (yellow arrows) and axonal boutons (white arrows) in Arch1-GFP transduced organoids in VM, striatal and cortical tissue. i, The injection site displayed HV (GFP+) and RV (Crimson+) double-transduced starter cells as well as monosynaptic, retrogradely transduced Crimson+ GFP cells (representative image, similar results in n = 3/3 organoids of one batch). j, In the VM, neurons were RV positive, but helper virus negative, indicating retrograde spreading (representative image, similar results in n = 3/3 organoids of one batch). k, Number of starter cells of 500µm2 of whole organoid z projections of both injection site vs. VM. n = 3 MISCOs. Paired t-test, P = 0.0399. Data shown as mean ± SD. Source data
Extended Data Fig. 8
Extended Data Fig. 8. MISCOs display functional dopaminergic innervation.
a-c, Representative GCAMP recordings of 130-day-old MISCOs with Syn-GCAMP expression either in the VM, or striatal, or cortical tissue as well as selected traces of individual neurons (bottom) (similar results in n = 7/7 organoids per region) d, Ctx-Str-VMSyn-GCAMP MISCOs displayed calcium network events in VM derived projections in forebrain (Fb) tissue (d’: no synchronous event, d”: calcium network event) (similar results in n = 4/4 organoids of 2 batches). e, Cumulative fluorescence intensity over time of the recording from (d) displaying VM derived network events. Inserts indicate selected time points for panel d’ and d”. f, Photography of a silicon neural probe set-up with optogenetic stimulation with mounted fused organoid. Organoids in this experiment were transduced with the optogenetic vector AAV-RG.AAV-CAG-hChR2-H134R-tdTomato. g, Widefield images before (left) and during stimulation (right) of the VM tissue while recording from striatal tissue. SiPro…Silicon Probe. h, Stimulation set-up. After baseline recording, the VM side of a MISCO was stimulated for 500 ms every 10 sec. i, Representative active channel raster plots in forebrain tissue with baseline (left), VM stimulation (middle) and VM stimulation after application of synaptic blockers (right). 460-nm LED light pulses set at an interval of 10 seconds with a 500-millisecond duration (blue). After a 5 min incubation with a cocktail of synaptic blockers (D-AP5, CNQX, Gabazine, SCH-23390, Sulpiride−/−), population responses in forebrain were absent during stimulation of VM. j, Normalized mean firing rate in MISCOs before and after light application, and repeated with synaptic blocker application (n = 127 active channels from 2 organoids). Padj = <0.0001|< 0.0001. Samples were analyzed with one-way ANOVA followed by Tukey’s multiple comparisons test. k-l, AAV2pAAVss-hSyn-GRAB-DA2m transduces striatal (DARPP32+ in striatal tissue, yellow arrows) as well as cortical (TBR1+ in cortical tissue) neurons (yellow arrows: double-positive cells). m-n, Heatmap of activity regulated response genes and dopamine signaling response genes. The majority of activity-regulated genes were upregulated in RNA-seq of striatal and cortical tissues of separated MISCOs on day 60 in comparison to day 60 individual organoids. PRGs… primary response genes. SRGs… secondary response genes. Source data
Extended Data Fig. 9
Extended Data Fig. 9. Quality control for VM progenitors for grafting.
a-e, Quality control for mDA neuronal differentiation as for dopaminergic cell therapy. mDA differentiation expressed the mDA progenitor markers SHH, EN1, FOXA2, CORIN and NURR1. mDA differentiation in brown, dorsal forebrain (DF) comparison in blue. f-i, the mDA markers OTX2, LMX1A, LMX1B and TH were highly expressed in VM in comparison to DF. j-l, The dorsal forebrain markers TBR1, PAX6 and FOXG1 were absent in the mDA differentiation. a-l, Significance was calculated using a two-sided Mann–Whitney test (n = 4-9 individual wells of one differentiation). Data shown as mean ± SEM. p values: a, 0.0095|0.0028|0.0286, b, 0.0095|0.0028, c, 0.0095|0.0028|0.0286, d, 0.0095|0.002|0.0286, e, 0.0028|0.0286, f, 0.0028|0.0286, g, 0.0095|0.0028|0.286, h, 0.0095|0.0028|0.0286, i, 0.0028|0.286, j, 0.0095|0.0028, k, 0.0095|0.0028|0.0286, l, 0.0095|0.0028|0.0286. m-p, Immunofluorescent staining of mDA differentiation on day 16 with mDA markers (LMX1A, FOXA2, OTX2), forebrain markers (PAX6, FOXG1 and TBR2) and the neuronal marker TUJ1. q-t, Immunofluorescent labeling of mDA differentiation on day 30 with mDA neuronal markers (LMX1A, FOXA2, OTX2, TH), forebrain markers (PAX6 and TBR2) and the neuronal marker TUJ1 and TAU. u, Image of day 120 MISCOs in 6 well plates. Stereotypic morphologies in WT MISCOs (left) allow the identification of the VM tissue (black arrows), which was additionally tested by MISCO fusions containing CAG-tdTomato expression in the VM organoid derived tissue (black arrows). v, Quantification of GFP fluorescence in striatal and cortical tissue 95 days after injection. Statistical significance was calculated using an unpaired two-sided t-test. P < 0.0001. n = 8|9 regions of one differentiation/injection batch. Data shown as mean ± SD. w, Between day 3 and day 95 after injection in 60-day-old MISCOs, mDA grafts mature and innervation increases (representative images of 3D IHC and 2Eci tissue-cleared MISCOs, similar results in n = 4-5 organoids per timepoint). Source data
Extended Data Fig. 10
Extended Data Fig. 10. Cocaine treatment of MISCOs.
a, Representative GCAMP recordings of 130-day-old MISCOs with Syn-GCAMP expression either in the cortical or striatal tissue in control (left), chronic (middle) and withdrawal (right) condition. b, Representative GCAMP-recording of a MISCO with Syn-GCAMP in striatal tissue before (control) and after TTX application (0.5 µM), visualized as cumulative neuronal activity in a 6.5 min recording and displayed as ΔF/F. c, Calcium event duration of VM neurons in control, chronic and withdrawal conditions. 876|2058|1068 individual calcium events of 7-17 organoids. All Padj < 0.0001. d, Analysis of calcium event frequency of VM (n = 100|278|115) neurons in control, chronic and withdrawal conditions. Padj = 0.0341|0.002|< 0.0001. Data shown as mean ± SD. Samples were analyzed by one-way ANOVA followed by Tukey’s multiple comparisons test (c,d). e-f, Volcano plots of differentially expressed genes in VM tissue in chronic versus control (e) and withdrawal versus control (f). P-value was calculated using a Benjamin-Hochberg corrected Wald test using DESeq2. g-i, GSEA analysis of three GO terms associated with neural circuit formation (dendrite development, axon development and synapse organization) in forebrain chronic vs control (top) and forebrain withdrawal versus control (bottom). Source data

References

    1. Bissonette GB, Roesch MR. Development and function of the midbrain dopamine system: what we know and what we need to. Genes Brain Behav. 2016;15:62–73. - PMC - PubMed
    1. Tritsch NX, Sabatini BL. Dopaminergic modulation of synaptic transmission in cortex and striatum. Neuron. 2012;76:33–50. - PMC - PubMed
    1. Volman SF, et al. New insights into the specificity and plasticity of reward and aversion encoding in the mesolimbic system. J. Neurosci. 2013;33:17569–17576. - PMC - PubMed
    1. German DC, Schlusselberg DS, Woodward DJ. Three-dimensional computer reconstruction of midbrain dopaminergic neuronal populations: from mouse to man. J. Neural Transm. 1983;57:243–254. - PubMed
    1. Pakkenberg B, Moller A, Gundersen HJG, Dam AM, Pakkenberg H. The absolute number of nerve cells in substantia nigra in normal subjects and in patients with Parkinson’s disease estimated with an unbiased stereological method. J. Neurol. Neurosurg. Psychiatry. 1991;54:30–33. - PMC - PubMed