. 2024 Jan;31(1):125-140.
doi: 10.1038/s41594-023-01130-4. Epub 2023 Dec 5.

3D Enhancer-promoter networks provide predictive features for gene expression and coregulation in early embryonic lineages

Affiliations

3D Enhancer-promoter networks provide predictive features for gene expression and coregulation in early embryonic lineages

Dylan Murphy et al. Nat Struct Mol Biol. 2024 Jan.

Abstract

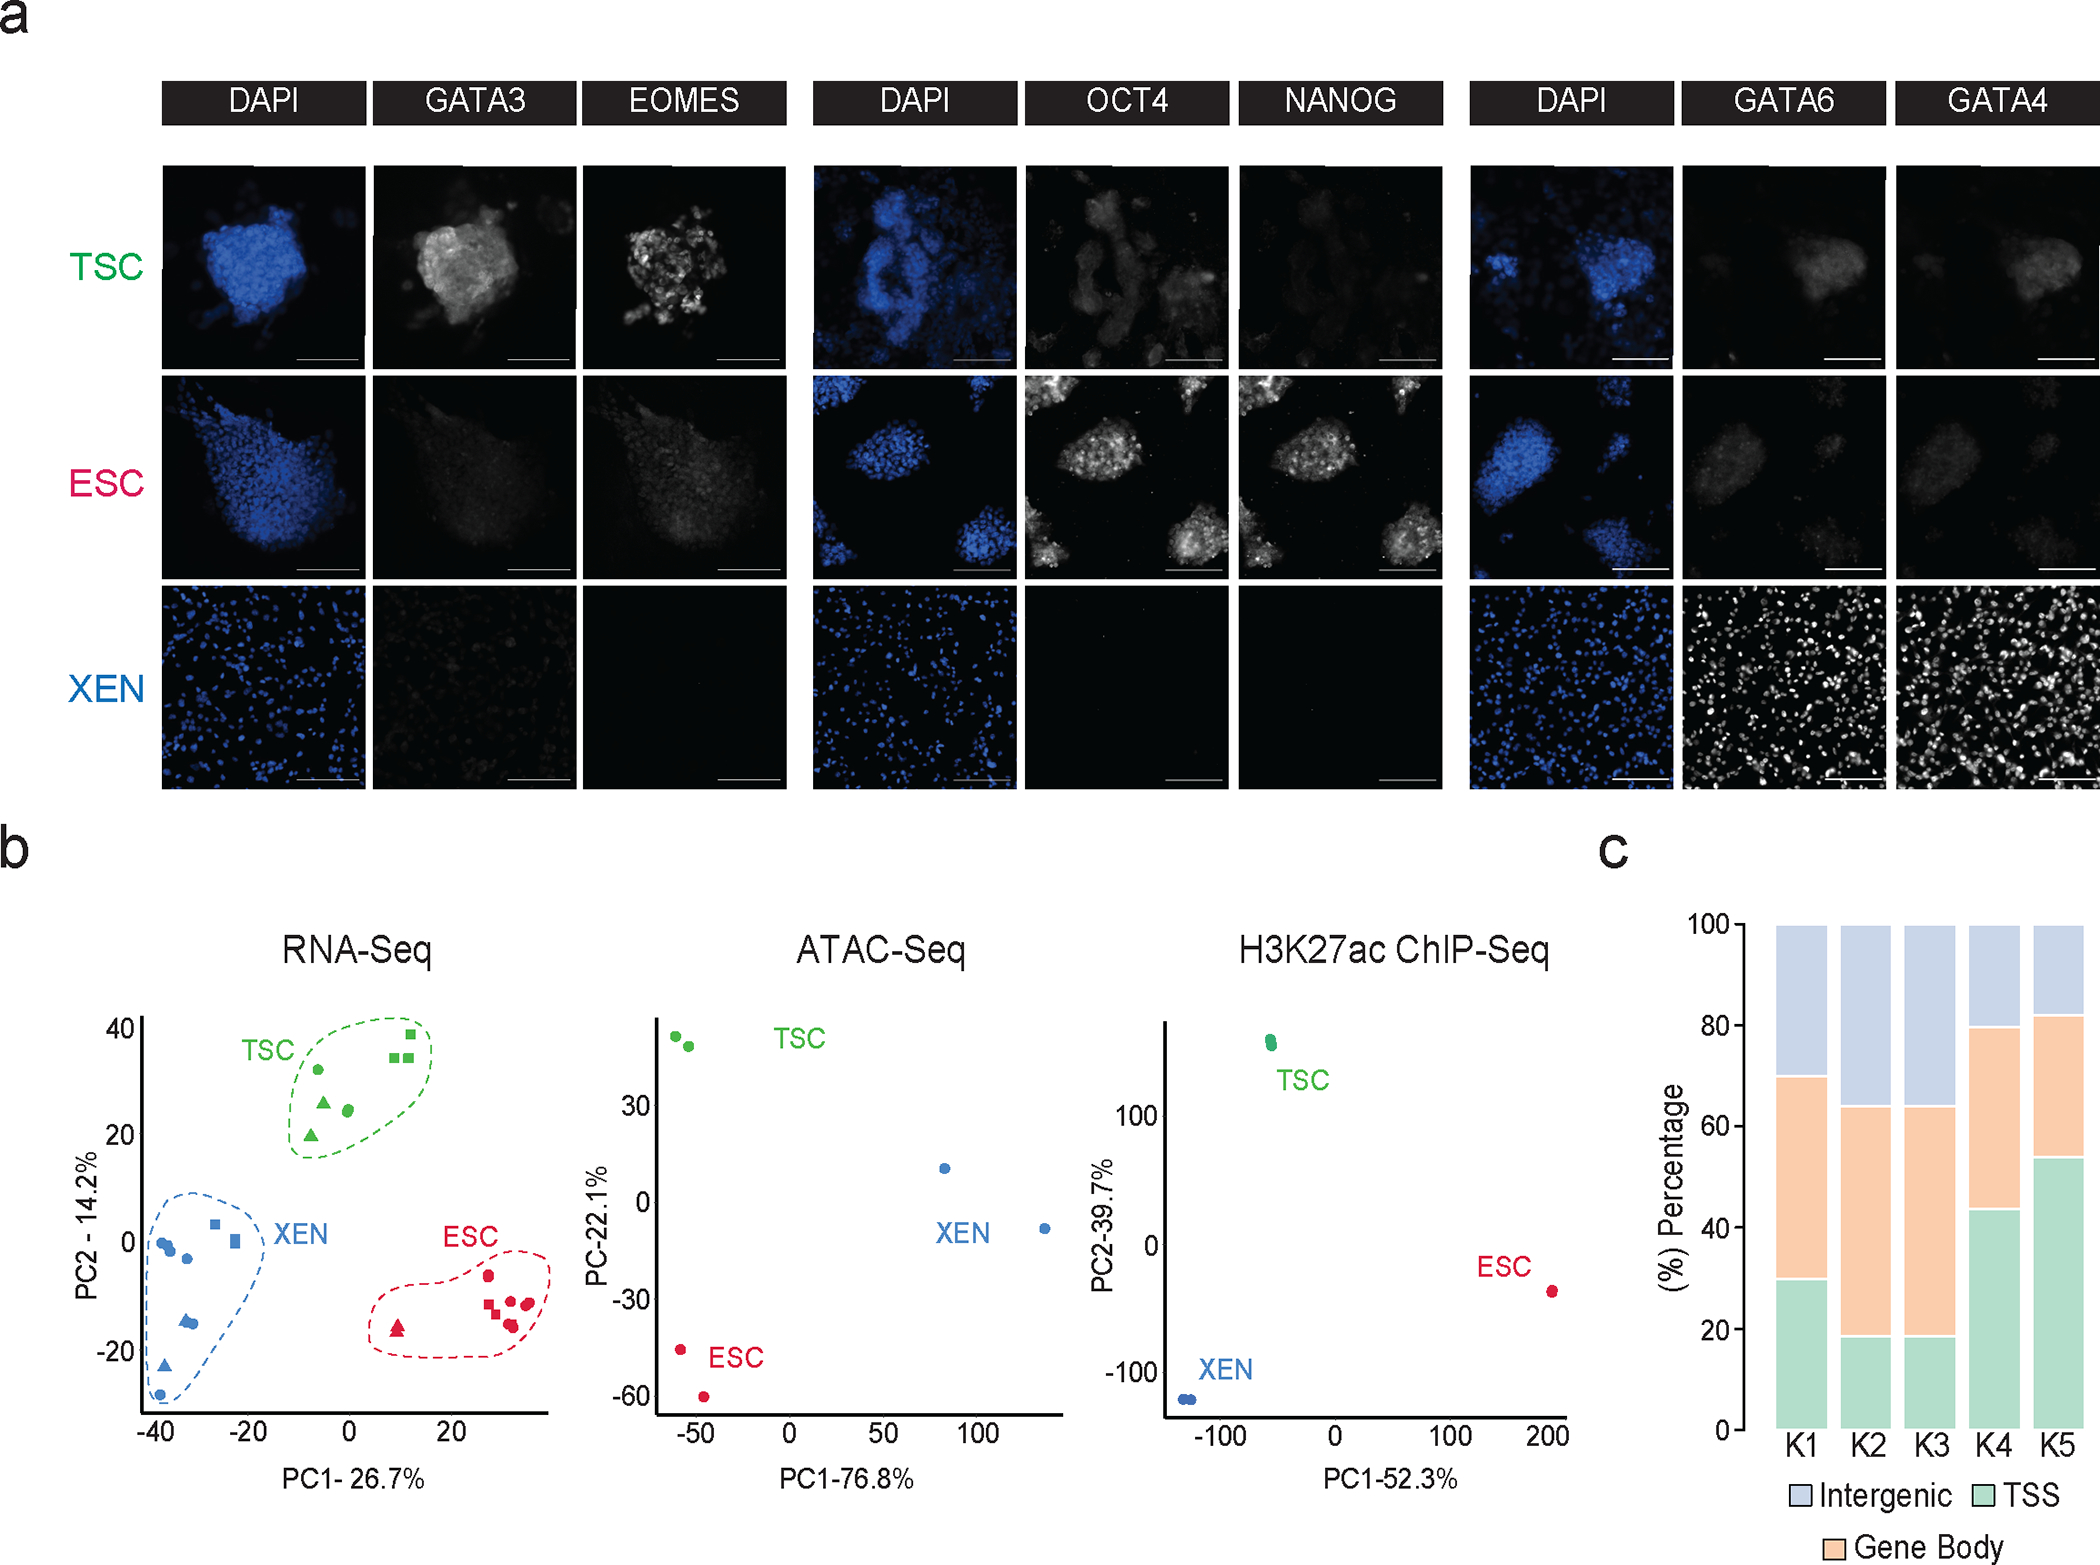
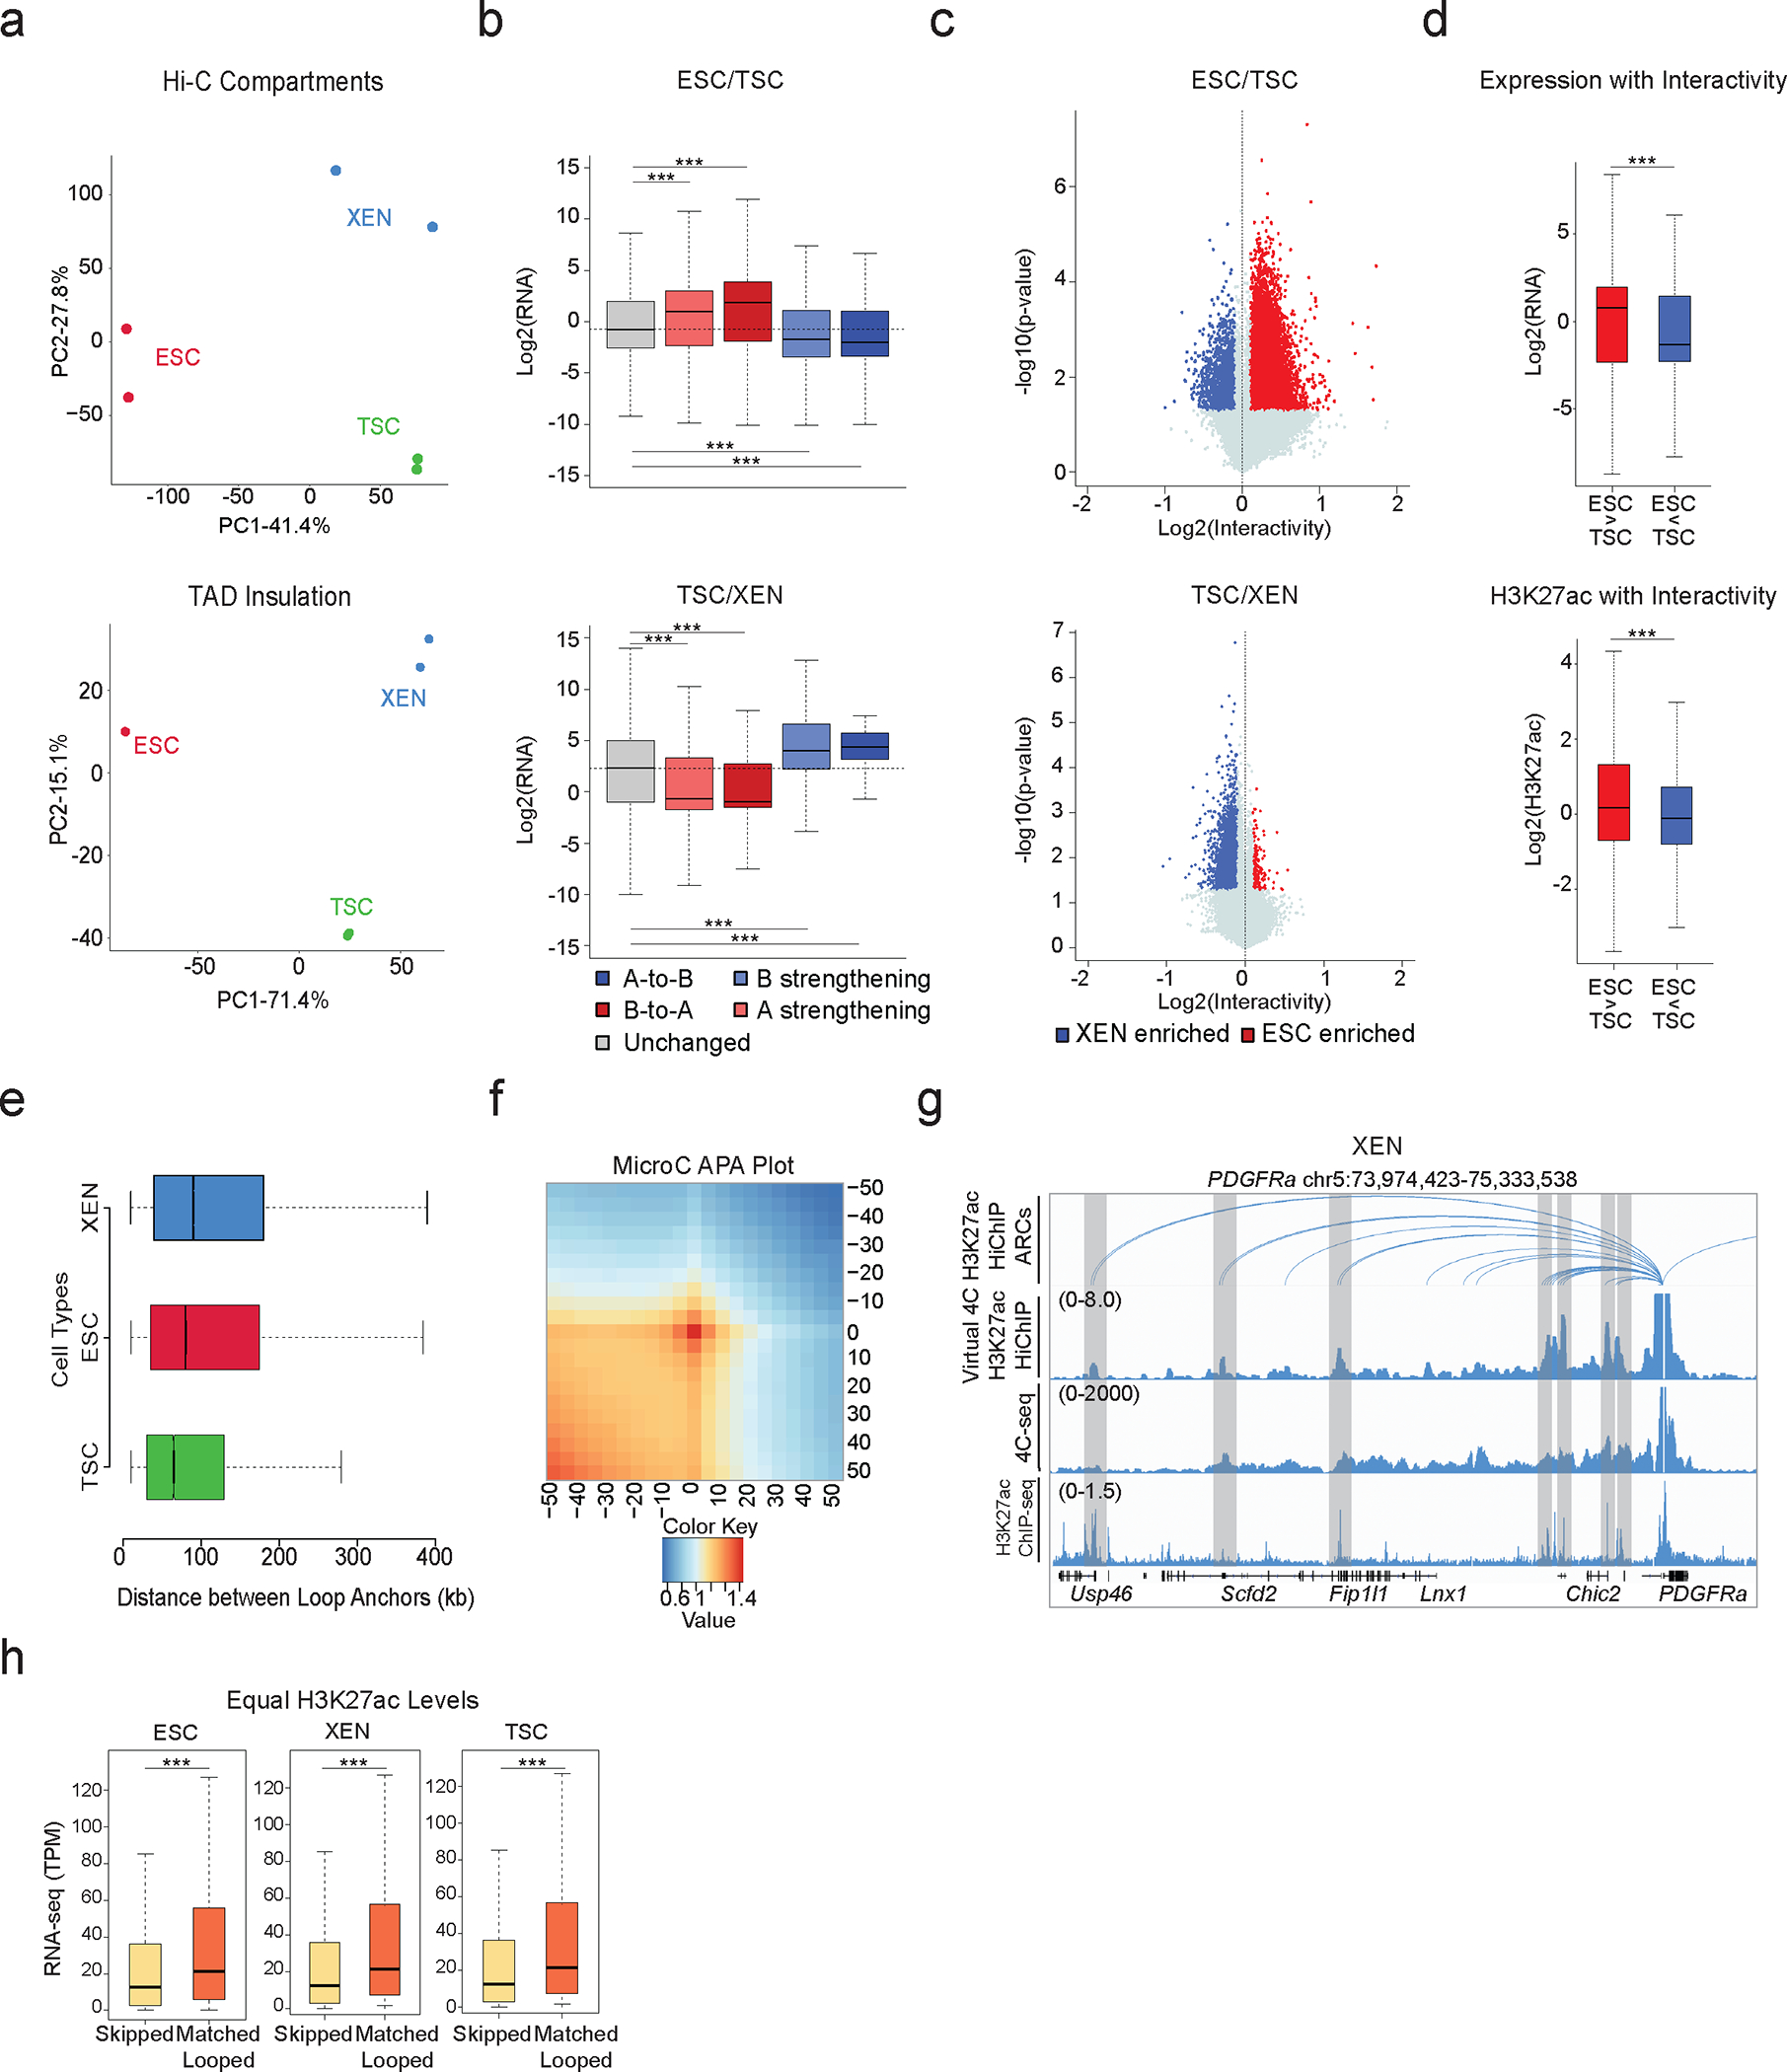
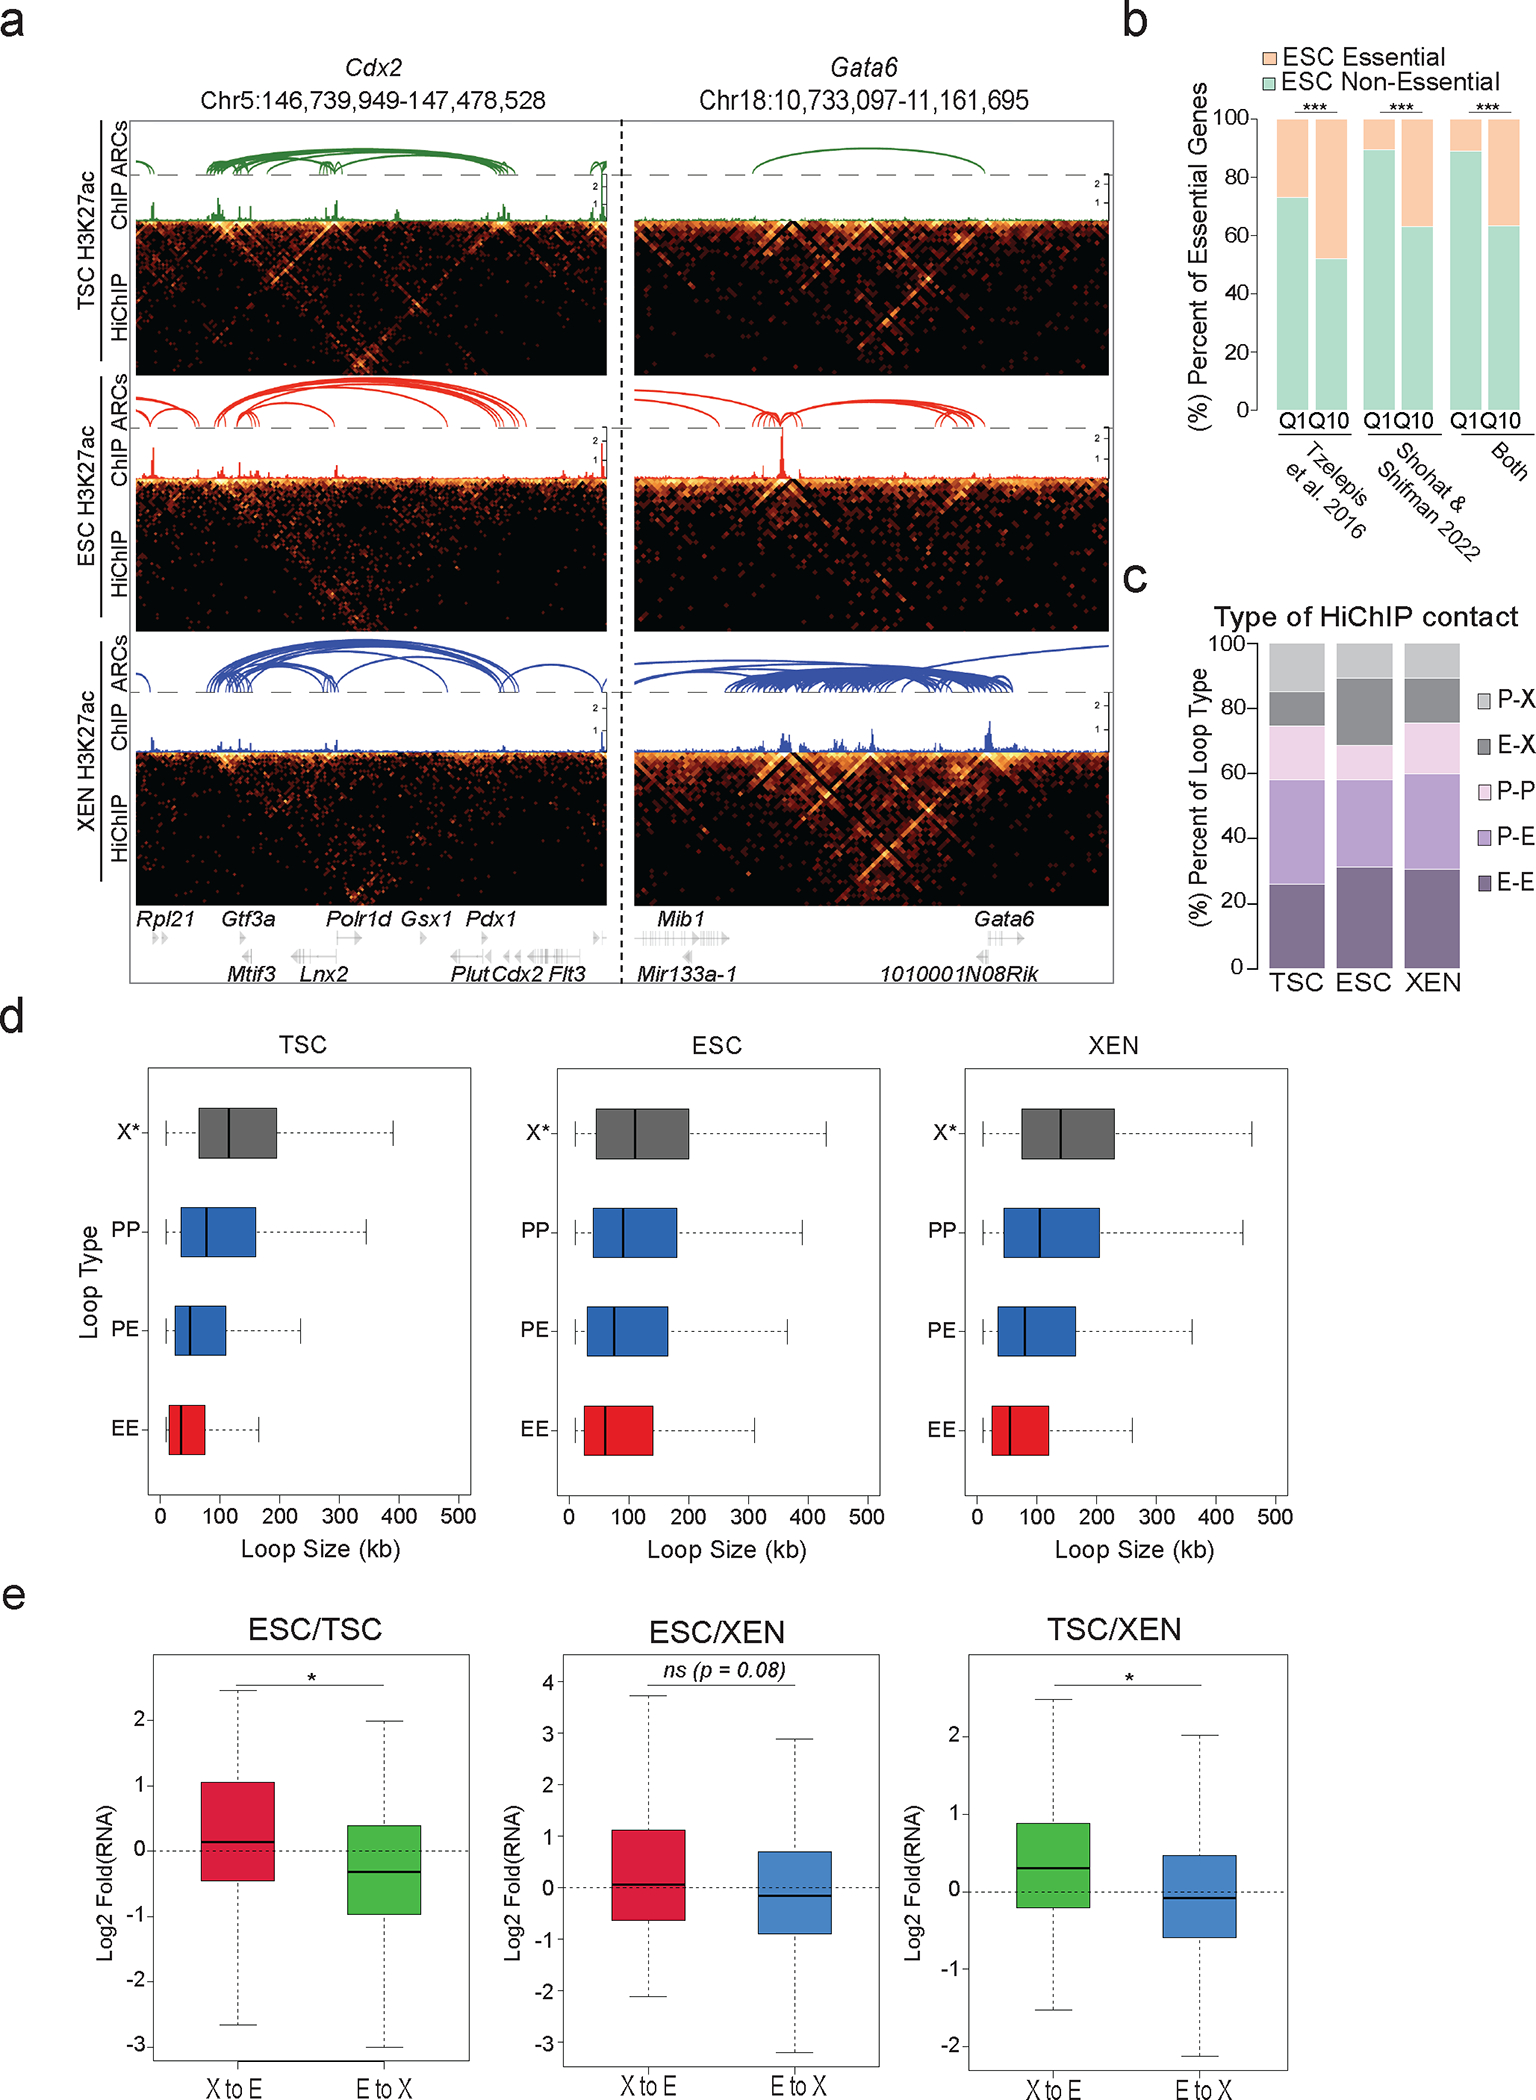
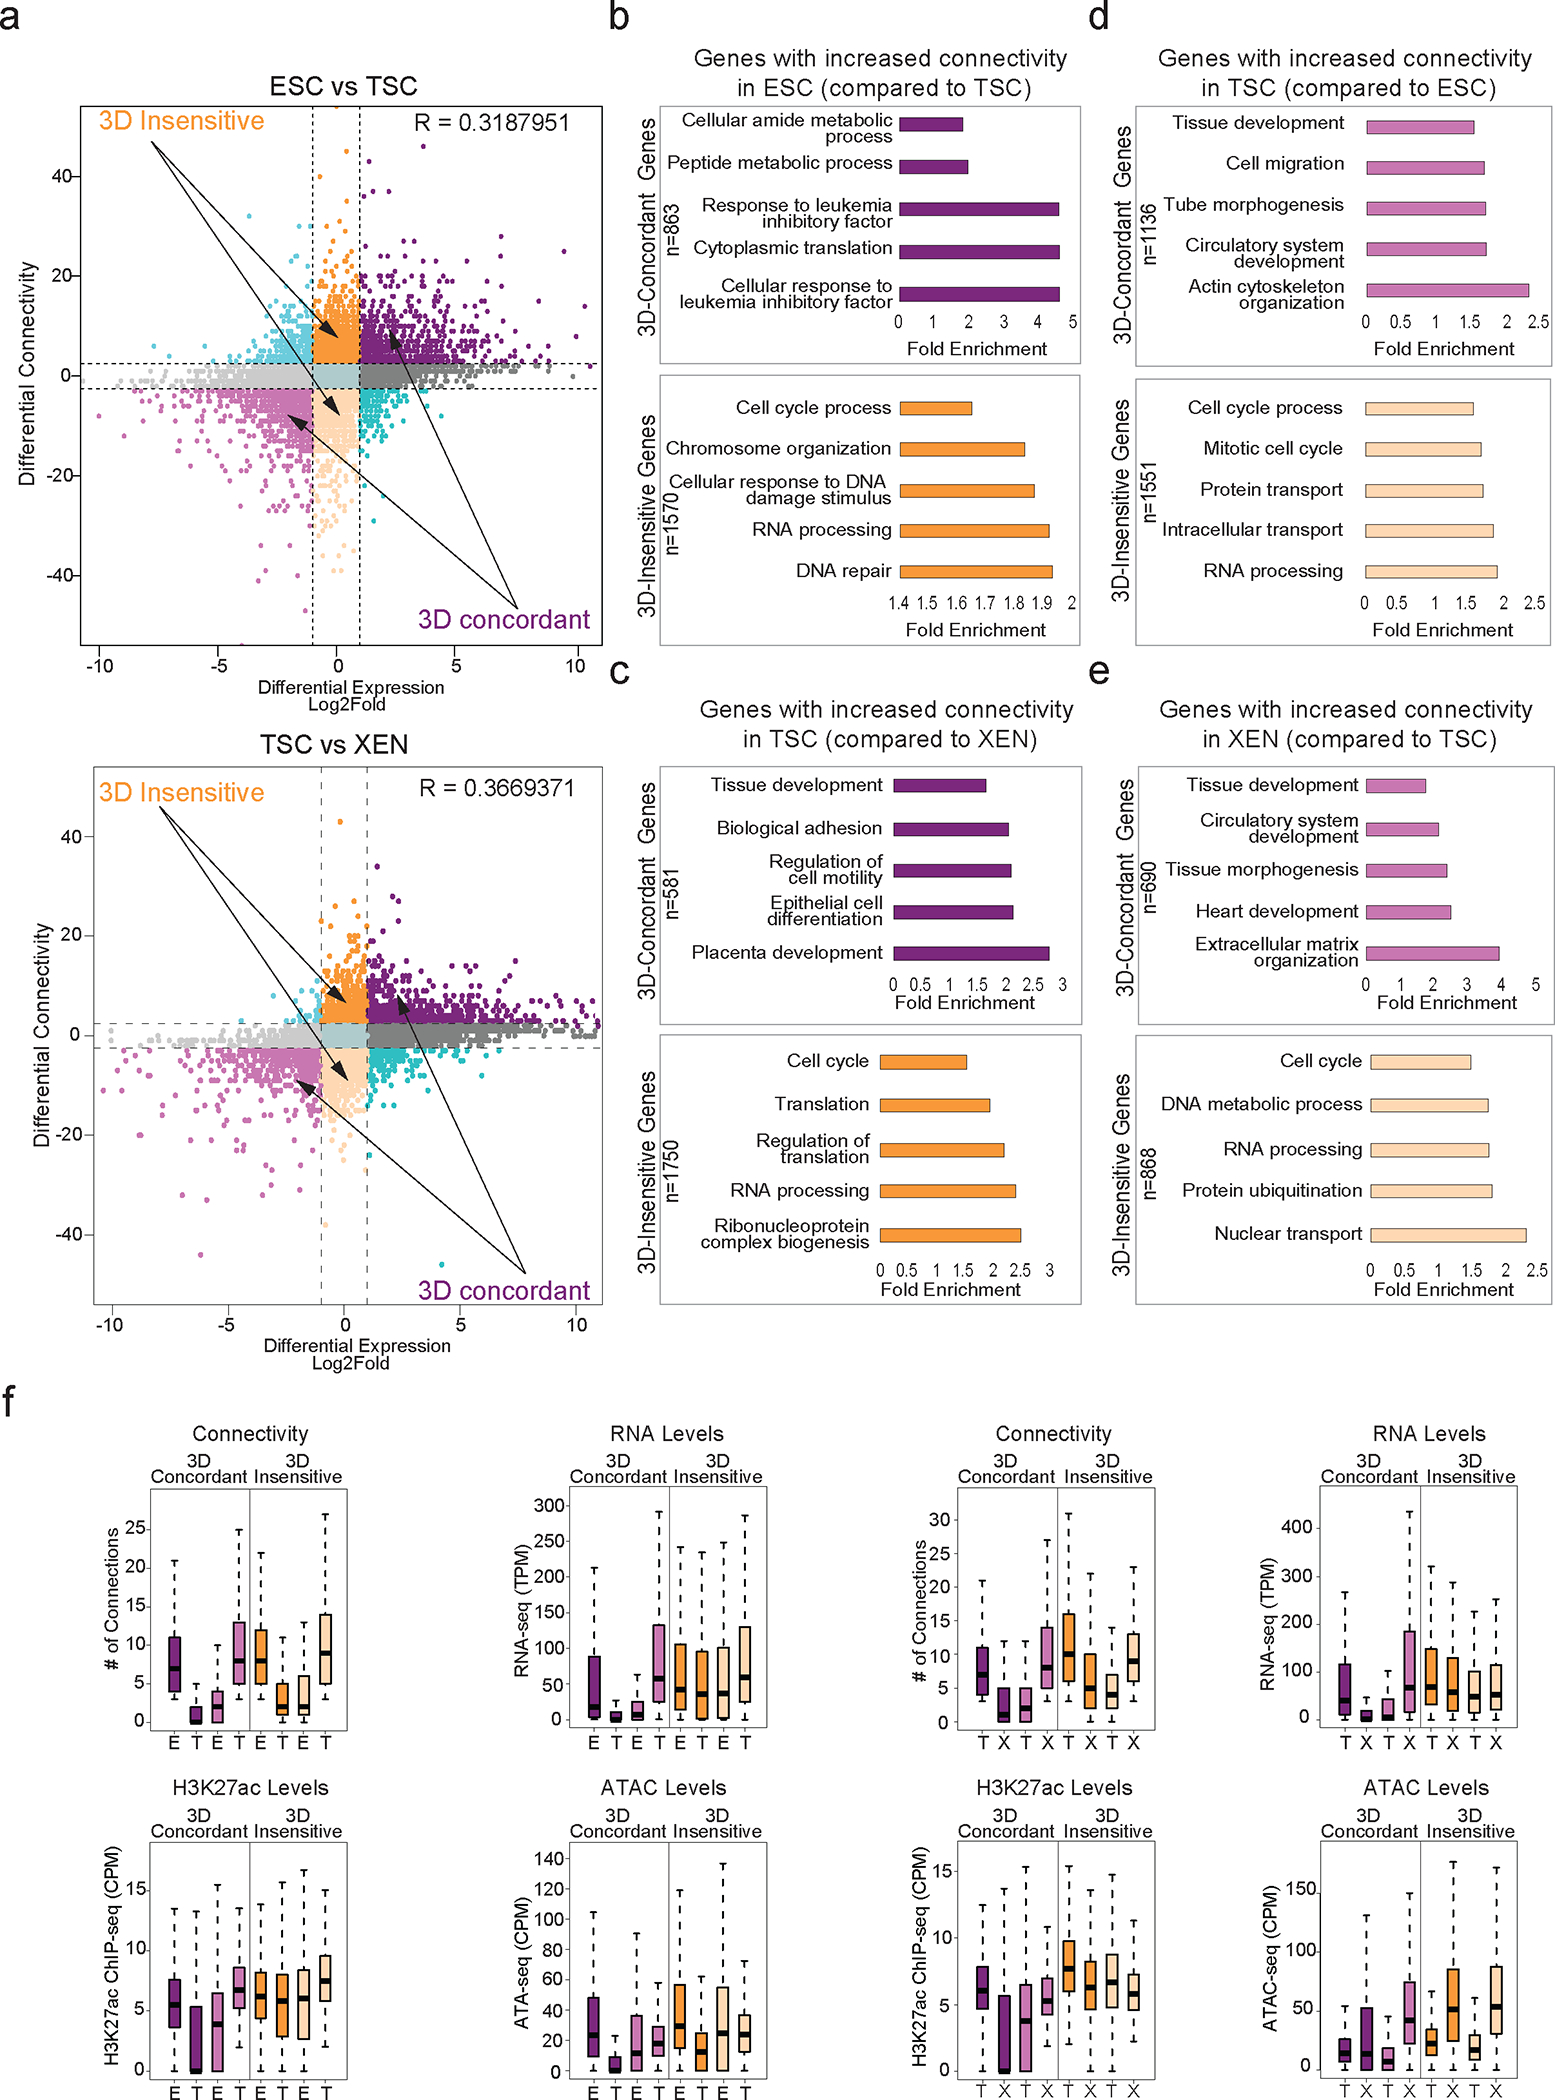
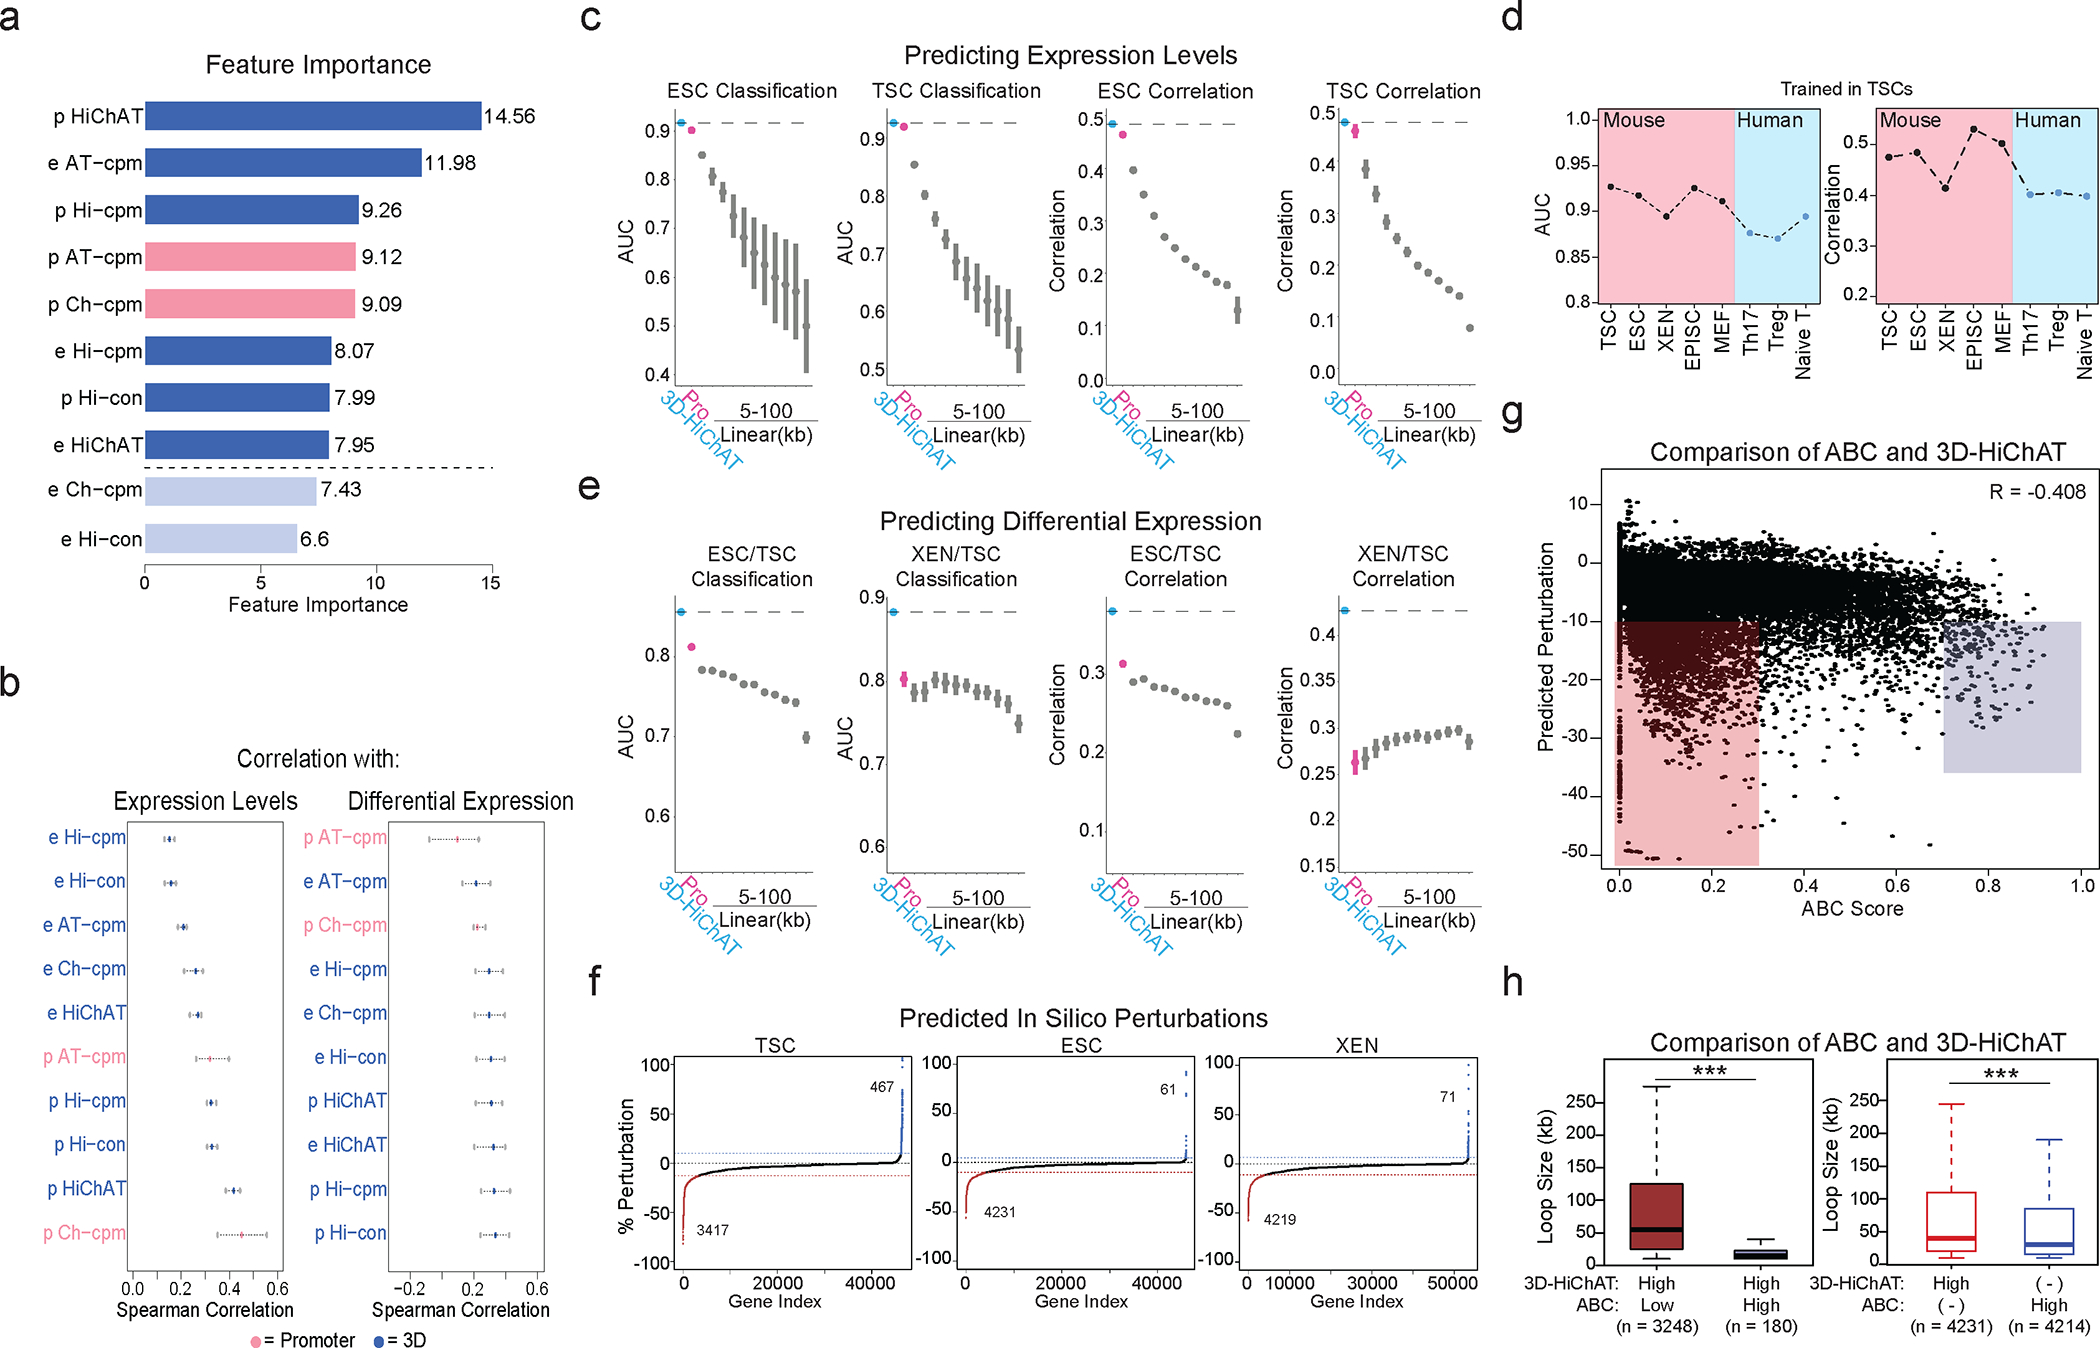
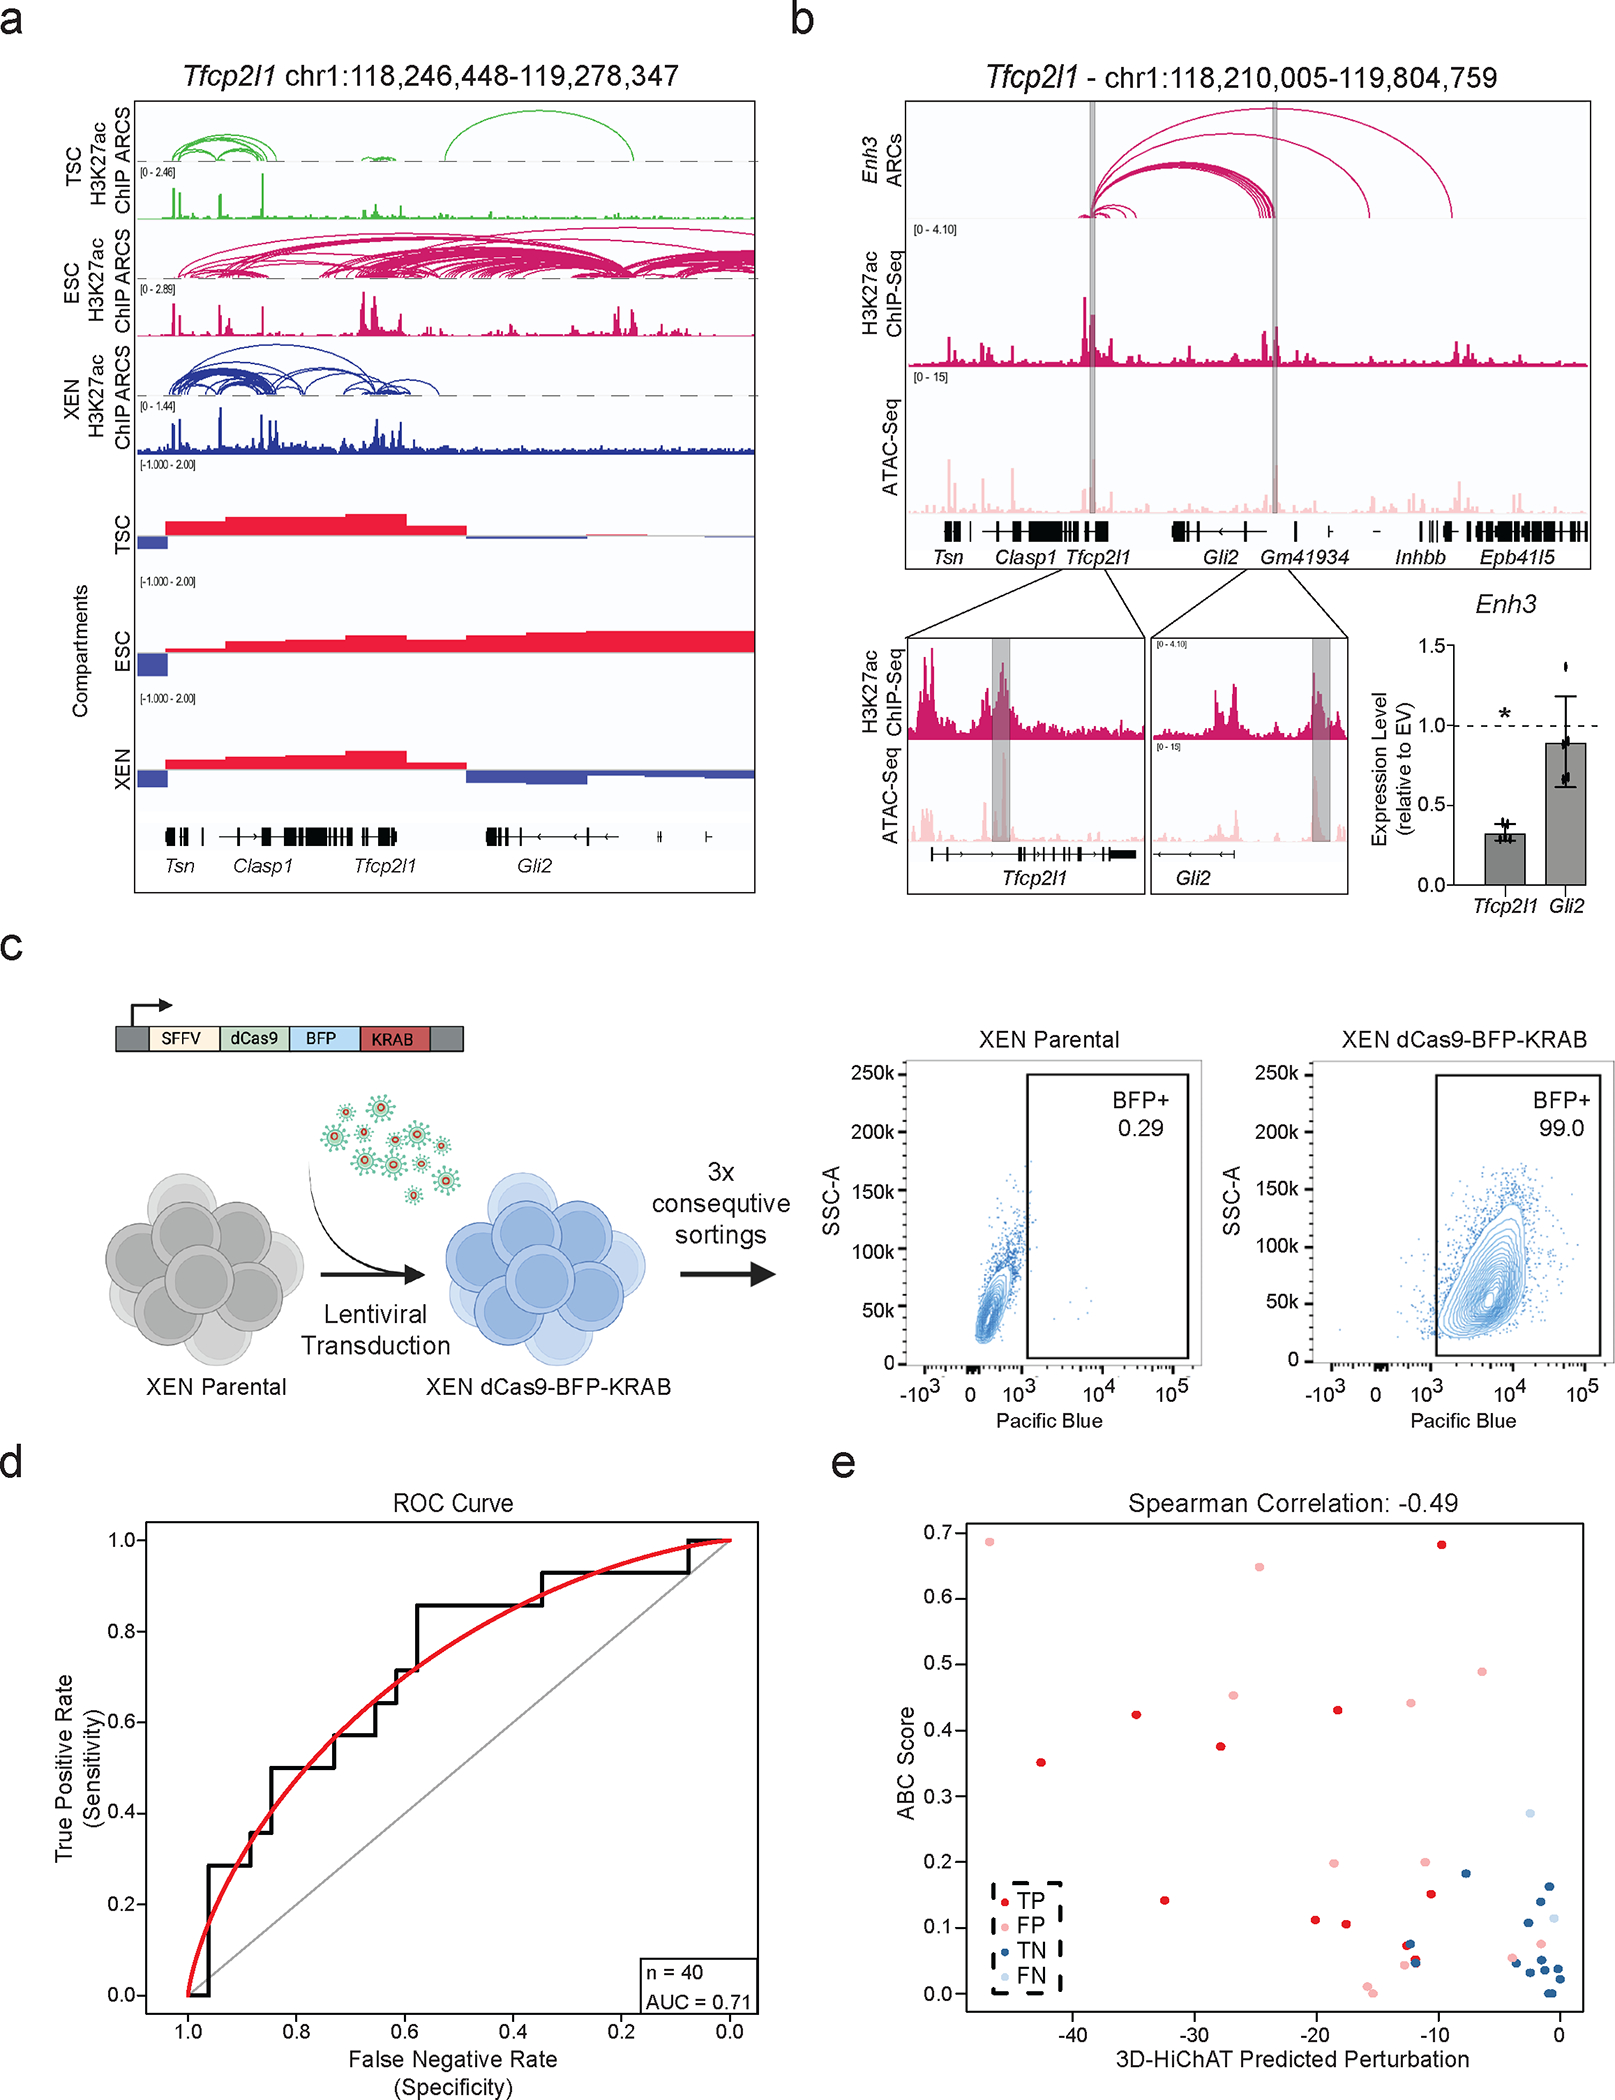
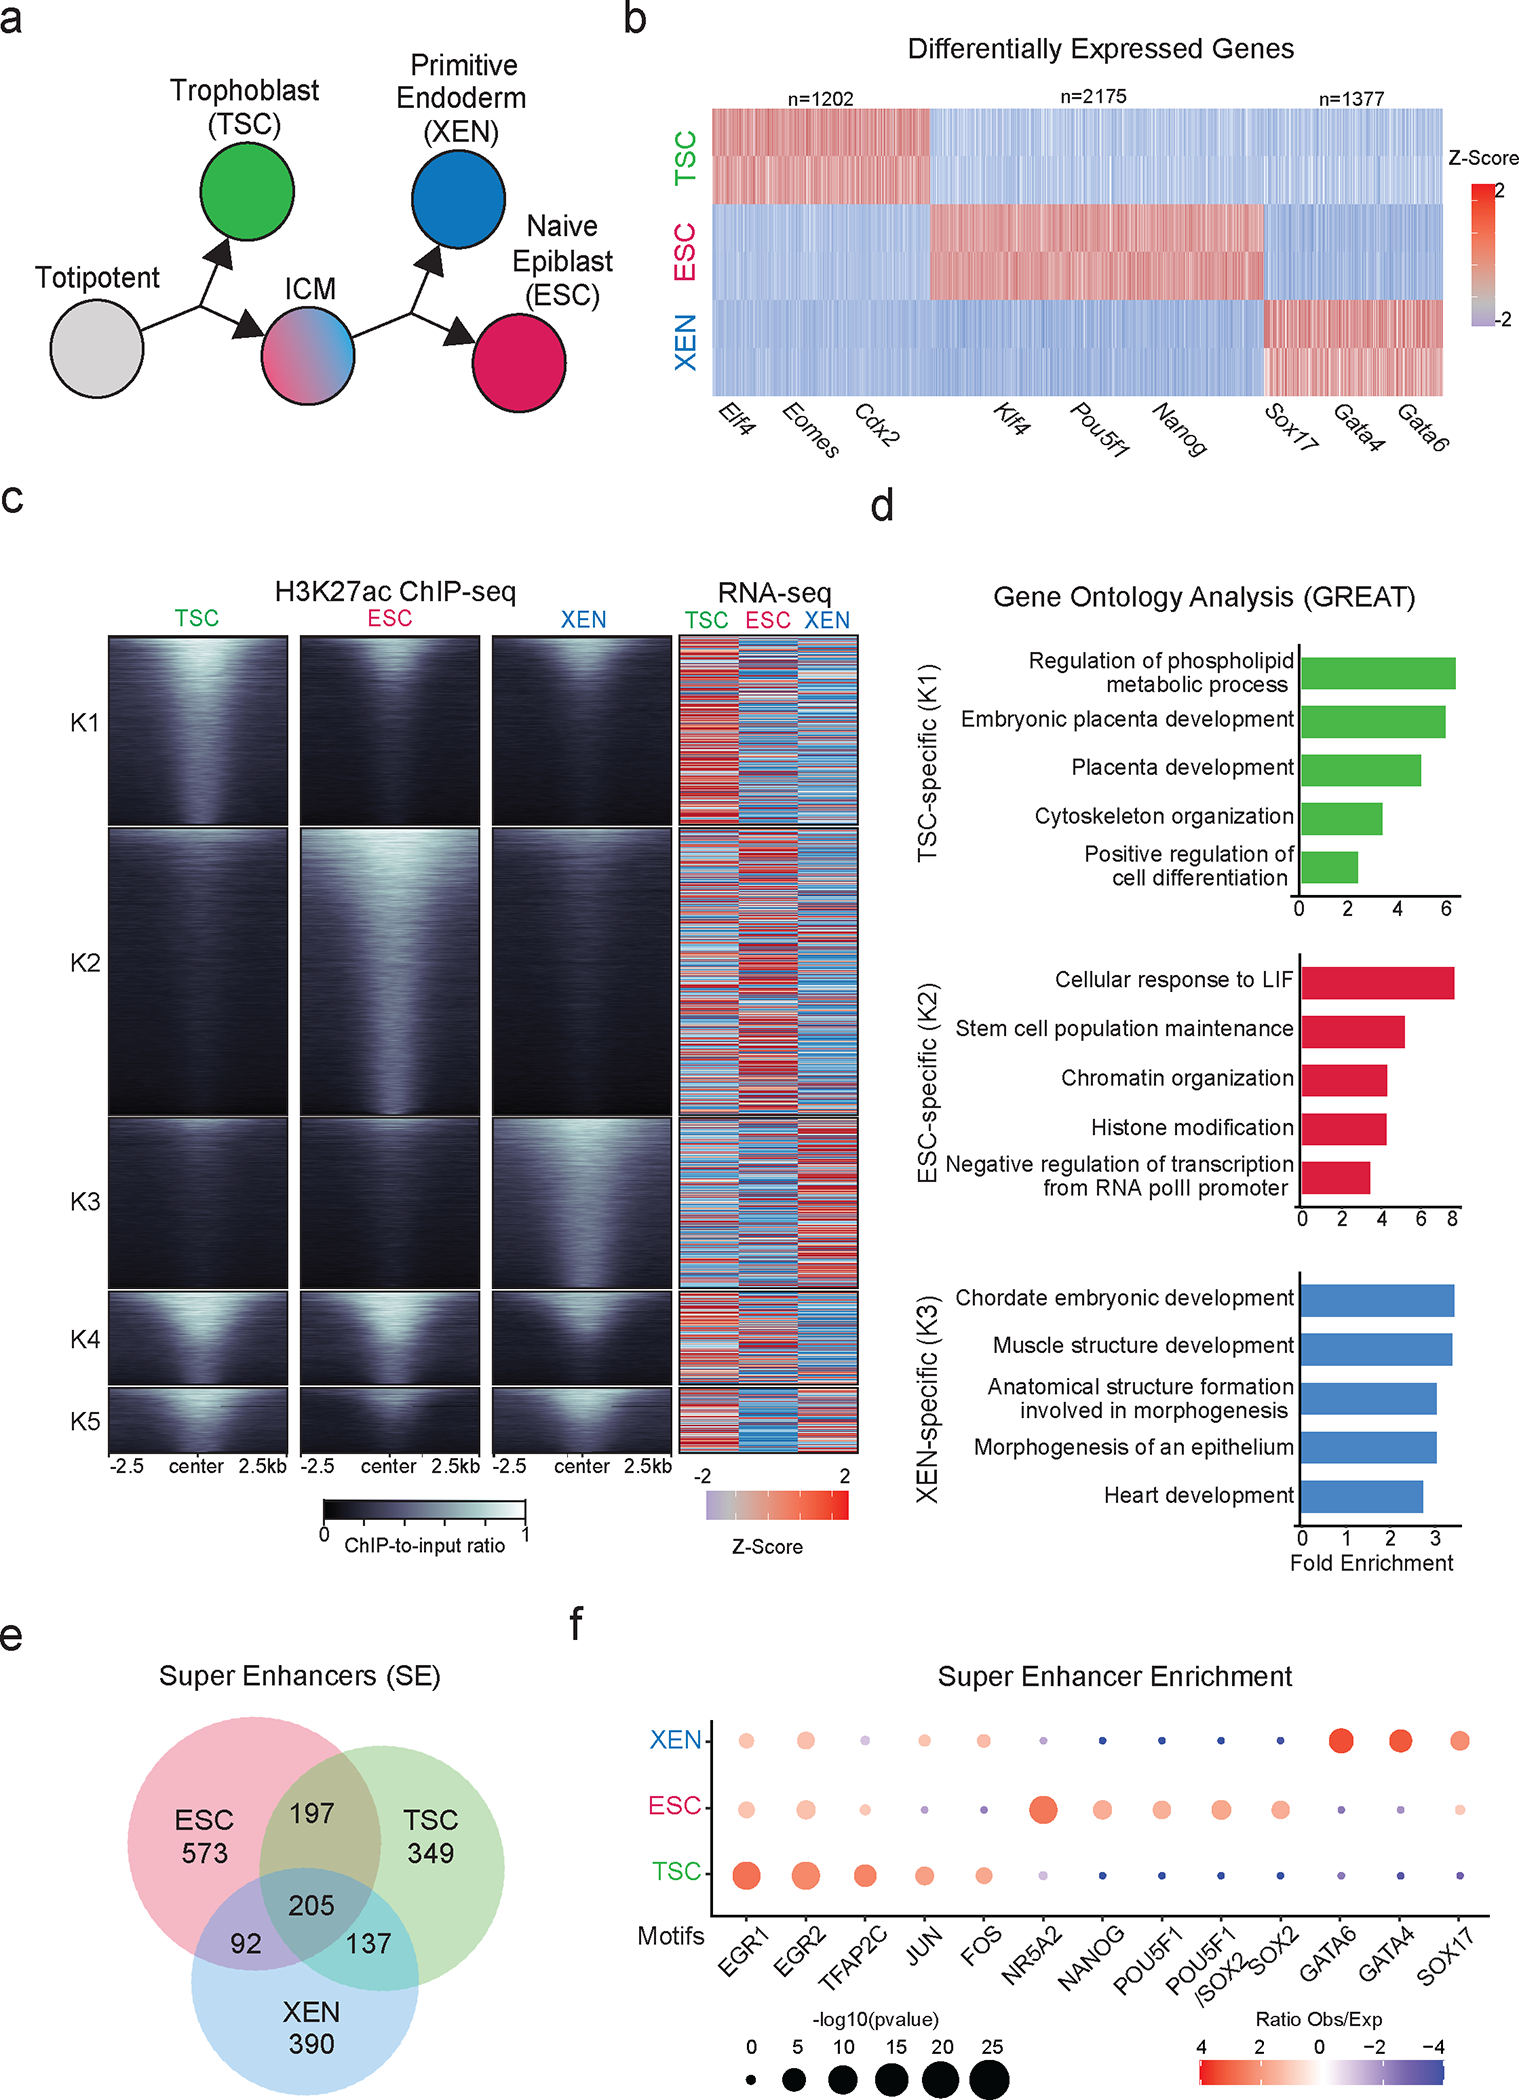
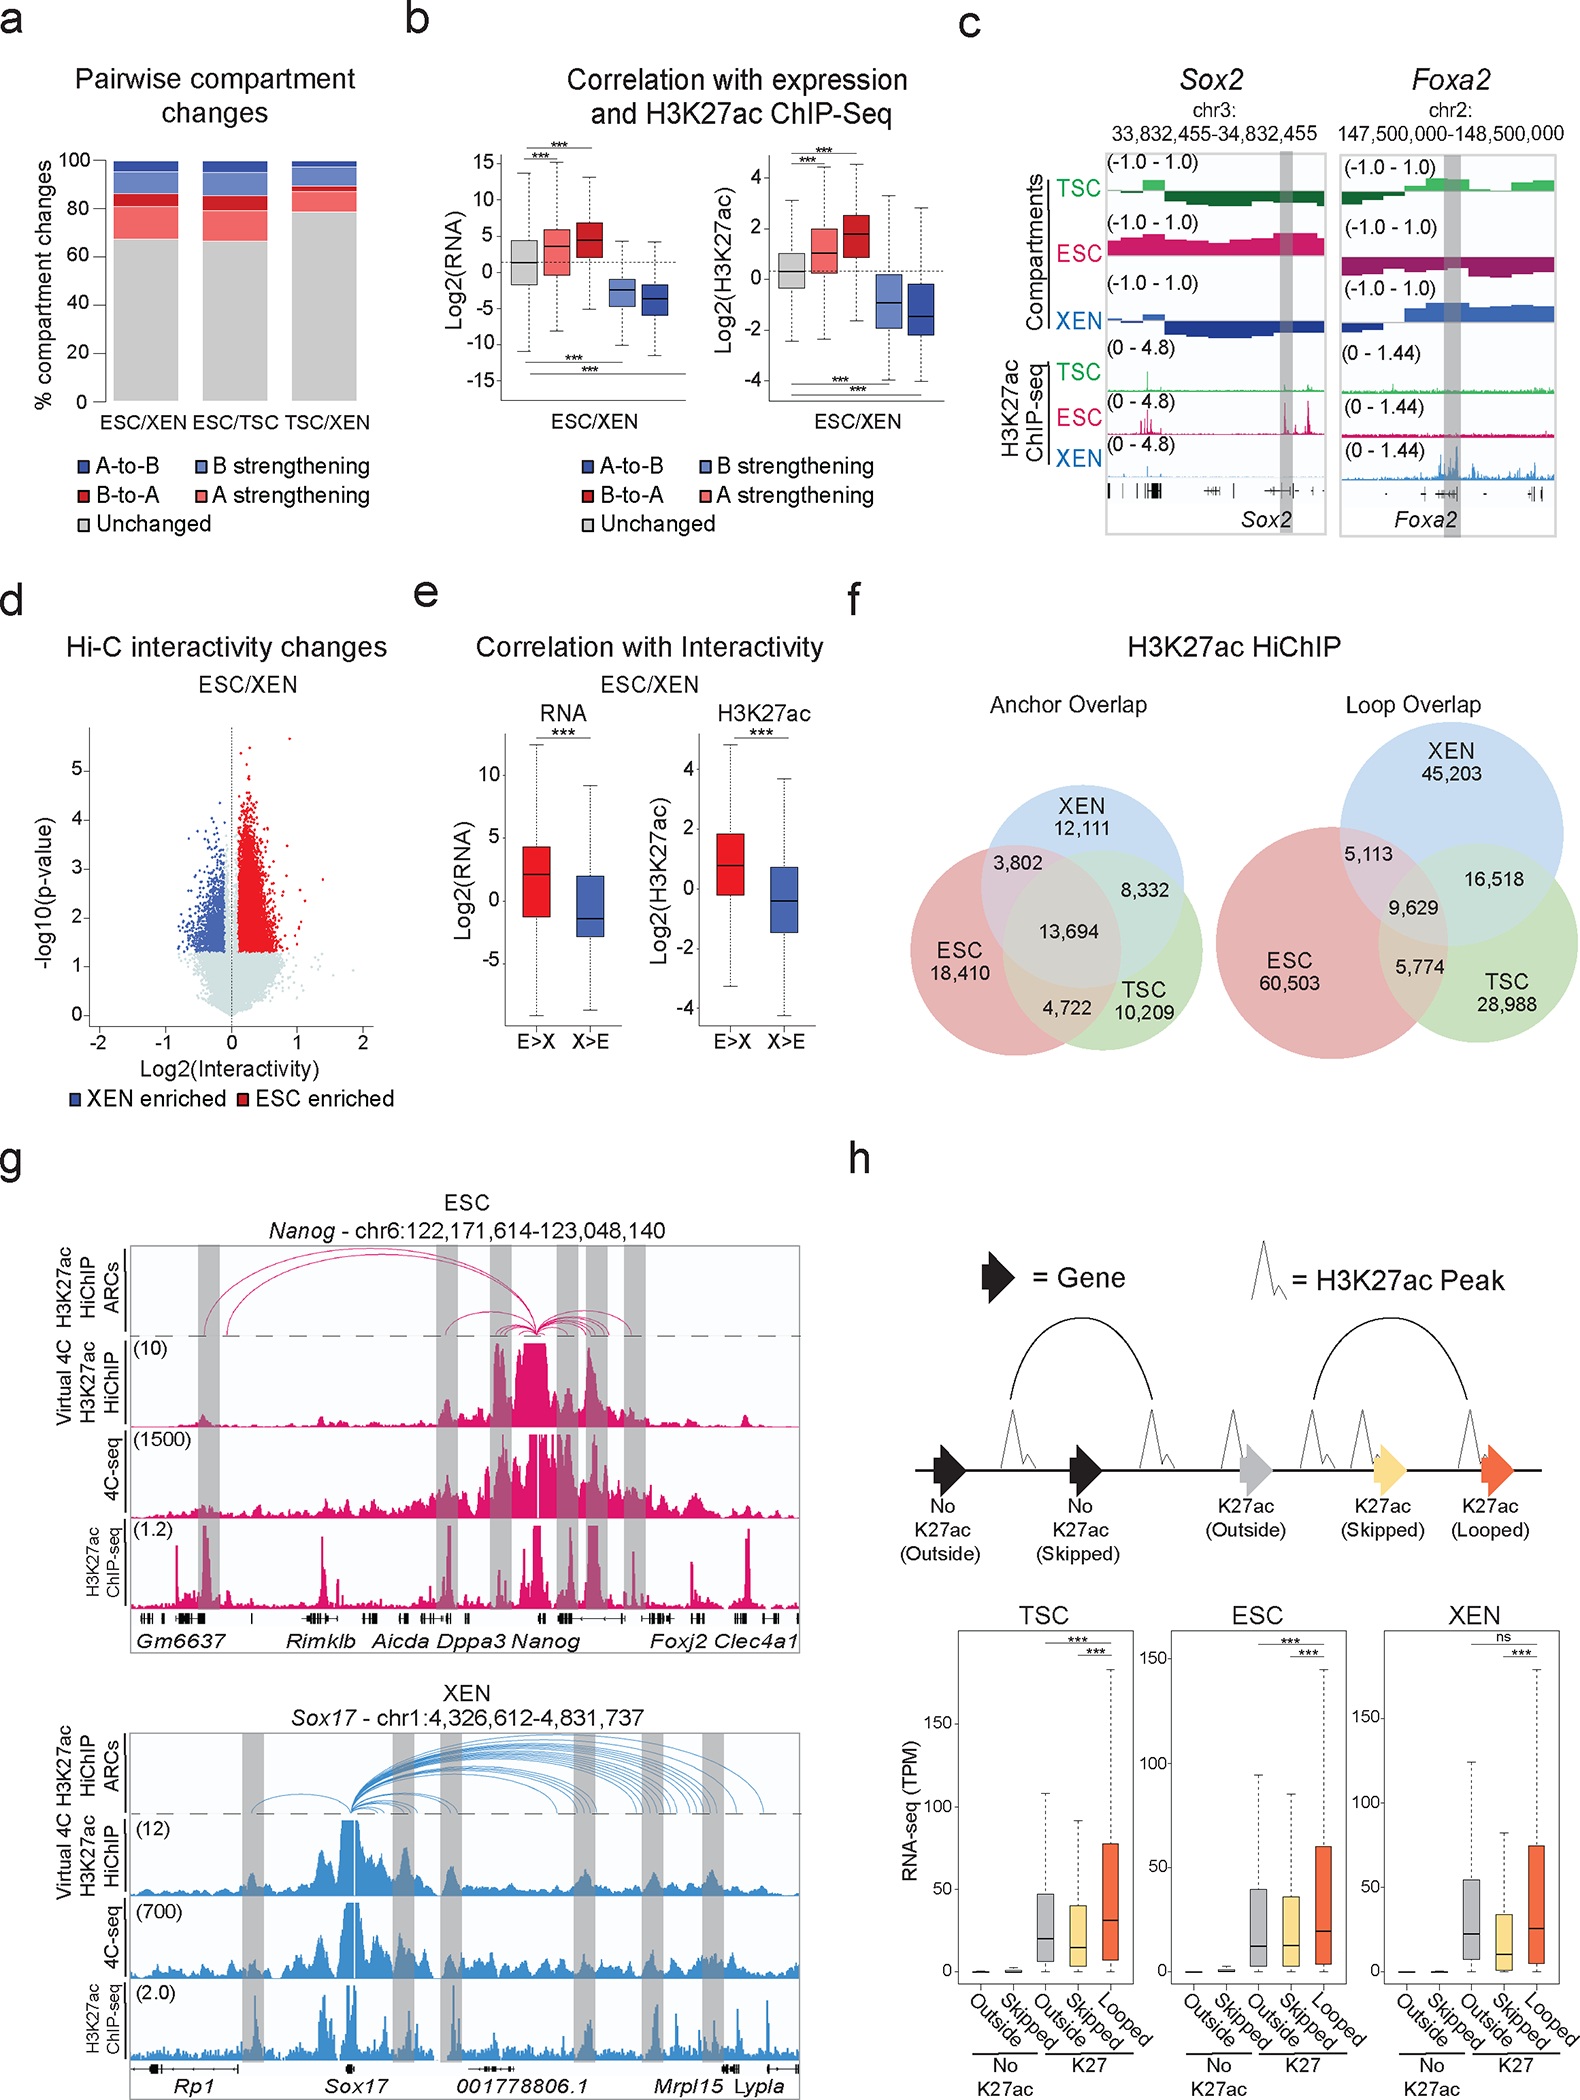
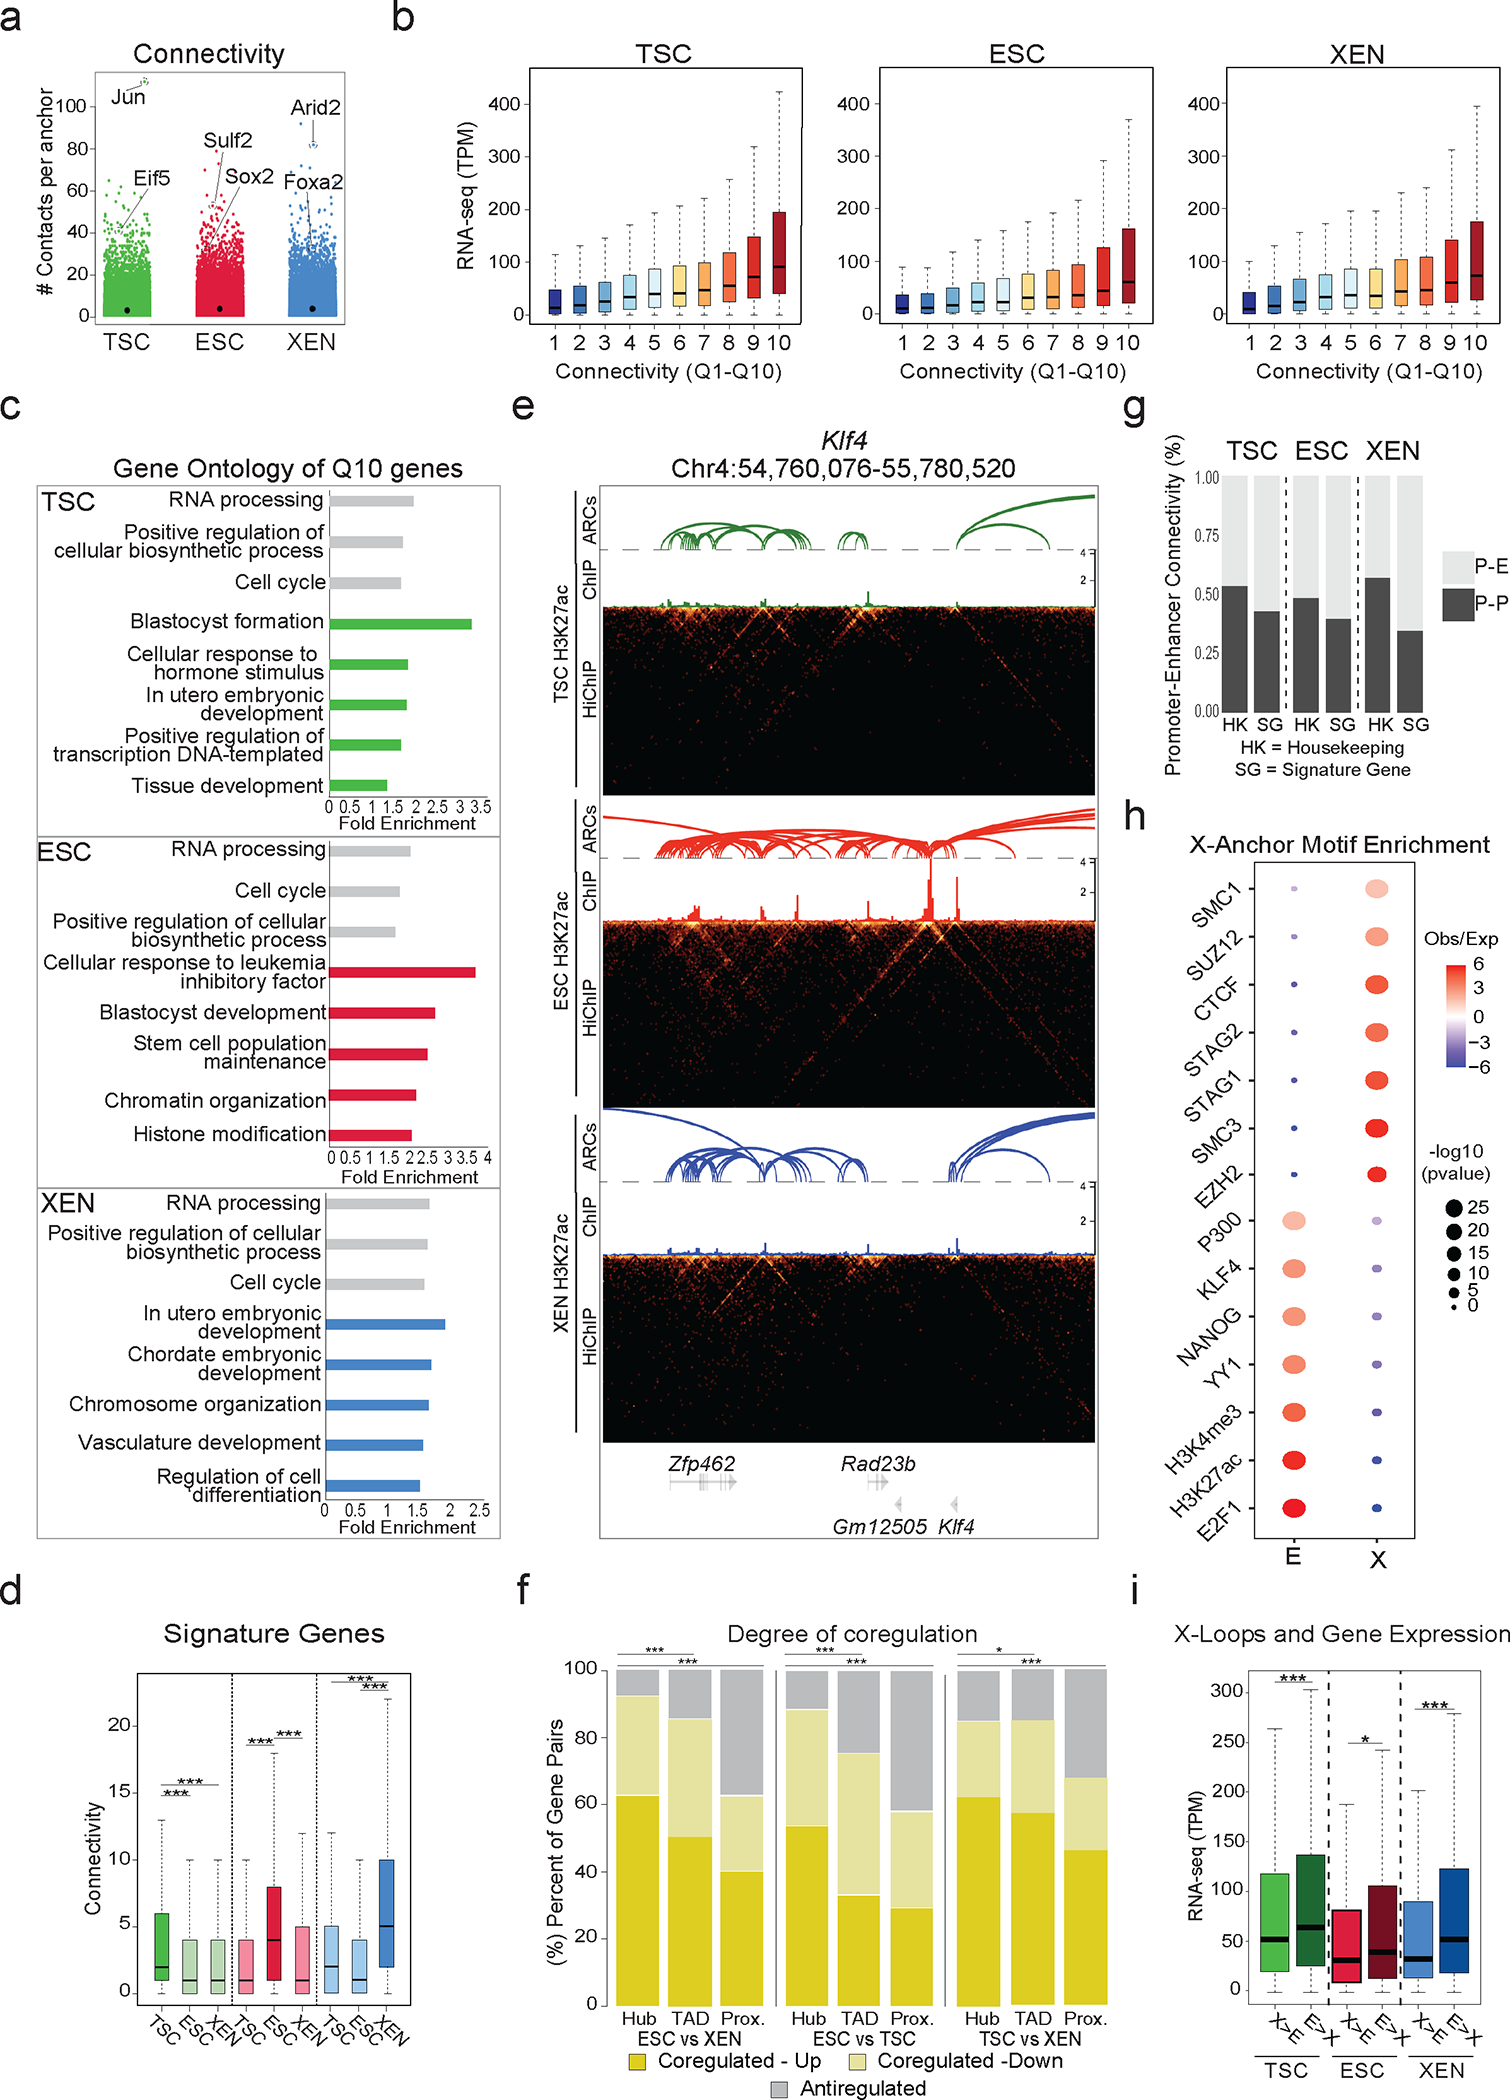
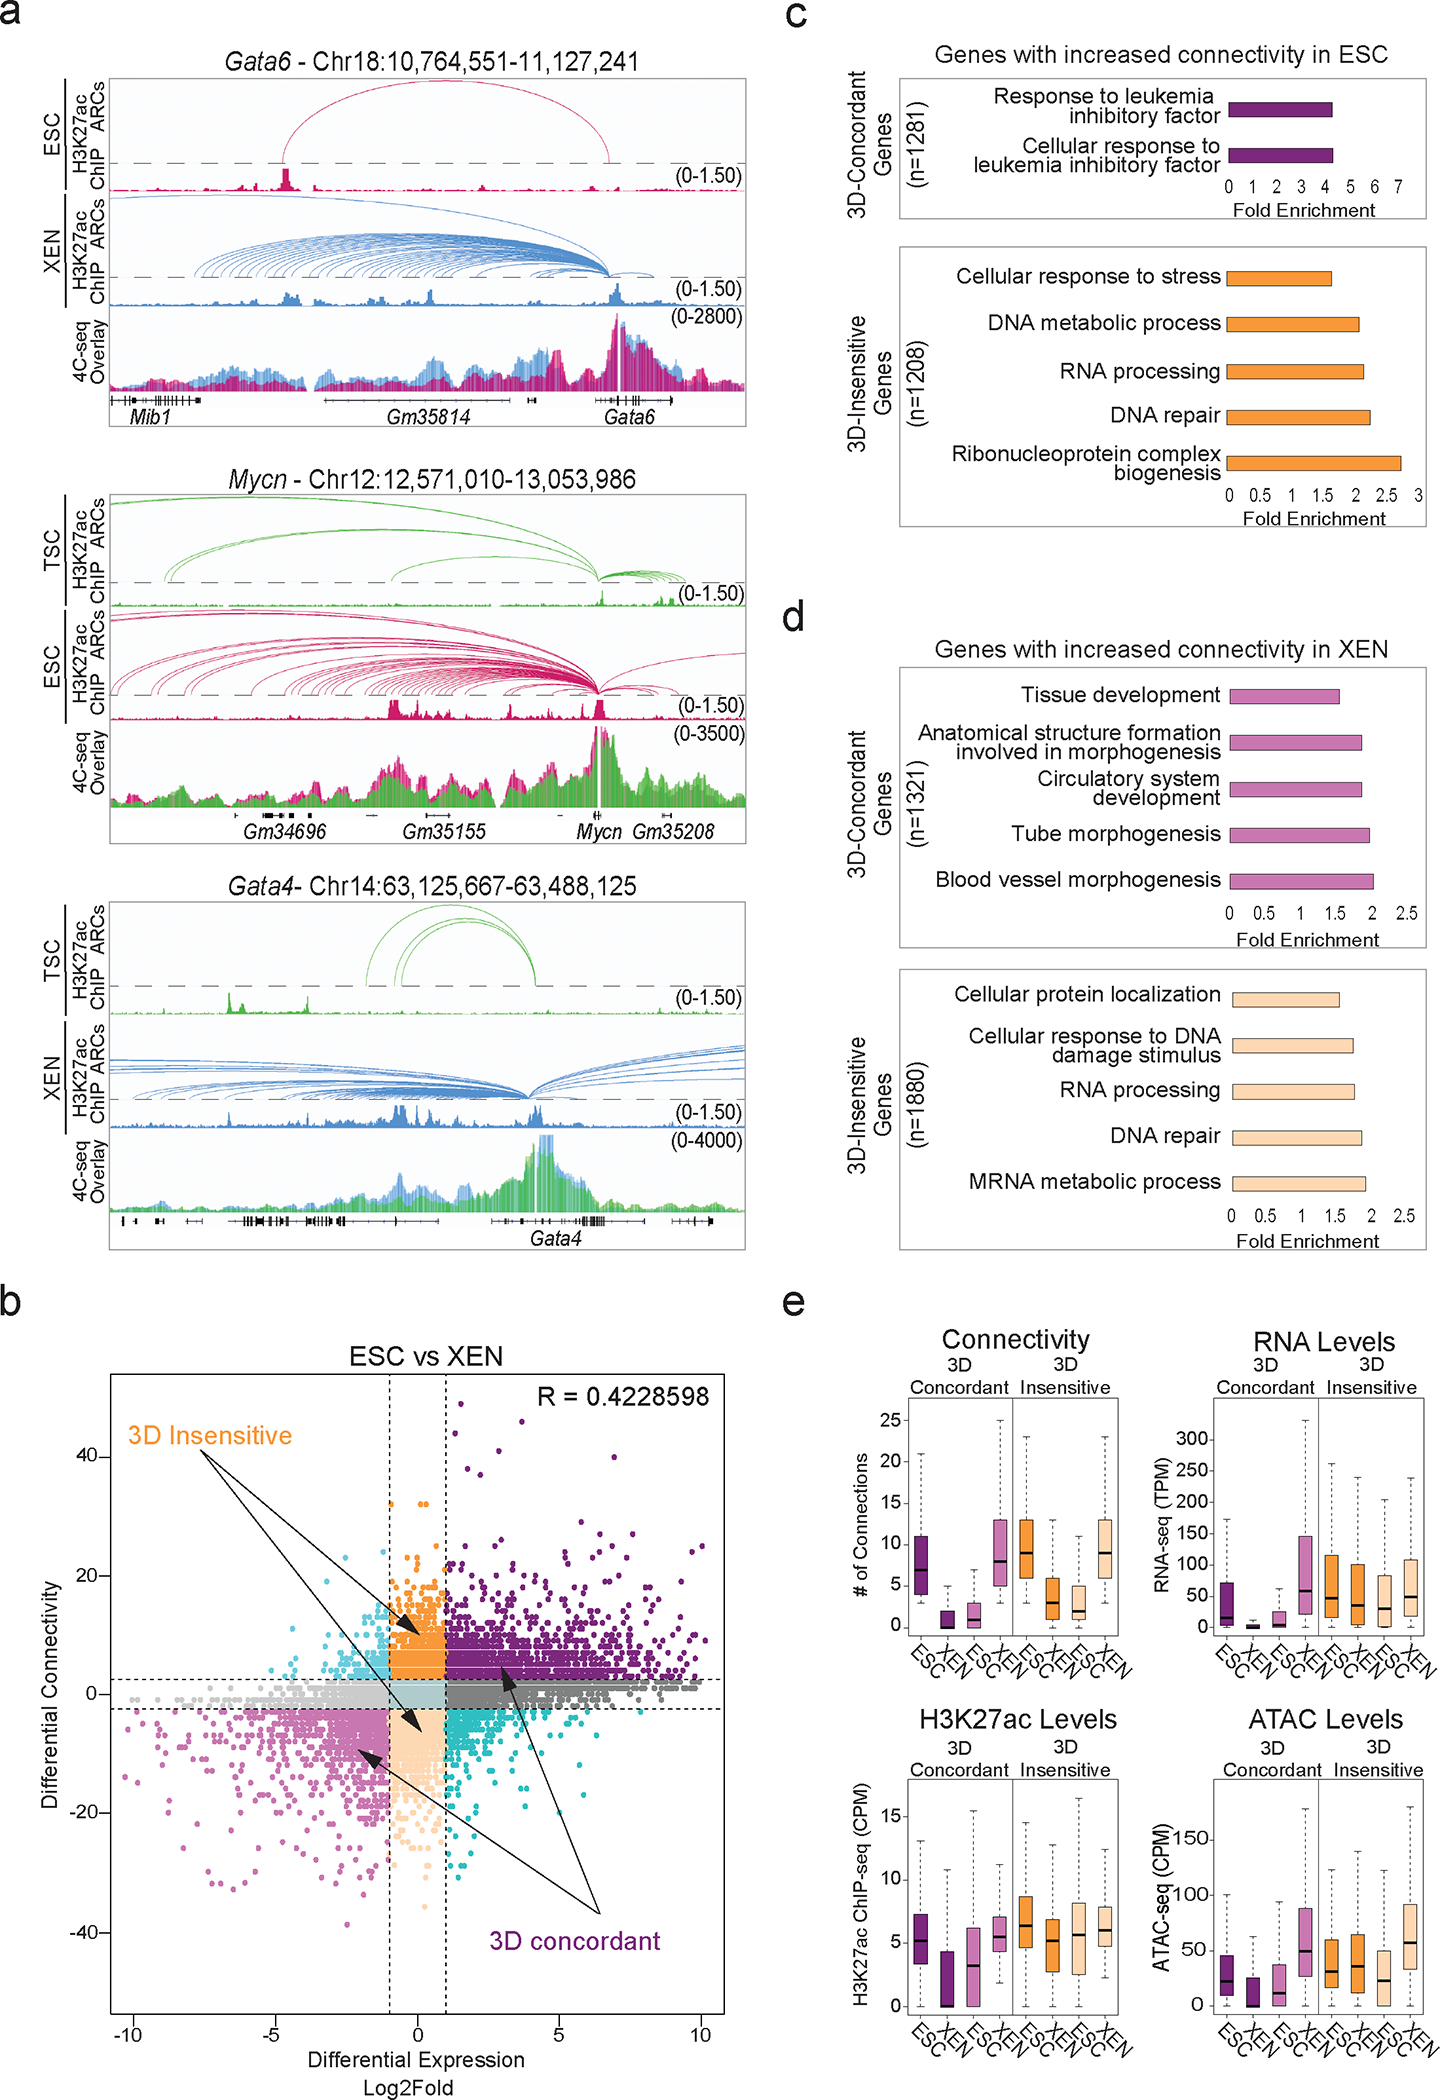
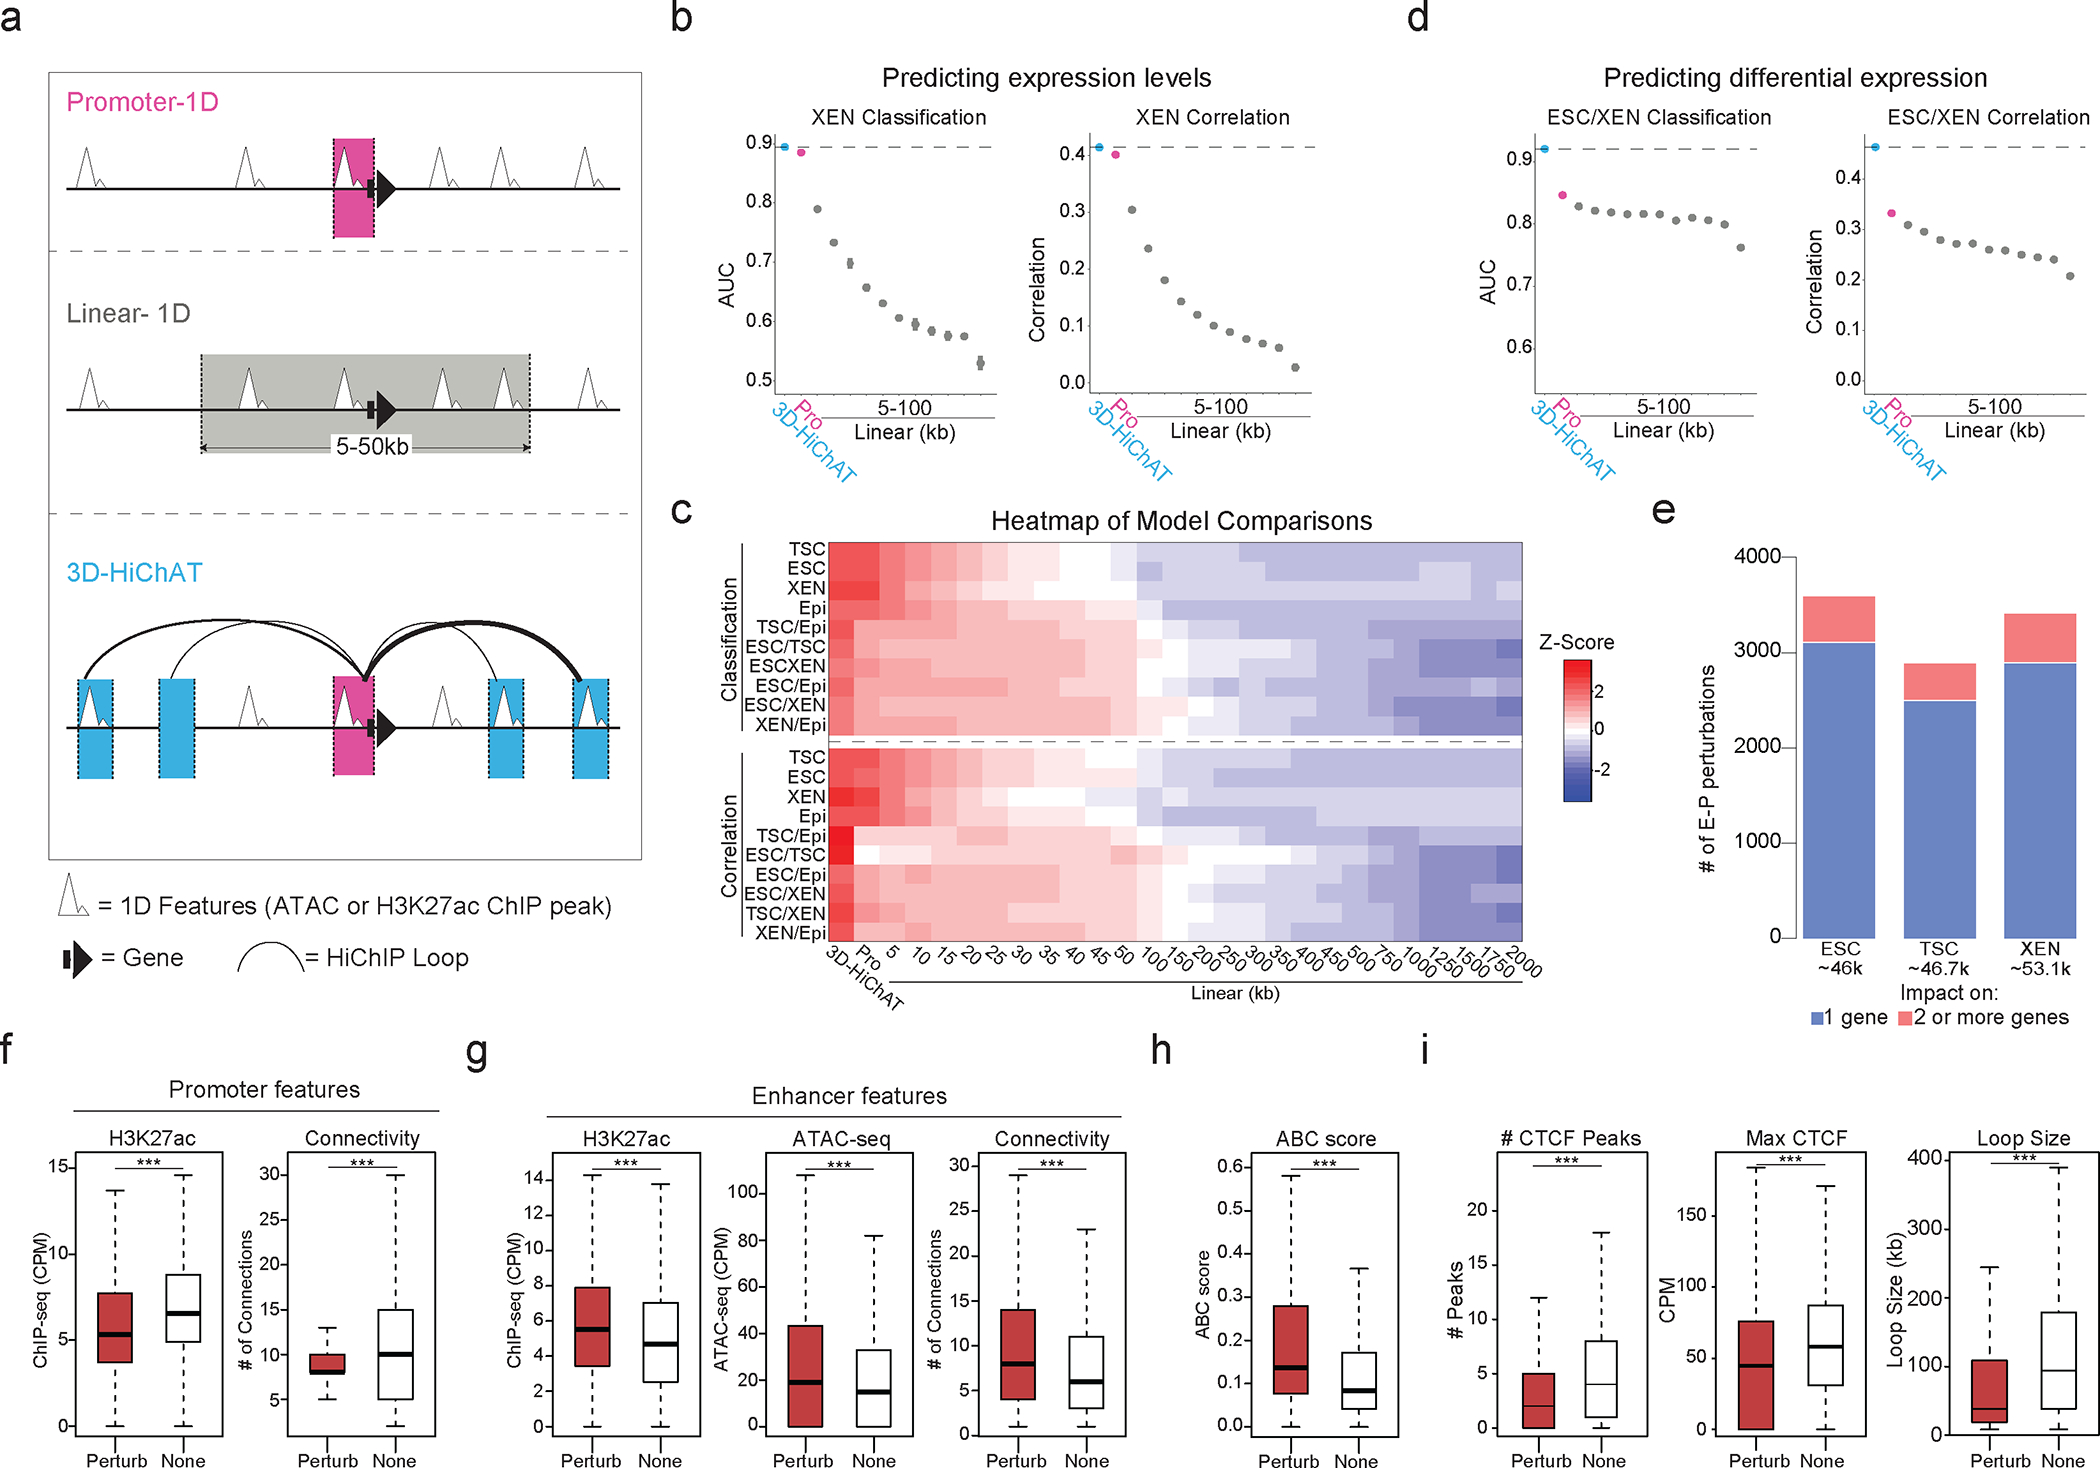
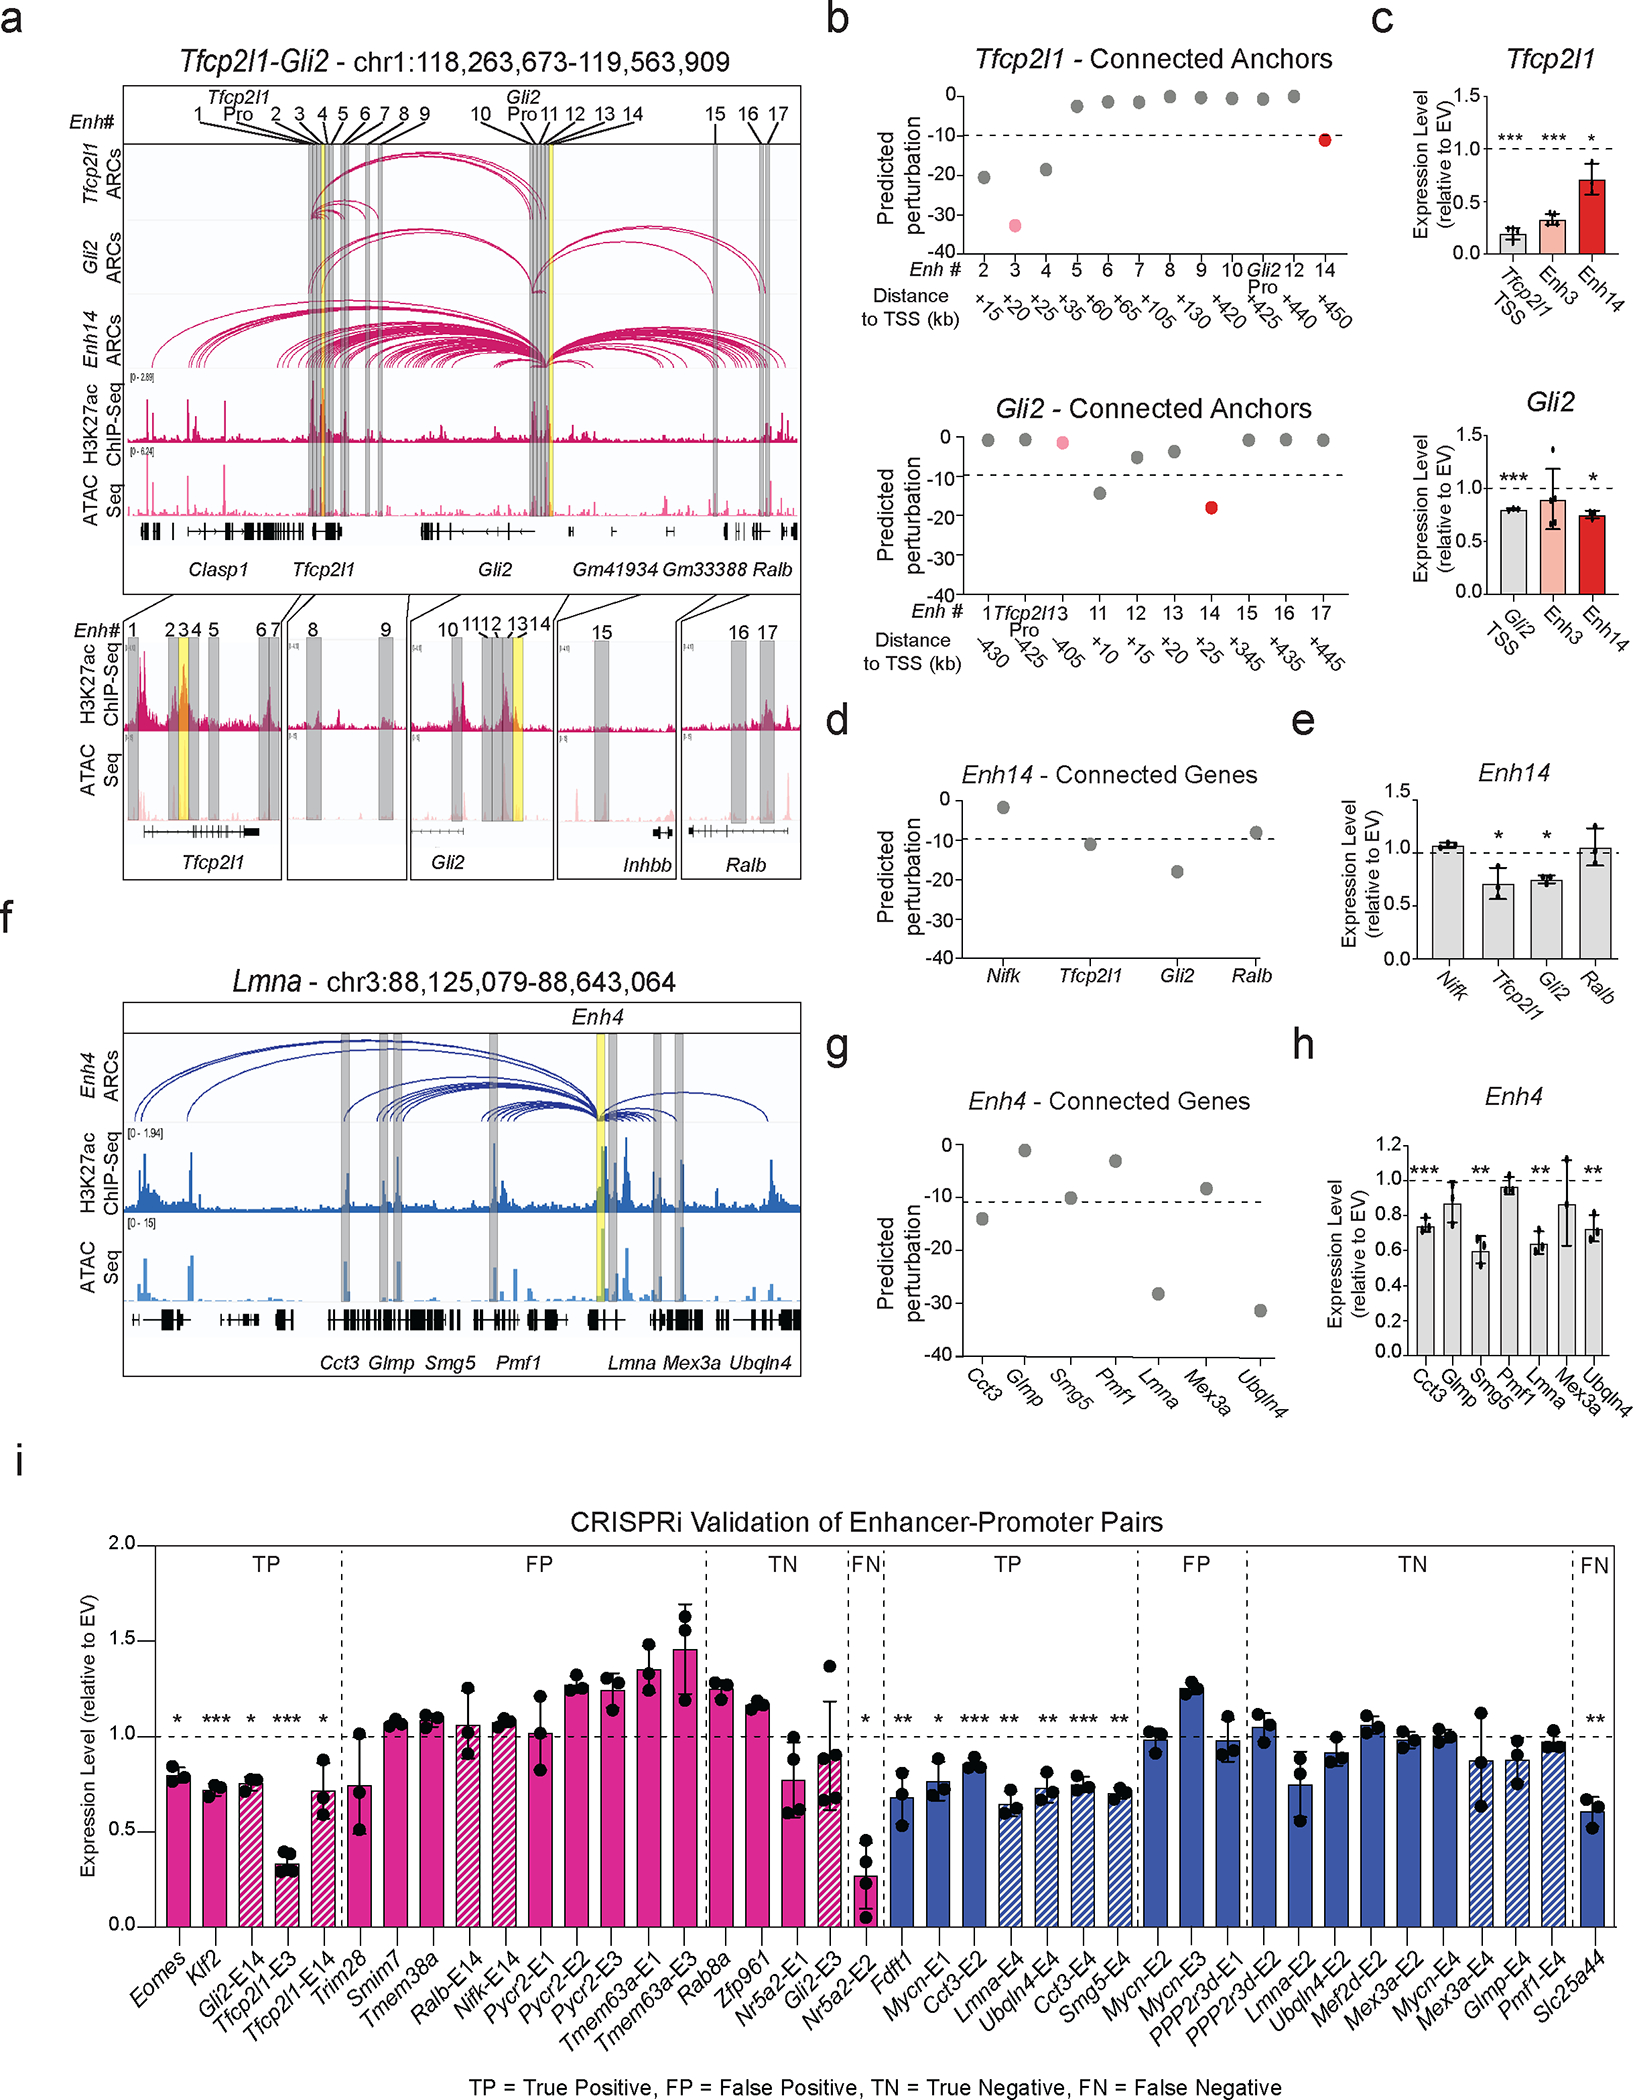
Mammalian embryogenesis commences with two pivotal and binary cell fate decisions that give rise to three essential lineages: the trophectoderm, the epiblast and the primitive endoderm. Although key signaling pathways and transcription factors that control these early embryonic decisions have been identified, the non-coding regulatory elements through which transcriptional regulators enact these fates remain understudied. Here, we characterize, at a genome-wide scale, enhancer activity and 3D connectivity in embryo-derived stem cell lines that represent each of the early developmental fates. We observe extensive enhancer remodeling and fine-scale 3D chromatin rewiring among the three lineages, which strongly associate with transcriptional changes, although distinct groups of genes are irresponsive to topological changes. In each lineage, a high degree of connectivity, or 'hubness', positively correlates with levels of gene expression and enriches for cell-type specific and essential genes. Genes within 3D hubs also show a significantly stronger probability of coregulation across lineages compared to genes in linear proximity or within the same contact domains. By incorporating 3D chromatin features, we build a predictive model for transcriptional regulation (3D-HiChAT) that outperforms models using only 1D promoter or proximal variables to predict levels and cell-type specificity of gene expression. Using 3D-HiChAT, we identify, in silico, candidate functional enhancers and hubs in each cell lineage, and with CRISPRi experiments, we validate several enhancers that control gene expression in their respective lineages. Our study identifies 3D regulatory hubs associated with the earliest mammalian lineages and describes their relationship to gene expression and cell identity, providing a framework to comprehensively understand lineage-specific transcriptional behaviors.


Conflict of interest statement

Conflict of interest statement

The authors declare that the above study was conducted in the absence of any commercial, financial, or personal relationships that could have appeared to influence the work reported in this article. All authors have approved the submitted version.

Figures

Extended Data Fig. 1.
Extended Data Fig. 1.. Related to Figure 1
a. Representative single (xy) stack epifluorescence images of immunofluorescence experiments showing expression of key lineage markers (greyscale) in TSC, ESC and XEN cells. Cells were counterstained with DAPI (blue) for DNA content. n=3 independent experiments. Scale bar 100μm. b. Principal component analysis (PCA) of all TSC, ESC and XEN replicates based on their RNA-seq, ATAC-seq and H3K27ac ChIP-seq profiles. PCA plots were designed based on the top10% of most variable genes or peaks in all three cell lines. In each plot, circles indicate the experimental data presented in this study, while squares and triangles correspond to publicly available RNA-seq data (Supplementary Table 8) or independent -unpublished- studies from our lab, respectively. c. Stacked barplot showing the distribution of H3K27 occupancy among intergenic regions, gene bodies or TSS (promoter +/− 1.5kb) for each K-Mean cluster as identified in Fig.1c. Note: all statistics are provided in Supplementary Table 9.
Extended Data Fig. 2.
Extended Data Fig. 2.. Related to Figure
a. Principal Component Analysis (PCA) plot of all lineages and replicates based on their compartment scores at 100kb resolution (top) and on their TAD insulation levels at 40kb resolution (bottom). b. Boxplots showing median expression changes between ESC and TSC (n = 4,327 genes), and TSC and XEN (n = 4156 genes) cells of genes in unaltered compartments (grey box and dashed line) or compartments with shifts as described in Fig 2b. Asterisks indicate significance (p<0.001) by two-sided Wilcoxon rank test. c. Volcano plot showing differential Hi-C interactivity at 40kb resolution between ESC – TSC and TSC - XEN. X-axis shows delta interactivity while y-axis shows −log10(p-value) calculated by two-sided Student’s t-test. Significant changes (p-value<0.05 and Diff>0.1 or <−0.1) are noted with blue and red color. d. Boxplots showing gene expression (n=2352 genes) and enhancer strength (n=15,982 peaks) changes between ESC-TSC regions with connectivity changes as described in Fig. 2c. Asterisks indicate significance (p<.001) by two-sided Student’s t-test. e. Boxplot comparing the sizes of HiChIP-detected loops in the three cell lineages across n=2 independent Hi-C samples. f. Aggregate peak analysis (APA) showing the aggregate signal of MicroC data in ESC centered around ESC HiChIP interacting regions identified by FitHiChIP2.0 at 5 kb resolution. (See Supplementary Table 4 and Methods). g. IGV tracks aligning H3K27ac HiChIP results (arcs on top and virtual 4C representation in the middle) with 4C-seq normalized signals around PDGFRA promoter in XEN along with corresponding H3K27ac ChIP-seq occupancy. h. Boxplot showing the median expression levels of a curated list of skipped and looped genes in ESC, XEN and TSC across n=2 independent HiChIP and RNA-seq samples. Selected genes have similar ranges of H3K27ac signal at promoters. Asterisks indicate significance (p-value<0.05), as calculated by two-sided Wilcoxon rank sum test. (See Supplementary Table 4). Note: all statistics are provided in Supplementary Table 9.
Extended Data Fig. 3.
Extended Data Fig. 3.. Related to Figure 3
a. HiGlass visualization of H3K27ac HiChIP results around a TSC related hub (Cdx2) and a XEN-related hub (Gata6) in TSC, ESC, and XEN along with the corresponding H3K27ac HiChIP derived arcs and H3K27ac ChIP-seq signals. Interacting scores are presented in 5kb resolution. b. Barplot showing the percentages of essential genes -as identified in two recent studies ,- within the least (Q1) versus most (Q10) connected hubs. The preferential enrichment of essential genes in Q10 is significant (p-value<0.001, two-sided Fisher’s exact test). c. Stacked barplots showing the proportions of different HiChIP loop subtypes in TSC, ESC and XEN cells. Loops were separated into 5 chromatin interaction categories based on the presence of regulatory elements, such as promoter/TSS (P) or putative enhancer (E, H3K27ac peak). X- anchors were defined as anchors that do not contain any TSS nor an H3K27ac peak. d. Boxplot showing the size distribution of X loops (X-E and X-P) compared to E-E, E-P and P-P loops in all cell lines. (n=60,909 (TSC), 81,679 (ESC), 77,124 (TSC) loops across n=2 independent HiChIP experiments) e. Boxplots showing expression changes between any two cell types around multiconnected genes (n>=5 in both cell types of interest), when at least one of their conserved anchors switches chromatin states: either from X-to-E (enhancer gain) or from E-to-X (enhancer loss) Asterisks indicate significance < 0.05 by two-sided Wilcoxon rank-sum test. (See also Supplementary Table 9). Note: all statistics are provided in Supplementary Table 9.
Extended data Fig. 4.
Extended data Fig. 4.. Related to Figure 4
a. Correlation between differential HiChIP connectivity/hubness and differential gene expression in connectivity and differential gene expression in ESC and TSC cells (top) and TSC and XEN cells (bottom). R represents Spearman correlation identifies distinct groups of genes. We focus on the two most prominent groups: 3D-insensitive genes, defined as genes with differential connectivity >3 but no transcriptional changes (log2FC<1 or >−1) and 3D-concordant genes for which connectivity and expression changes (log2FC >1 or <−1) positively correlate (Supplementary Table 5). b-e. Gene ontology analysis depicting the most significant biological processes enriched in the 3D concordant and 3D-insensitive genes in each pairwise comparison (ESC vs TSC and TSC vs XEN) as defined in (a). All genes in A compartments were used as background. For further details see also Supplementary Table 3. f. Comparison of connectivity, gene expression levels as well as H3K27ac and ATAC CPM levels between ESC and TSC cells (left) and TSC and XEN cells (right) at promoters of 3D-concordant (n=1818 for ESC/TSC and n=1108 for TSC/XEN) and 3D-insensitive genes (n=2637 for ESC/TSC, n=2230 for TSC/XEN) as defined in (a). Insensitive genes show higher levels of connectivity, H3K27ac, ATAC and expression in both cell types. Two-sided Wilcoxon rank sum test was used for all comparisons with p > 0.05 indicating significance. (Supplementary Table 9). Note: all statistics are provided in Supplementary Table 9.
Extended data Fig. 5.
Extended data Fig. 5.. Related to Figure 5
a. Barplot of feature importance showing 10 1D (pink) and 3D (blue) features, ranked from high to low. Light blue indicates features not selected. (See Supplementary Table 6). b. Spearman correlation values for each variable considered for our 3D model with gene expression (left) and differential expression (right). Dots represent minimum, mean and maximum correlation scores. (See Supplementary Table 6). c. Area Under Curve (AUC) scores and Spearman Correlation for classifying gene expression (top 10% high vs low, left graph) and predicting levels (right graph) in ESC or TSC cells using 3D-HiChAT, Promoter and Linear models. Dots represent average scores from LOCO training approach (n=20). Error bars show standard deviation. (See Extended Data Figure 5, Supplementary Table 6). d. Plots showing AUC and Spearman correlation for classifying gene expression (top 10% high vs low, left graph) and predicting levels (right graph) using 3D-HiChAT in various lineages including mouse lineages and published human data: Naïve T cells, T-Helper 17 Cells (Th17), and T regulatory cells (Tregs),. e. AUC scores and Spearman Correlation generated for classifying differential expression (top 10% up or downregulated, left) and predicting expression changes (right) between XEN and ESCs using 3D-HiChAT, Promoter and Linear models. Dots represent average scores from LOCO training approach (n=20). Error bars show standard deviation. (See Supplementary Table 6). f. Ranked perturbation scores (%) predicted by in silico perturbations of ~46K E-P pairs in ESC, ~46.7K in TSC and ~53.1K in XEN using 3D-HiChAT. Dotted horizontal lines indicate selected cut-offs for impactful perturbations. g. Scatterplot comparing predicted perturbation scores from 3D-HiChAT with respective ABC scores. R Spearman correlation values are shown on the top. h. Boxplots showing that enhancers with high 3D-HiChAT-predicted perturbation scores and low ABC scores (red) are more distal to their target genes (loop size) than those with high scores in both models (blue) (left plot n=3,428 enhancers). Enhancers/anchors with high 3D-HiChAT scores are more distal to the ones with high ABC scores (>0.7) (right plot n=8,445 enhancers). Asterisks indicates significance calculated by two-sided Wilcoxon rank-sum test, p-val<0.001. Note: all statistics are provided in Supplementary Table 9.
Extended Data Fig. 6.
Extended Data Fig. 6.. Related to Figure 6
a. Visualization of the Tfcp2l1 Locus showing H3K27ac HiChIP arcs, H3K27ac ChIP and Compartment c-scores called by Hi-C for TSC, ESC, and XEN. Notably, a group of putative enhancers upstream of Gli2 are uniquely expressed and only in an A compartment in ESCs. b. IGV tracks of the Tfcp2l1-Gli2 locus showing the two enhancers chosen for functional validation, Enh3 and Enh14. H3K27ac HiChIP derived arcs originating from both enhancers are shown as well. RT-qPCR showing relative expression levels of Tfcp2l and Gli2 upon CRISPRi perturbation of Enh3 compared to control cells infected with empty vector (EV). Dots indicate independent experiments (n=3). Error bars represent mean ± SD. Asterisks indicate significance, with p-value <0.05, as calculated using unpaired one-tailed t-test. c. Schematic showing experimental strategy for generating a stable XEN line expressing dCas-BFP-KRAB (CRISPRi). Representative FACs plot from n>10 independent experiments. d. AUC curve (red) showing a value of 0.71 when comparing our precited perturbation scores to our experimental validations presented in Fig.6i for n=40 different E-P pairs. e. Scatter plot comparing the predicted perturbation scores and the ABC scores for each of the 40 experimentally tested E-P pairs. Spearman Correlation value of −0.49. Different colors indicate different groups reflecting the concordance or discordance between predictions and experimental validations as shown in Fig.6i. TP: true positive, TN: true negative, FP: false positive, FN: false negative. Note: all statistics are provided in Supplementary Table 9.
Figure 1.
Figure 1.. Transcriptional changes and enhancer remodeling accompany early developmental decisions.
a. Schematic illustration depicting the cell lines used to model early developmental fate decisions. b. Heatmap showing TSC, ESC and XEN signature genes, which are significantly upregulated in the respective cell line compared to the other two lineages (TPM>1, LogFC >2 and p-adjusted <0.01). Scale represents Z-score of normalized RNA-seq counts. RNA-seq was performed in two independent replicates for each sample. Examples of known regulators and markers of each lineage are highlighted on the bottom. (See Extended Data Fig.1.) c. Tornado plot (left) illustrating H3K27ac ChIP-seq signal for TSC, ESC and XEN around different clusters of peaks (+/−2.5 kb), as defined by K-means clustering (K=5) using all H3K27ac peaks across cell lines. Scale bars denote normalized H3K27ac ChIP-seq signal over input. Heatmap (right) illustrates Z-score normalized RNA-seq levels of most proximal genes to each of the H3K27 peaks. (See Supplementary Table 2.) d. Gene ontology analysis (using GREAT) of cell type specific enhancers as identified by K-means clustering shown in (1B). Significance was calculated using two-sided binomial test and “Region Fold Enrichment” is presented on the x-axis for selected significant (padj-value<0.05) biological processes shown in the graph. (See Supplementary Table 3.) e. Venn-diagram showing overlap of Super Enhancers (SE) in TSC, ESC and XEN cell lines, called by the ROSE algorithm using H3K27ac peaks as input. (See Supplementary Table 2). f. Relative enrichment of TF binding motifs found in cell-type specific SE. The enrichment plots depict selected significant motifs with −log10(p-value) higher in one cell type versus the other two. Size of dots indicates the p-value (two-sided Fisher’s exact test) while color indicates the ratio of observed versus expected frequency. (See Supplementary Table 3). Note: all statistics are provided in Supplementary Table 9.
Figure 2.
Figure 2.. Hi-C and H3K27ac HiChIP reveals multilayered 3D genomic reorganization and complex networks of putative regulatory interactions in TSC, ESC and XEN
a. Stacked barplots showing A/B Hi-Ccompartment changes for pairwise comparisons. Compartment changes (100kb resolution) assigned based on A/B status and C-score difference between cell lines as: A-to-B shifts (dark blue), B-to-A shifts (dark red), A-strengthening (light red), B-strengthening (light blue) or unchanged (grey). See Methods for details. b. Boxplots showing median expression changes (left, n=5230 genes) or H3K27ac ChIP-seq changes (right, n=12,225 peaks) between ESC and XEN cells for gene loci assigned to different groups described in (a). Asterisks indicate significance (p<0.001) by two-sided Wilcoxon rank test. (See Extended Data Fig. 2b). c. Examples of A/B compartment switches around developmentally relevant genes, Sox2 (left-ESC) and Foxa2 (right-XEN). d. Volcano plot showing differential Hi-C interactivity (40kb resolution) between ESC and XEN (n=2 independent replicates per sample). X-axis shows delta interactivity, y-axis shows −log10(p-value) calculated by two-sided Student’s t-test. Significant changes (p-value<0.05 and Diff>0.1 or <−0.1) are highlighted in blue (higher in XEN) or red (higher in ESC). (See Extended Data. Fig. 2c). e. Boxplots showing changes in gene expression (left, n=645 genes) and H3K27ac ChIP-seq (right, n=11,174 peaks) between ESC and XEN at regions with delta interactivity, described in (d). (See Extended Data. Fig. 2d). Asterisks indicate significance (p<0.001) by two-sided Wilcoxon rank test. f. Venn diagrams of shared and unique annotated anchors (left) and loops (right) in TSC (green), ESC (red) and XEN (blue) cells detected by H3K27ac HiChIP. Interactions identified by FitHiChIP 2.0 (5kb resolution). g. IGV tracks showing concordance between H3K27ac HiChIP (Arcs on top, virtual 4C of normalized H3K27ac HiChIP signal in the middle) with independent in situ 4C-seq experiments around selected viewpoints (top = Nanog promoter, bottom = Sox17 promoter) and H3K27ac ChIP-seq tracks. Common interactions are highlighted in grey. h. Schematic (top) defining gene categories by HiChIP loop status (looped, skipped, outside) and H3K27ac promoter presence (noK27ac vs K27ac). Boxplot (bottom) depicting median gene expression. n=26,742 genes across 2 independent RNA-seq samples per cell line. Asterisks indicate significant differences (p-val<0.001) by two-sided Wilcoxon rank test. Note: all statistics are provided in Supplementary Table 9.
Figure 3.
Figure 3.. Association of high 3D hubness with levels, cell-type specificity and coregulation of gene expression in early embryonic fates.
a. Plot showing connectivity range at 5kb HiChIP-detected anchors (hubness) in TSC, ESC and XEN cells. Highly connected example gene anchors are highlighted. b. Boxplots showing median expression levels of genes with increasing HiChIP connectivity. All looped genes were binned into 10 quantiles by promoter connectivity (Q1 = least connected, Q10 = most connected). n=8870 (TSC), 9027 (ESC), 8848 (XEN) promoters across n=2 independent HiChIP and RNA-seq experiments. c. Selected Gene ontology housekeeping (grey) or lineage-related (colored) terms enriched in multi-connected Q10 genes in ESC, XEN and TSC. (See Supplementary Table 3). d. Boxplots showing distribution and median connectivity of signature genes in each cell type. Dark colors indicate signature genes origin (TSC n=892 (green), ESC n=1663 (red), XEN n=999 cells (blue). Asterisks indicate significant differences (p<.001) by two-sided Wilcoxon rank test. e. HiGlass visualization of an ESC hub -Klf4 genomic locus- shown in TSC, ESC, and XEN with corresponding H3K27ac HiChIP-derived arcs and H3K27ac ChIP-seq signals. f. Stacked barplots showing percentages of gene pairs coregulated (both upregulated or downregulated with log2 fold change>1 or <=1 and p.adj<−0.01) or anti-regulated (one upregulated, one downregulated). Gene pairs were from the same hub (shared anchor by HiChIP), the same TAD or nearest linear proximity. Statistics calculated by two-sided Fisher’s exact test (Supplementary Table 9). g. Barplots showing percentages of Promoter-Enhancer (PE) or Promoter-Promoter (PP) pairs at housekeeping (HK) genes or signature genes (SG) in each cell type. h. Relative enrichment of selected TF binding motifs in Enhancer (E) or X-linked anchors (X) in ESC calculated using LOLA. Dot size indicates p-value (two-sided Fisher’s exact test), color indicates ratio of observed versus expected. (See Supplementary Table 3). i. Boxplots comparing gene expression for genes with different relative proportions of connected X and E anchors. The ratio of Enhancer vs X anchors is >2 (E>X hubs) or <0.5 (X>E hubs). n=1908 (TSC), 2668 (ESC) and 2410 (XEN) genes across n=2 independent HiChIP and RNA-seq experiments Asterisks indicate significant differences (* = p<0.05, *** = p<.001) by two-sided Wilcoxon rank test. Note: all statistics are provided in Supplementary Table 9.
Figure 4.
Figure 4.. Association of 3D rewiring with cell-type specific gene expression
a. Examples of 3D rewiring at developmental genes in TSC, ESC and XEN detected by H3K27ac HiChIP (arcs on top with respective H3K27ac ChIP-seq tracks), validated by 4C-seq (merged tracks at the bottom). Averaged 4C-seq signals from n=3 independent replicates. b. Correlation between differential HiChIP connectivity/hubness and differential gene expression in ESC vs XEN cells. R represents Spearman correlation. Two prominent groups are highlighted: 3D-insensitive genes with differential connectivity >3 but no transcriptional changes (log2FC<1 or >−1) and 3D-concordant genes with connectivity and expression changes (log2FC >1 or <−1) positively correlating (Supplementary Table 5). c. Gene ontology depicting select biological processes significantly enriched in 3D concordant (purple) and 3D insensitive (orange) groups in ESC cells as defined in (b). (See Supplementary Table 3). d. Same as (c), but for XEN cells. (See Supplementary Table 3). e. Comparison of connectivity, gene expression (TPM), H3K27ac and ATAC CPM levels at promoters of 3D-concordant (n=2,235) and 3D-insensitive genes (n = 2581) in ESC and XEN cells. Two-sided Wilcoxon rank sum test was used for all comparisons (Supplementary Table 9). Note: all statistics are provided in Supplementary Table 9.
Figure 5.
Figure 5.. Predictive modeling using 3D chromatin features outperforms promoter- or 1D-based models for gene expression levels or cell-type specificity
a. Schematic illustration of 1D or 3D variables used for modeling gene expression. (See Supplementary Table 6). b. Area Under Curve (AUC) scores and Spearman Correlation for classifying gene expression (top 10% high vs low, left graph) and predicting absolute levels (right graph) in XEN using 3D-HiChAT, Promoter and Linear models. Dots represents average scores from the LOCO training approach, error bars show standard deviation. (See Extended Data Figure 5 and Supplementary Table 6). c. Top: Heatmap of z-scored normalized AUC values across tested models for classification of gene expression or differential gene expression (top 10% high or low) in each cell line. Bottom: Heatmap of z-scored normalized Spearman correlation values across all models for prediction of gene expression levels or differential expression in each lineage. (See Supplementary Table 6). d. AUC scores and Spearman Correlation generated for classifying differential expression (top 10% up or downregulated, left) and predicting expression (right) between XEN and ESCs using 3D-HiChAT, Promoter and Linear models. Dots represents average scores from the LOCO training approach, error bars show standard deviation. (See Extended Data Figure 5 and Supplementary Table 6). e. Barplots showing numbers of E-P perturbations predicted to reduce one (blue) or more (pink) target gene expression using 3D-HiChAT. (See Extended Data Fig. 5f). f. Boxplots showing median H3K27ac signals (left) or Connectivity (right) at promoter anchors of either perturbed (Perturb, n=4231) or unaffected E-P pairs (None, n= 4231) in ESC as described in (e). Asterisks indicate significance pval<0.001 by Two-sided Wilcoxon rank test. (g-h). Boxplots showing median H3K27ac signal, ATAC-seq signal, Connectivity (g) and ABC score (h) at enhancer anchors of either perturbed (Perturb n=4231) or unaffected E-P pairs (None n=4231) in ESC as described in (e). Asterisks indicate significance pval<0.001 by two-sided Wilcoxon rank test. i. Boxplots showing median numbers and max intensities of intervening CTCF peaks and genomic distance between perturbed (Perturb n=4231) or unaffected E-P pairs (None n=4231) in ESC as described in (e). Asterisks indicate significance pval<0.001 by two-sided Wilcoxon rank test. Note: all statistics are provided in Supplementary Table 9.
Figure 6.
Figure 6.. Experimental validation of predicted enhancers in ESC and XEN
a. IGV tracks of the Tfcp2l1-Gli2 locus depicting putative regulatory elements. HiChIP arcs from both promoters and Enh14 are shown with H3K27ac ChIP-Seq and ATAC-seq. b. Predicted 3D-HiChAT perturbation scores for Tfcp2l1, Gli2 promoter connected putative enhancers. Dotted line indicates cut-off (<−9.9) for impactful hits in ESC (see Extended Data Fig.5f and Methods). c. Relative mRNA levels of Tfcp2l/Gli2 upon CRISPRi-targeting compared to empty vector (EV). Dots indicate biological replicates (n= 3 for Enh14 and n=5 for, independent experiments). Error bars indicate mean ± SD. Statistical performed by one-tailed unpaired student t-test. Asterisks indicate significance < 0.05. d. 3D-HiChAT perturbation scores for Enh14 connected genes. Dotted line indicates cut-off (<−9.9) for impactful hits in ESC (see Extended Data Fig.5f and Methods). e. Relative mRNA levels of genes upon Enh14 CRISPRi perturbation in ESCs compared to empty vector (EV). Dots indicate biological replicates (n = 3 independent experiments). Error bars indicate mean ± SD. Statistics performed by one-tailed unpaired student t-test. Asterisks indicate significance < 0.05. f. IGV tracks of Enh4 interacting with 7 genes (yellow) in XEN. HiChIP arcs originating from Enh4, H3K27ac ChIP-Seq and ATAC-seq are shown. g. Predicted perturbation scores for Enh4 hub connected genes. Dotted line indicates cut-off (<−11.20) chosen for impactful hits in XEN (see Extended Data Fig.5f and Methods). h. Relative mRNA levels of genes upon Enh4 CRISPRi in XEN compared to empty vector (EV). Dots indicate biological replicates (n= 3 independent experiments). Error bars indicate mean ± SD. Statistics performed by one-tailed unpaired student t-test. Asterisks indicate significance < 0.05. i. Barplots summarizing expression changes upon CRISPRi perturbations of 40 enhancer-promoter pairs in ESC (Pink) and XEN (blue), with positive (cut-off <−9 for ESC, <−11.2 in XEN) or negative predictions, by 3D-HiChAT. Bars represent RT-qPCR values relative to Empty Vector (EV) with housekeeping normalization (Hprt for ESC, Gapdh for XEN). Shaded bars indicate data from above (c), (e) or (h). Dots indicate biological replicates (n=3 independent experiments). Error bars represent mean ± SD. Statistical analysis was performed by one-tailed unpaired student t-test. Asterisks indicate significance < 0.05. Note: all statistics and source PCR data are provided in Supplementary Table 9.

Update of

Similar articles

Cited by

References

    1. Alberio R Regulation of Cell Fate Decisions in Early Mammalian Embryos. Annual Review of Animal Biosciences (2020). doi:10.1146/annurev-animal-021419-083841 - DOI - PubMed
    1. Bardot ES & Hadjantonakis AK Mouse gastrulation: Coordination of tissue patterning, specification and diversification of cell fate. Mech. Dev. (2020). doi:10.1016/j.mod.2020.103617 - DOI - PMC - PubMed
    1. Rossant J Making the Mouse Blastocyst: Past, Present, and Future. in Current Topics in Developmental Biology (2016). doi:10.1016/bs.ctdb.2015.11.015 - DOI - PubMed
    1. Rossant J & Tam PPL Blastocyst lineage formation, early embryonic asymmetries and axis patterning in the mouse. Development (2009). doi:10.1242/dev.017178 - DOI - PubMed
    1. Grabarek JB et al. Differential plasticity of epiblast and primitive endoderm precursors within the ICM of the early mouse embryo. Development (2012). doi:10.1242/dev.067702 - DOI - PMC - PubMed

MeSH terms