. 2023 Dec 6;14(1):151.
doi: 10.1186/s40104-023-00948-8.

Single-cell transcriptomic atlas of goat ovarian aging

Affiliations

Single-cell transcriptomic atlas of goat ovarian aging

Dejun Xu et al. J Anim Sci Biotechnol. .

Abstract

Background: The ovaries are one of the first organs that undergo degenerative changes earlier in the aging process, and ovarian aging is shown by a decrease in the number and quality of oocytes. However, little is known about the molecular mechanisms of female age-related fertility decline in different types of ovarian cells during aging, especially in goats. Therefore, the aim of this study was to reveal the mechanisms driving ovarian aging in goats at single-cell resolution.

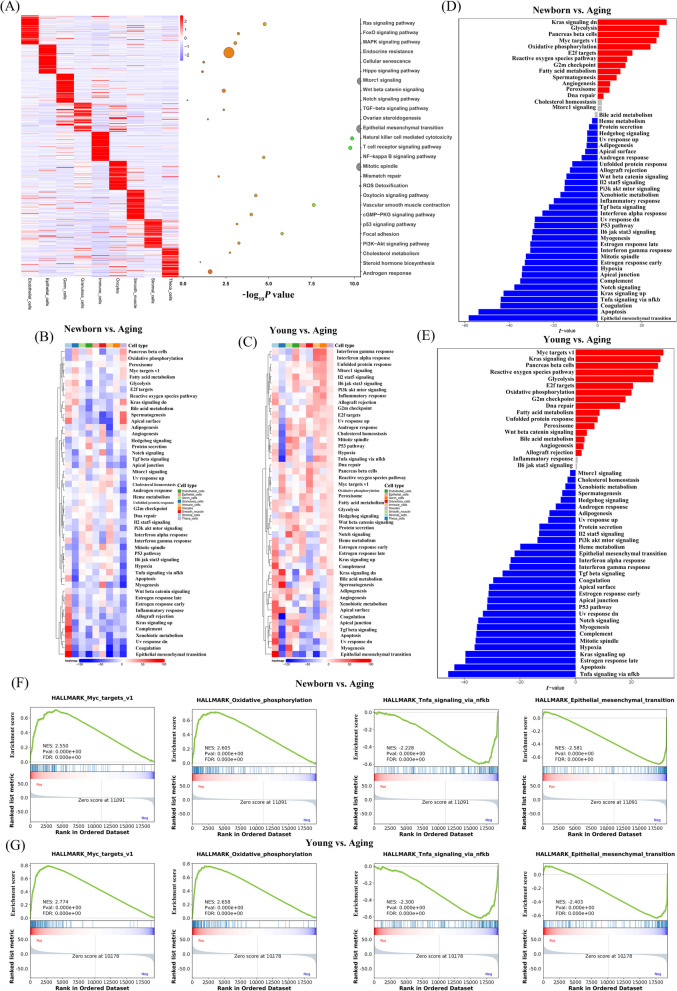
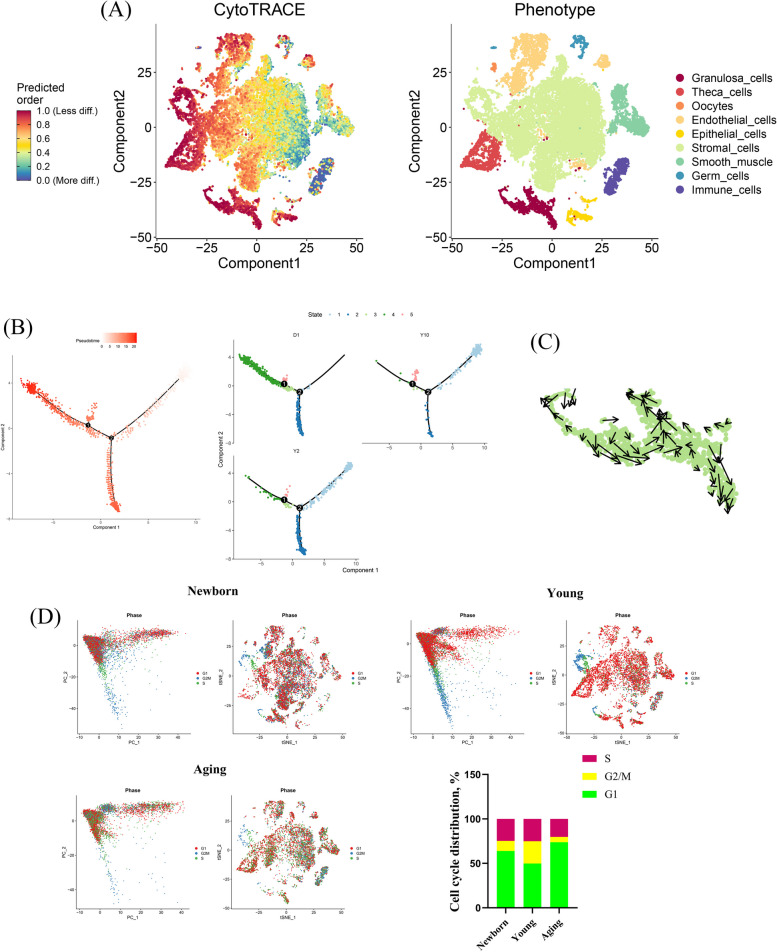
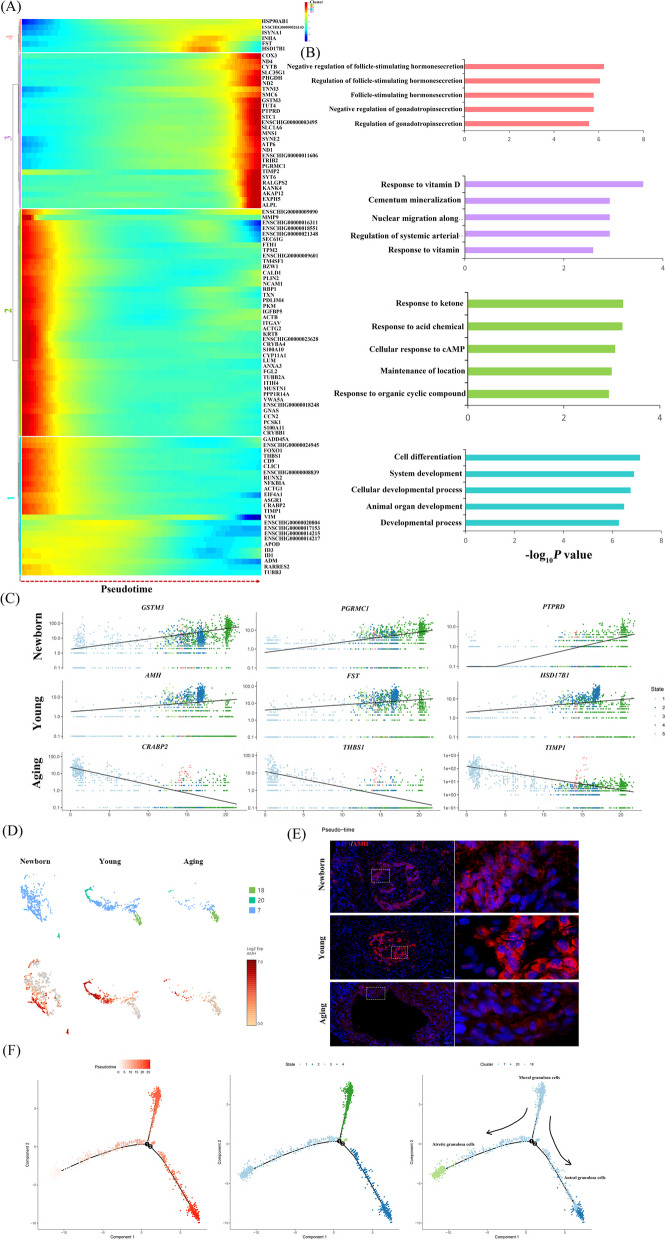
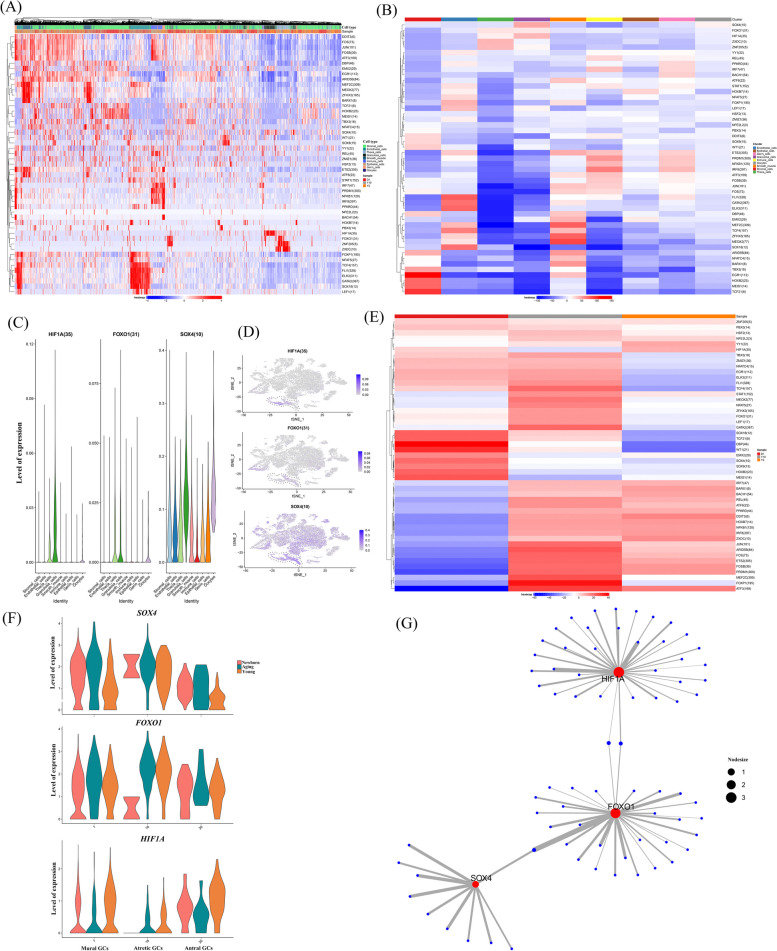
Results: For the first time, we surveyed the single-cell transcriptomic landscape of over 27,000 ovarian cells from newborn, young and aging goats, and identified nine ovarian cell types with distinct gene-expression signatures. Functional enrichment analysis showed that ovarian cell types were involved in their own unique biological processes, such as Wnt beta-catenin signalling was enriched in germ cells, whereas ovarian steroidogenesis was enriched in granulosa cells (GCs). Further analysis showed that ovarian aging was linked to GCs-specific changes in the antioxidant system, oxidative phosphorylation, and apoptosis. Subsequently, we identified a series of dynamic genes, such as AMH, CRABP2, THBS1 and TIMP1, which determined the fate of GCs. Additionally, FOXO1, SOX4, and HIF1A were identified as significant regulons that instructed the differentiation of GCs in a distinct manner during ovarian aging.

Conclusions: This study revealed a comprehensive aging-associated transcriptomic atlas characterizing the cell type-specific mechanisms during ovarian aging at the single-cell level and offers new diagnostic biomarkers and potential therapeutic targets for age-related goat ovarian diseases.

Keywords: Goat; Granulosa cells; Ovarian aging; Single-cell transcriptomic.


Conflict of interest statement

The authors declare that they have no competing interests.

Figures

Fig. 1
Fig. 1
Identification of goat ovarian cell types by single-cell RNA-seq transcriptomics. A Flowcharts of goat ovarian scRNA-seq. B A t-SNE plot was used to visualize nine ovarian cell types. Each point corresponding to a single cell is colour-coded according to its cell type membership. C The dot plot shows distinct expression patterns of the selected signature genes for each cell type. D Expression specificity of the signature genes in ovarian cells, and the colour indicates the level of expression
Fig. 2
Fig. 2
Gene expression signatures of granulosa cells during ovarian aging. A Left: heatmap showing the expression signatures of the top 50 specifically expressed genes in each cell type; the value for each gene is the row-scaled Z score. Right: representative GO terms for specific genes. B A heatmap was visualized based on the highest enrichment DEGs between newborn and aging goats in ovarian cells by GSVA. C A heatmap was visualized based on the highest enrichment DEGs between young and aging goats in ovarian cells by the GSVA. D and E The histogram showing the biological process terms from GSVA in ovarian granulosa cells. and G The trends of biological terms were obtained by GSEA in newborn, young, and aging ovarian granulosa cells
Fig. 3
Fig. 3
scRNA-seq reveals the fate of GCs during aging. A The differentiation potential of ovarian cells was visualized by CytoTRACE analysis. The differentiation capacity from less to more is indicated by a gradient colour from red to blue. B Scatterplot showing the differential trajectories of GCs in newborn, young and aging goats with a pseudotime scale by Monocle analysis. C The developmental trajectory of GCs was shown by RNA velocity analyses. Arrows indicate the development direction of GCs. D The phase of the cell cycle was visualized in newborn, young and aging goats by using t-SNE. The proportion of GCs that were shown in each phase of the cell cycle
Fig. 4
Fig. 4
Pseudotime trajectory analysis delineated the temporal dynamics of GCs during ovarian aging. A Pseudotime heatmap showing dynamic gene expression profiles during GC fate commitment. The four gene sets were determined by k-means clustering according to their expression patterns. The expression level of dynamic genes from high to low is indicated by a colour gradient from red to blue. B The top 5 enriched GO terms for each gene set are shown based on the dynamic genes of GCs. The corresponding clusters' GO terms are represented in the same colour. C Visualization of expression trends of the signature genes over pseudotime in GCs. D Expression of AMH in GCs. The colour indicates the level of expression. E Immunostaining of follicles for AMH. Three different ovaries were immunostained in each age group. Scale bars are 20 μm. F Scatterplot showing the differential trajectories of three GCs subtypes over pseudotime by Monocle. Arrows indicate that the mural GC developed into atretic and antral GCs. State refers to the fact that during the development and differentiation of GCs, different genomes are expressed (some genes are activated, while others are silenced). Branch points refer to the changes in gene expression/the emergence of new cell types during the process of cell development and differentiation
Fig. 5
Fig. 5
Transcriptional regulatory networks of GCs during ovarian aging. A A heatmap visualized the significant regulons by SCENIC analysis in ovarian cells. The score of regulation from high to low is indicated by a colour gradient from red to blue. The number in parentheses indicates the number of target genes regulated by this transcription factor. B A heatmap showing different TFs in ovarian cell types by t-test. Red indicates a larger t-value, and blue indicates a smaller t-value. C Violin plot showing feature TF expression in ovarian cells. D t-SNE plots showing the expression of TFs in GCs. The colour indicates the level of expression. E A heatmap demonstrating different TFs in newborn, young and aging goats by t-test. F Violin plot showing expression of SOX4, FOXO1 and HIF1A in GC subtypes from newborn, young and aging goats. G Regulatory network visualizing potential key TFs in downstream target genes. The dot size represents the regulatory weight of TFs

References

    1. Rimon-Dahari N, Yerushalmi-Heinemann L, Alyagor L, Dekel N. Ovarian folliculogenesis. Results Probl Cell Differ. 2016;58:167–190. doi: 10.1007/978-3-319-31973-5_7. - DOI - PubMed
    1. Conti M, Hsieh M, Zamah AM, Oh JS. Novel signaling mechanisms in the ovary during oocyte maturation and ovulation. Mol Cell Endocrinol. 2012;356(1–2):65–73. doi: 10.1016/j.mce.2011.11.002. - DOI - PMC - PubMed
    1. Dunlop CE, Anderson RA. The regulation and assessment of follicular growth. Scand J Clin Lab Invest Suppl. 2014;244:13–17. doi: 10.3109/00365513.2014.936674. - DOI - PubMed
    1. Perheentupa A, Huhtaniemi I. Aging of the human ovary and testis. Mol Cell Endocrinol. 2009;299(1):2–13. doi: 10.1016/j.mce.2008.11.004. - DOI - PubMed
    1. Sánchez F, Smitz J. Molecular control of oogenesis. Biochim Biophys Acta. 2012;1822(12):1896–1912. doi: 10.1016/j.bbadis.2012.05.013. - DOI - PubMed