. 2024 Feb 7;32(2):457-468.
doi: 10.1016/j.ymthe.2023.11.028. Epub 2023 Dec 5.

Soluble CTLA-4 attenuates T cell activation and modulates anti-tumor immunity

Affiliations

Soluble CTLA-4 attenuates T cell activation and modulates anti-tumor immunity

Paul T Kennedy et al. Mol Ther. .

Abstract

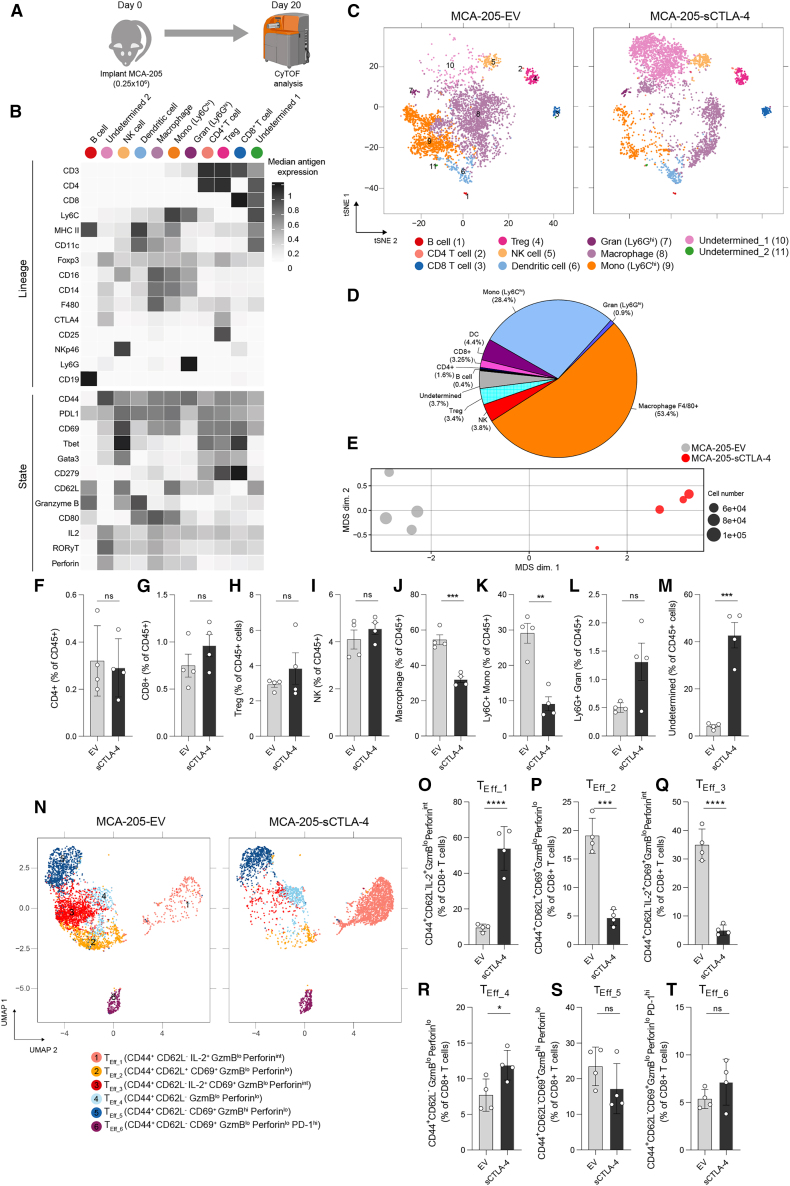
CTLA-4 is a crucial immune checkpoint receptor involved in the maintenance of immune homeostasis, tolerance, and tumor control. Antibodies targeting CTLA-4 have been promising treatments for numerous cancers, but the mechanistic basis of their anti-tumoral immune-boosting effects is poorly understood. Although the ctla4 gene also encodes an alternatively spliced soluble variant (sCTLA-4), preclinical/clinical evaluation of anti-CTLA-4-based immunotherapies have not considered the contribution of this isoform. Here, we explore the functional properties of sCTLA-4 and evaluate the efficacy of isoform-specific anti-sCTLA-4 antibody targeting in a murine cancer model. We show that expression of sCTLA-4 by tumor cells suppresses CD8+ T cells in vitro and accelerates growth and experimental metastasis of murine tumors in vivo. These effects were accompanied by modification of the immune infiltrate, notably restraining CD8+ T cells in a non-cytotoxic state. sCTLA-4 blockade with isoform-specific antibody reversed this restraint, enhancing intratumoral CD8+ T cell activation and cytolytic potential, correlating with therapeutic efficacy and tumor control. This previously unappreciated role of sCTLA-4 suggests that the biology and function of multi-gene products of immune checkpoint receptors need to be fully elucidated for improved mechanistic understanding of cancer immunotherapies.

Keywords: cancer; immune checkpoint; immune regulation; immunomodulation; immunotherapy; soluble CTLA-4.


Conflict of interest statement

Declaration of interests F.J.W. and L.N.D. are inventors on a patent (US8697845 B2) covering the use of the anti-sCTLA-4 monoclonal antibody as a therapeutic.

Figures

None
Graphical abstract
Figure 1
Figure 1
sCTLA-4 suppresses T cell activation and tumor cell killing in vitro (A) Alternative splicing of CTLA-4 gives rise to a soluble form of CTLA-4. Soluble CTLA-4 (sCTLA-4) retains the B7 binding domain encoded by exon 2 of membrane CTLA-4 but is missing the transmembrane domain encoded by exon 3. A reading frameshift during splicing gives rise to an alternative amino acid sequence encoded by exon 4. Both isoforms contain exon 1, which encodes a leader peptide. (B) Vector design for stable overexpression of recombinant sCTLA-4 in HeLa cervical adenocarcinoma cells. (C) Immunoblot showing transfected HeLa cells (HeLa-sCTLA-4 versus empty vector [EV]) under reducing conditions. (D) Alignment of human CTLA-4 and sCTLA-4 coding sequences. The membrane-proximal cysteine residue present in the transmembrane domain of membrane-bound CTLA-4 is highlighted in red. Although the transmembrane domain is absent in sCTLA-4, the C terminus in sCTLA-4 encodes another cysteine residue, highlighted in yellow. (E) Supernatant from HeLa-sCTLA-4 cells was immunoblotted under non-reducing and reducing conditions (−/+ βME). (F and G) Flow-cytometric analysis of CFSE-stained PBMCs stimulated with anti-CD3 following co-culture with HeLa-sCTLA-4 or EV HeLa cells (1:10 Hela-PBMC ratio). Histograms indicate CD8+ T cell proliferation after 4 days of stimulation. Data represent three independent PBMC donors (∗p < 0.05 Student’s t test). (H and I) Flow-cytometric analysis of CFSE-stained stimulated PBMCs in transwell co-cultures with HeLa cells. Histograms indicate CD8+ T cell proliferation after 4 days. Data represent five independent PBMC donors (∗p < 0.05, Student’s t test). (J) Splenocyte-BMDM co-cultures following stimulation with PMA/ionomycin and treatment with recombinant CTLA-4-Fc or sCTLA-4-conditioned medium (scale bar, 50 μm), representative of n = 3. (K) Flow-cytometric analysis of CD8+ T cells from (H); histograms indicate CD8+ T cell proliferation after 4 days. (L and M) T cell-mediated tumor cell-killing assay of HeLa-sCTLA-4 cells. Images show crystal violet-stained viable HeLa cells following co-culture with anti-CD3 activated PBMCs. Data represent three independent PBMC donors (∗p < 0.05, Student’s t test).
Figure 2
Figure 2
sCTLA-4 promotes syngeneic tumor growth in vivo (A) Immunoblot showing stable sCTLA-4 overexpression in B16F10 melanoma cells. In vitro (B) and in vivo (C) growth curves of B16-EV versus B16-sCTLA-4 cells. In vivo tumor growth data are mean ± SEM, n = 6 mice per group (∗∗∗p < 0.001, two-way ANOVA). Representative photographs of tumors in each group are shown (scale bar, 50 mm; n = 6). (D) Experimental lung metastasis of mice inoculated intravenously with B16-EV or B16-sCTLA-4 tumors. Lung tumor nodule frequency and size was measured using stereomicroscopy followed by H&E staining on day 26, with representative samples shown (scale bar, 1 mm). Quantification data are mean ± SD, n = 6 mice per group (∗∗p < 0.01, two-tailed Student’s t test). (E) Immunoblot showing sCTLA-4 in cell-culture supernatant from MCA-205-EV versus MCA-205-sCTLA-4 cells. (F and G) In vivo growth of MCA-205 tumors in (F) immunocompetent and (G) immunocompromised NSG mice, n = 7 mice per group (∗∗p < 0.01, two-way ANOVA). (H) Representative immunohistochemistry staining of MCA-205 tumors from (F) with anti-HA (scale bar, 0.5 mm). Data are representative of at least two independent experiments.
Figure 3
Figure 3
sCTLA-4 inhibits intratumoral T cell activation and differentiation (A) Experimental design for mass-cytometric profiling of MCA-205 tumors on day 20 post inoculation. (B) Heatmap showing the median marker intensity of the 15 lineage markers used for FlowSOM clustering of tumor infiltrates, in addition to functional state marker expression in each cluster. (C) t-SNE analysis of the MCA-205 infiltrates. Twenty-five FlowSOM-identified metaclusters were manually merged according to lineage marker expression. Cells were proportionally combined from EV and sCTLA-4 expressing MCA-205 tumors (n = 7 mice per group) to create the t-SNE plot (1,000 cells per plot for visualization). (D) Relative proportion of each FlowSOM-derived metacluster within MCA-205-EV tumors. (E) Multi-dimensional scaling (MDS) analysis of median antigen expression in MCA-205 tumors; dot size corresponds to the total live CD45+ cells obtained for each sample. (F–M) Comparison of the proportion of the indicated cell populations within tumor infiltrates. (N) Uniform manifold approximation and projection (UMAP) of CD8+ T cell subsets. CD8+ T cells identified in (B) were reclustered on functional state marker expression. The six clusters identified by FlowSOM were manually annotated as: TEff_1 (CD44+ CD62L IL-2+ granzyme Blo perforinint); TEff_2 (CD44+ CD62L+ CD69+ granzyme Blo perforinlo); TEff_3 (CD44+ CD62L IL-2+ CD69+ granzyme Blo perforinint); TEff_4 (CD44+ CD62L granzyme Blo perforinlo); TEff_5 (CD44+ CD62L CD69+ granzyme Bhi perforinlo); and TEff_6 (CD44+ CD62L CD69+ granzyme Blo perforinlo PD-1hi). (O–T) Quantification of CD8+ T cell subset frequency. Data in (F)–(M) and (O)–(T) are expressed as mean ± SD; n = 4 mice per group. Statistical significance was calculated using two-tailed Student’s t test (∗∗∗p < 0.0001; ∗∗∗p < 0.001; ∗p < 0.05; ns [not significant], p > 0.05). Data are representative of two independent experiments. GzmB, granzyme B.
Figure 4
Figure 4
sCTLA-4 blockade promotes T cell cytotoxic function and attenuates murine tumor growth in vivo (A) Schematic showing study design and schedule for the treatment of mice bearing MC38 tumors. (B) In vivo growth of tumors treated according to (A). Data are mean ± SEM, n = 16–18 mice per group, from three independent experiments (∗∗p < 0.01, two-way ANOVA). (C) Proportions of major tumor-infiltrating leukocyte populations within control MC38, expressed as percentage of CD45+ cells. (D) t-SNE analysis of immune infiltrates isolated from MC38 tumors in (B) at day 28. Cell lineage markers were used for FlowSOM-based metaclustering of CD45+ cells. Twenty-five FlowSOM-identified metaclusters were manually merged according to lineage marker expression. Clustering was performed on all cells from both treatment groups (n = 4–6 mice per group), with 1,000 cells visualized in t-SNE plots. (E–N) Comparison of proportions of the indicated cell populations between anti-sCTLA-4- or isotype control-treated tumors. (O) UMAP of CD8+ T cell subsets. CD8+ cells identified in (D) were reclustered using functional state marker expression. Five clusters identified by FlowSOM were manually annotated as: TEff_1 (CD44+ CD62L+ granzyme Blo perforinlo); TEff_2 (CD44+ CD62L granzyme Blo perforinint); TEff_3 (CD44- CD62L granzyme Blo perforinlo); TEff_4 (CD44+ CD62L CD69+ granzyme Bhi perforinhi); and TEff_5 (CD44+ CD62L CD69+ granzyme Blo perforinlo PD-1hi). Shifts in CD8 functionality following treatment are visualized by cell density scaling on the CD8+ T cell subset UMAP. (P–T) Quantification of CD8+ T cell subset frequency in treated tumors. Data in (E)–(N) and (P)–(T) are expressed as mean ± SD; n = 4–5 in each group. Statistical significance was calculated using two-tailed Student’s t test (∗∗p < 0.01; ∗p < 0.05; ns [not significant], p > 0.05). Data are representative of two independent experiments. GzmB, granzyme B.

References

    1. Hodi F.S., O'Day S.J., McDermott D.F., Weber R.W., Sosman J.A., Haanen J.B., Gonzalez R., Robert C., Schadendorf D., Hassel J.C., et al. Improved survival with ipilimumab in patients with metastatic melanoma. N. Engl. J. Med. 2010;363:711–723. - PMC - PubMed
    1. Sharma A., Subudhi S.K., Blando J., Scutti J., Vence L., Wargo J., Allison J.P., Ribas A., Sharma P. Anti-CTLA-4 Immunotherapy Does Not Deplete FOXP3(+) Regulatory T Cells (Tregs) in Human Cancers. Clin. Cancer Res. 2019;25:1233–1238. - PMC - PubMed
    1. Walker L.S.K., Sansom D.M. Confusing signals: recent progress in CTLA-4 biology. Trends Immunol. 2015;36:63–70. - PMC - PubMed
    1. Schneider H., Downey J., Smith A., Zinselmeyer B.H., Rush C., Brewer J.M., Wei B., Hogg N., Garside P., Rudd C.E. Reversal of the TCR stop signal by CTLA-4. Science. 2006;313:1972–1975. - PubMed
    1. Krummel M.F., Allison J.P. CD28 and CTLA-4 have opposing effects on the response of T cells to stimulation. J. Exp. Med. 1995;182:459–465. - PMC - PubMed