. 2023 Nov 23;10(12):292-295.
doi: 10.15698/mic2023.12.810. eCollection 2023 Dec 4.

Extracellular DNA secreted in yeast cultures is metabolism-specific and inhibits cell proliferation

Affiliations

Extracellular DNA secreted in yeast cultures is metabolism-specific and inhibits cell proliferation

Elisabetta de Alteriis et al. Microb Cell. .

Abstract

Extracellular DNA (exDNA) can be actively released by living cells and different putative functions have been attributed to it. Further, homologous exDNA has been reported to exert species-specific inhibitory effects on several organisms. Here, we demonstrate by different experimental evidence, including 1H-NMR metabolomic fingerprint, that the growth rate decline in Saccharomyces cerevisiae fed-batch cultures is determined by the accumulation of exDNA in the medium. Sequencing of such secreted exDNA represents a portion of the entire genome, showing a great similarity with extrachromosomal circular DNA (eccDNA) already reported inside yeast cells. The recovered DNA molecules were mostly single strands and specifically associated to the yeast metabolism displayed during cell growth. Flow cytometric analysis showed that the observed growth inhibition by exDNA corresponded to an arrest in the S phase of the cell cycle. These unprecedented findings open a new scenario on the functional role of exDNA produced by living cells.

Keywords: 1H NMR; cell cycle; eccDNA; exDNA; metabolomics; self-DNA.


Conflict of interest statement

Conflict of Interest: SM, EdA, GI, FC, MLC, PT, GB, VL, following the discovery of self-DNA inhibition in plants and other organisms, founded the Noself srl company, owner of the patent WO2014020624A9. The patent includes a method for improving the production of microorganisms in bioreactors by removal of DNA inhibition from the culture medium. During the period of development of this research, the PhD grant of EP at the Zoological Station of Naples A. Dohrn has been co-financed by Noself srl. All the other authors have no competing interests.

Figures

Figure 1
Figure 1. FIGURE 1: Fed-batch cultures of S. cerevisiae CEN.PK2-1C carried out with either exponential (EFC) or limited (LFC) nutrient feeding and associated 1H NMR metabolomic profiles.
(A) Dynamic trends of yeast biomass and ethanol in the medium. Dashed vertical lines separate the batch and the feeding phases. Dark and light grey areas indicate the occurrence of either fermentative or respiratory metabolism, respectively. (B) 1H NMR metabolomic fingerprinting profiles of growth media, collected at different times between 8 and 30 h of the feeding phases. (C) Pearson's correlation of 1H NMR integrated signals of the growth media and yeast growth rates, along 30 h of the feeding phases, in conditions of either unlimited or limited nutrient availability, EFC and LFC, respectively. Labels indicate 1H NMR signals associated to nutrients and DNA constituents. Asterisks refer to signals diagnostic for nitrogen bases (see text for details). Red and dark grey respectively correspond to significance levels at p< 0.001 and p< 0.05. In EFC the significant negative correlations correspond to signals associated to DNA, whereas the positive correlations refer to signals associated to different nutrients. Instead, in LFC, many negative correlations still include the same DNA related signals, but also those signals linked to the limited nutrients.
Figure 2
Figure 2. FIGURE 2: ExDNA accumulates in the medium and produces an inhibitory effect on yeast growth.
(A) Quantification of single and double stranded exDNA in EFC and LFC media, during the feeding phases. (B) Stacked bars represent the amounts of single (white) and double (black) stranded exDNA purified from the exhausted medium of EFC, by nine subsequent extractions with HAP. Circles refer to yeast growth in batch cultures with addition of the eluate obtained by each HAP extraction. Cell growth was determined by A590 and expressed as percentage of the control. A clear reduction of the inhibitory effect of the eluates is observed with a complete recovery of 100% growth after nine HAP treatments. (C) Effects of exhausted media, exDNA purified from EFC and LFC supernatants and heterologous DNA on yeast growth in batch cultures. Growth was determined by A590 after 12 h incubation expressed as percentage of the control. Data refer to mean and standard deviation of 3 replicates. Different letters above bars indicate statistically significant pairwise differences (Tuckey post-hoc test after one-way ANOVA for the effect of treatments on yeast growth). The highest inhibition level is observed for exDNA from EFC medium, whereas no significant inhibitory effect is produced by heterologous DNAs (fish sperm ssDNA, or genomic DNA of C. albicans) and genomic DNA of S.cerevisiae CEN.PK2-1C. A significant recovery of growth was observed when exDNA was pretreated with S1 nuclease, whereas no recovery was found using DNAse.
Figure 3
Figure 3. FIGURE 3: ExDNA sequencing from yeast culture media reveals specific differences associated to active metabolism.
Examples of nucleotide reads mapped to the S288C S. cerevisiae reference genome. Shown are samples of sequenced exDNA collected from media of early respiratory EFC (EFC-6h), late fermentative EFC (EFC), and respiratory LFC (LFC). The reads are aligned on the corresponding parts of genomic regions of different chromosomes: chromosome VII (A, B), chromosome VIII (C), and chromosome XII (D). Blue bars refer to specific sequence features of the mapped regions. Grey histograms represent mapped reads coverage. Coloured boxes indicate individual reads nucleotide mismatches, with respect to the reference genome sequences. Magnification of a portion of chromosomes XII, showing the high degree of mismatch rate, is shown in the inset (D).
Figure 4
Figure 4. FIGURE 4: ExDNA sequences correspond to subsets of eccDNA depending on active metabolism.
Venn diagrams comparing genes found in eccDNA with those occurring in exDNA from different growth media. Genes completely or partially represented in at least one S. cerevisiae eccDNA sample (N=1957) [33], are compared to those occurring in exDNA purified from exhausted media of LFC and either EFC (A) or EFC 6h (B). ExDNA from respiratory LFC and, to a lesser extent EFC 6h, shows higher similarity with eccDNA as compared to the fermentative EFC.
Figure 5
Figure 5. FIGURE 5: Flow cytometric analysis (FCM) of the cell cycle shows an arrest in S phase despite unlimiting nutrient availability.
(A) Dynamic trends of the yeast population in the different cell cycle phases (G1, G0, S, G2/M) during the feeding phase of either unlimiting (EFC) or limiting (LFC) nutrient availability. (B) Representative outputs of the bi-dimensional FCM analyses at different times of the feeding phase of EFC and LFC. In the dot plots of each panel, G0, G1, S, and G2/M cell cycle stages are identified according to both forward scatter signal (FSC-A) and green fluorescence (FL1-A), representing cell size and DNA content per cell, respectively. (C) S phase heterogeneity in the yeast population during the EFC feeding phase. The histograms show the fluorescence (FL1-A) distribution during the S phase of the EFC. Starting from 8 h, a doubling of the population, in terms of fluorescence intensity, is evident, while at the end of the cultivation run a convergence towards only one fluorescence peak is observed. (D) Outputs of the bi-dimensional FCM analyses for a yeast population in a batch exponential and starved culture. (E) Comparison of the percentages of the yeast population in each phase of the cell cycle (G1, G0, S, G2/M) in different culture conditions: batch (exponential), batch (starved), EFC (30 h of feeding), LFC (30 h of feeding).
Figure 6
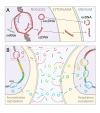
Figure 6. FIGURE 6: Model hypothesis of metabolism specific exDNA production and inhibitory effect in yeast cultures.
(A) Production of single stranded DNA (ssDNA) fragments in the nucleus, with eccDNA formation, their moving through the cytoplasm, and release into the medium (exDNA). (B) The ssDNA production is associated to open transcription regions, so fragments that accumulate in the medium present specific sequences associated to the active metabolism. Respiratory cells produce a larger variety of exDNA compared to fermentative cells, whereas fragments from common regions of the genome, such as ribosomal DNA, are equally produced by all cells, irrespectively of their displayed metabolism. The inhibitory effect of exDNA is higher when cells are exposed to specific exDNA sequences corresponding to the active regions of the genome.

References

    1. Ascher J, Ceccherini MT, Pantani OL, Agnelli A, Borgogni F, Guerri G, Nannipieri P, Pietramellara G. Sequential extraction and genetic fingerprinting of a forest soil metagenome. Appl Soil Ecol. 2009;42(2):176–181. doi: 10.1016/j.apsoil.2009.03.005. - DOI
    1. Nagler M, Podmirseg SM, Griffith GW, Insam H, Ascher-Jenull J. The use of extracellular DNA as a proxy for specific microbial activity. Appl Microbiol Biotechnol. 2018;102(6):2885–2898. doi: 10.1007/s00253-018-8786-y. - DOI - PMC - PubMed
    1. Torti A, Lever MA, Jørgensen BB. Origin, dynamics, and implications of extracellular DNA pools in marine sediments. Mar Genomics. 2015;24:185–196. doi: 10.1016/j.margen.2015.08.007. - DOI - PubMed
    1. Monticolo F, Palomba E, Termolino P, Chiaiese P, de Alteriis E, Mazzoleni S, Chiusano ML. The Role of DNA in the Extracellular Environment: A Focus on NETs, RETs and Biofilms. Front Plant Sci. 2020;11:589837. doi: 10.3389/fpls.2020.589837. - DOI - PMC - PubMed
    1. Yang K, Wang L, Cao X, Gu Z, Zhao G, Ran M, Yan Y, Yan J, Xu L, Gao C, Yang M. The Origin, Function, Distribution, Quantification, and Research Advances of Extracellular DNA. Int J Mol Sci. 2022;23(22):13690. doi: 10.3390/ijms232213690. - DOI - PMC - PubMed

LinkOut - more resources