. 2023 Nov 20:15:1271008.
doi: 10.3389/fnagi.2023.1271008. eCollection 2023.

Age-related upregulation of perineuronal nets on inferior collicular cells that project to the cochlear nucleus

Affiliations

Age-related upregulation of perineuronal nets on inferior collicular cells that project to the cochlear nucleus

Laila S Almassri et al. Front Aging Neurosci. .

Abstract

Introduction: Disruptions to the balance of excitation and inhibition in the inferior colliculus (IC) occur during aging and underlie various aspects of hearing loss. Specifically, the age-related alteration to GABAergic neurotransmission in the IC likely contributes to the poorer temporal precision characteristic of presbycusis. Perineuronal nets (PNs), a specialized form of the extracellular matrix, maintain excitatory/inhibitory synaptic environments and reduce structural plasticity. We sought to determine whether PNs increasingly surround cell populations in the aged IC that comprise excitatory descending projections to the cochlear nucleus.

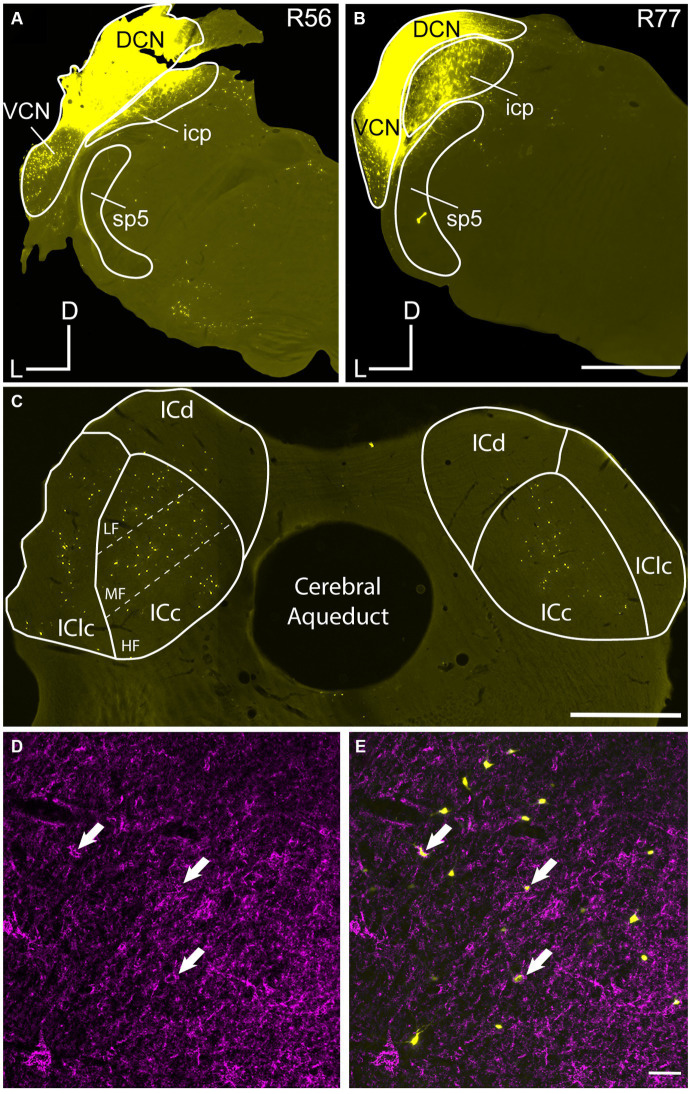
Method: We combined Wisteria floribunda agglutinin (WFA) staining for PNs with retrograde tract-tracing in three age groups of Fischer Brown Norway (FBN) rats.

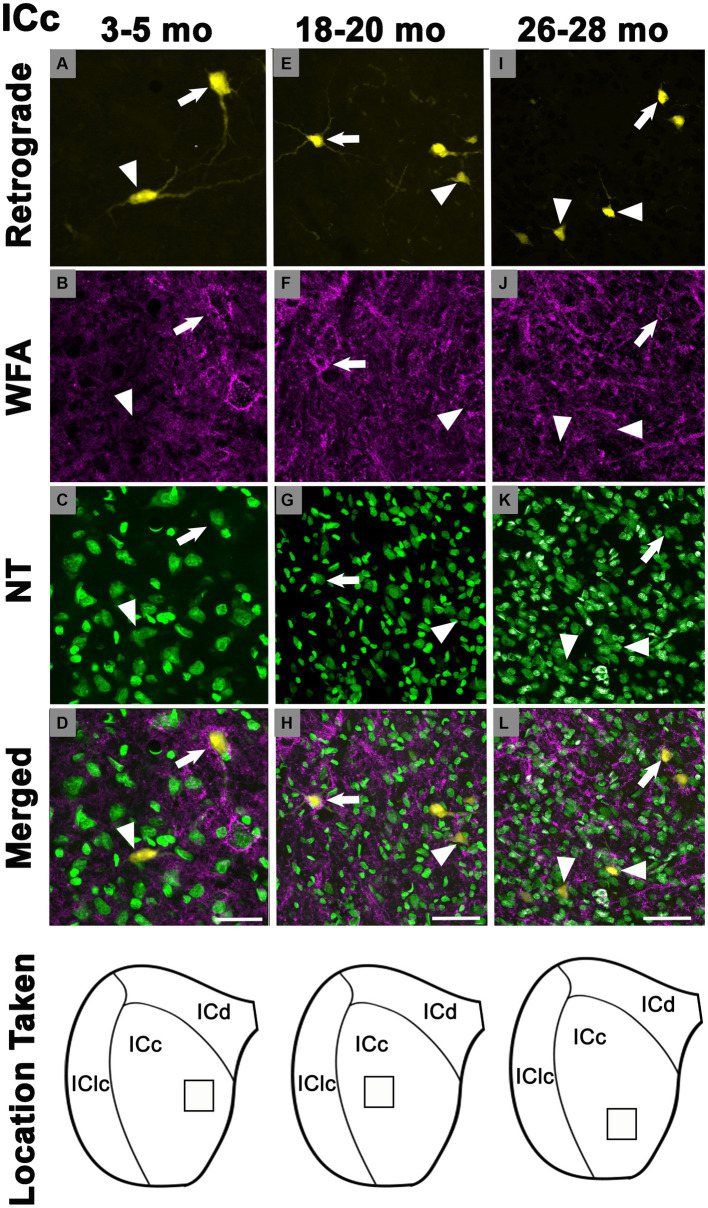
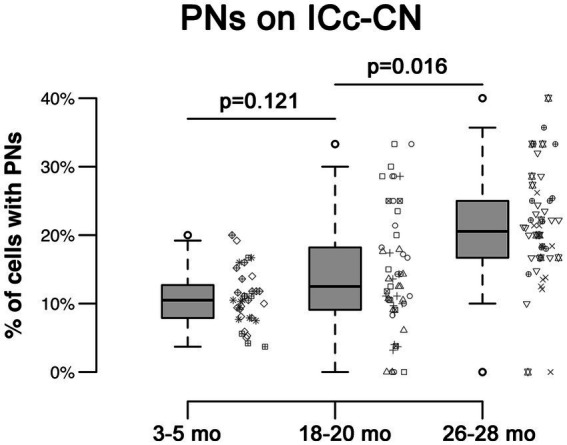
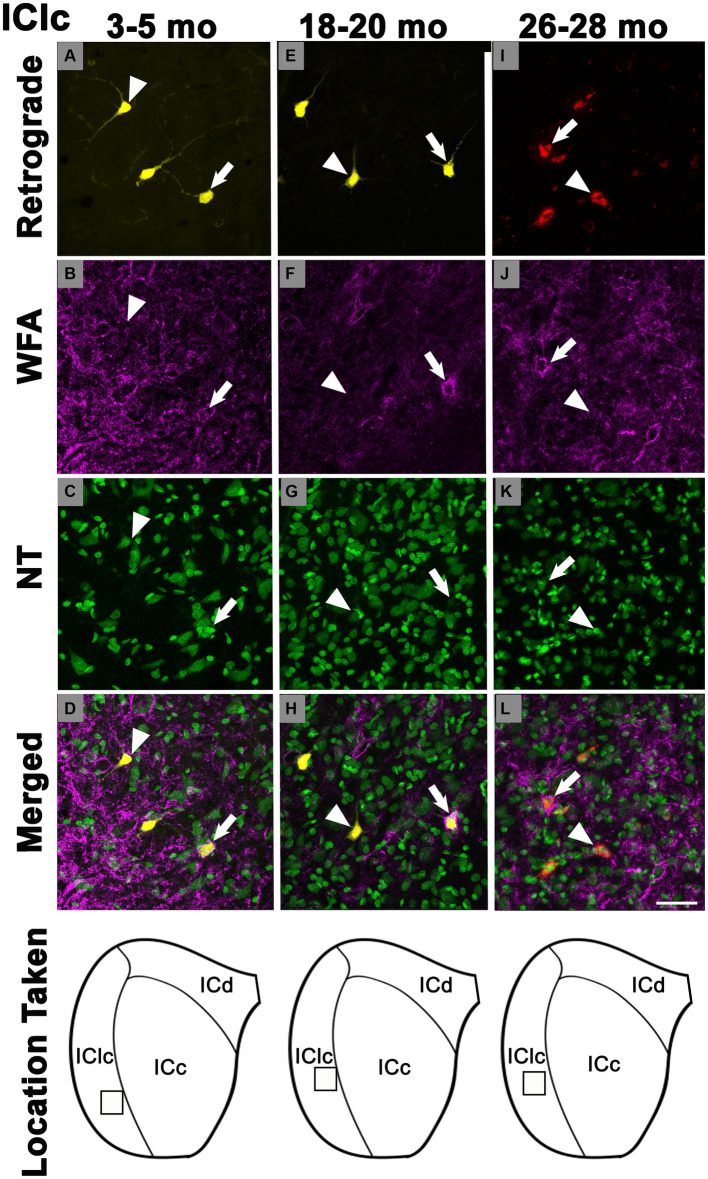
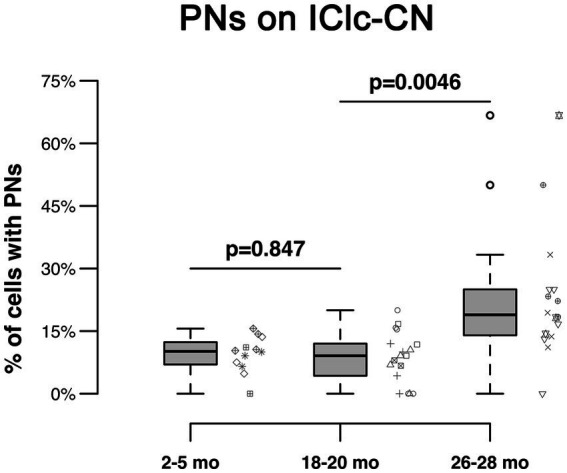
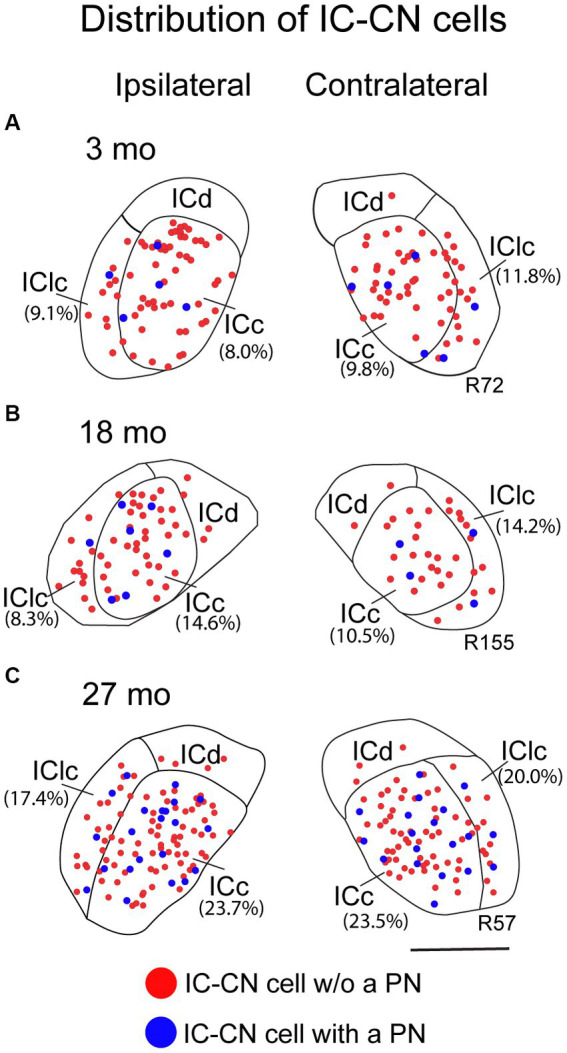
Results: The data demonstrate that the percentage of IC-CN cells with a PN doubles from ~10% at young age to ~20% at old age. This was true in both lemniscal and non-lemniscal IC.

Discussion: Furthermore, the increase of PNs occurred on IC cells that make both ipsilateral and contralateral descending projections to the CN. These results indicate that reduced structural plasticity in the elderly IC-CN pathway, affecting excitatory/inhibitory balance and, potentially, may lead to reduced temporal precision associated with presbycusis.

Keywords: Wisteria floribunda agglutinin; aging; cochlear nucleus (CN); inferior colliculus; perineuronal nets.


Conflict of interest statement

The authors declare that the research was conducted in the absence of any commercial or financial relationships that could be construed as a potential conflict of interest.

Figures

Figure 1
Figure 1
Injection sites of retrograde tracers deposited in the cochlear nucleus (CN). Photomicrographs show representative young and old cases with large deposits of FluoroGold (FG) in the CN. (A) Deposits of FG in the left CN of a 5 month old FBN rat (R56). (B) Deposit of FG in the left CN of a 27 month old FBN rat (R77). (C) Low mag view of retrogradely labeled cells across the ipsilateral (left) and contralateral (right) IC as a result of the deposit made in (A). Dashed lines represent the dorsolateral to ventromedial axis subdivided into low frequency (LF), middle frequency (MF) and high frequency (HF) regions across the ICc. (D,E) PNs in the ipsilateral ICc from (B). Arrows point to three PNs that surround cells labeled with FG. DCN, dorsal cochlear nucleus; ICc, central nucleus of the IC; ICd, dorsal cortex of the IC; IClc, lateral cortex of the IC; icp, inferior cerebellar peduncle; sp5, spinal trigeminal tract; VCN, ventral cochlear nucleus; D, dorsal; L, lateral; M, medial. Scale bars: A–C = 1 mm; D,E = 50 μm.
Figure 2
Figure 2
Structured illumination fluorescence images, taken at 0.5 μm steps, showing cells in the central inferior colliculus that project to the cochlear nucleus with (arrows) or without (arrowheads) a PN across three ages. In the first row, cells retrogradely-labeled with FluoroGold shown in yellow. PNs are shown in magenta or cyan in the second row. NeuroTrace is shown in green in the third row. The fourth row shows the merged image of the retrograde, WFA, and NeuroTrace. Each column represents the ICc across a single age group. (A–D) Photomicrographs (presented at a higher magnification than E-L to better demonstrate the dendritic filling with FluoroGold) of a 3 month old ICc. Case R74. (E–H) Photomicrographs of an 18 month old ICc. Case R161. (I–L) Photomicrographs of 27 month old ICc. Case R77. The last row shows a schematic with a square demonstrating where in the ICc the photomicrographs were taken. Scale bars: D = 20 μm; H&L = 50 μm.
Figure 3
Figure 3
Box plots summarizing the percentage of ICc-CN cells surrounded by a PN across three age groups. Pairwise differences demonstrated a significant, increase between the 18–20 month and 26–28 month age groups (*p = 0.016). Pairwise differences demonstrated no significant differences between the 3–5 month and 18–20 month age groups (p = 0.121). Unique symbols to the right of each box plot represent the individual cases. In each box plot, dark lines represent the median of the distribution, boxes extend across the interquartile range, and whiskers extend to ±150% of the interquartile range. Circles indicate outliers beyond this range.
Figure 4
Figure 4
Structured illumination fluorescence images, taken at 0.5 μm steps, showing cells in the lateral cortex of the inferior colliculus that project to the cochlear nucleus with (arrows) or without (arrowheads) a PN across three ages. In the first row, cells retrogradely-labeled with FluoroGold or FluoroRuby are shown in yellow and red, respectively. PNs are shown in magenta in the second row. NeuroTrace is shown in green in the third row. The fourth row shows the merged image of the retrograde, WFA, and NeuroTrace. Each column represents the ICc across a single age group. (A–D) Photomicrographs of a 3 month old ICc. Case R72. (E–H) Photomicrographs of an 18 month old ICc. Case R160. (I–L) Photomicrographs of 27 month old ICc. Case R57. The last row shows a schematic with a square demonstrating where in the IClc the photomicrographs were taken. Scale bar = 50 μm.
Figure 5
Figure 5
Box plots summarizing the percentage of IClc-CN cells surrounded by a PN across three age groups. Pairwise differences demonstrated a significant, increase between the 18–20 month and 26–28 month age groups (*p = 0.0046). Pairwise differences demonstrated no significant differences between the 3–5 month and 18–20 month age groups (p = 0.847). Unique symbols to the right of each box plot represent the individual cases. In each box plot, dark lines represent the median of the distribution, boxes extend across the interquartile range, and whiskers extend to ±150% of the interquartile range. Circles indicate outliers beyond this range.
Figure 6
Figure 6
Plots showing the distribution of ipsilateral and contralateral IC-CN cells that have a PN (blue circles) and do not have a PN (red circle). (A) Plots of IC-CN cells with and without a PN resultant from a FluoroRuby deposit at 3 months of age; R72. (B) Plots of IC-CN cells with and without a PN resultant from a FluoroGold deposit at 18 months of age; R155. (C) Plots of IC-CN cells with and without a PN resultant from a FluoroGold deposit at 27 months of age; R57. Each symbol represents one IC-CN cell. Percentage of IC-CN cells with a PN for the individual sections are shown in parentheses. Plotted sections were chosen between interaural levels 0.12–0.48 mm; Paxinos and Watson, 1998. Transverse sections at a mid-rostrocaudal level of the IC. Scale bar = 1 mm.

Similar articles

Cited by

References

    1. Adams I. (1987). Comparison of synaptic changes in the precentral and postcentral cerebral cortex of aging humans: a quantitative ultrastructural study. Neurobiol. Aging 8, 203–212. doi: 10.1016/0197-4580(87)90003-0 - DOI - PubMed
    1. Ajmo J. M., Eakin A. K., Hamel M. G., Gottschall P. E. (2008). Discordant localization of WFA reactivity and brevican/ADAMTS-derived fragment in rodent brain. BMC Neurosci. 9:14. doi: 10.1186/1471-2202-9-14, PMID: - DOI - PMC - PubMed
    1. Ali A. B., Islam A., Constanti A. (2023). The fate of interneurons, GABAA receptor sub-types and perineuronal nets in Alzheimer's disease. Brain Pathol. 33:e13129. doi: 10.1111/bpa.13129, PMID: - DOI - PMC - PubMed
    1. Alibardi L. (2002). Putative inhibitory collicular boutons contact large neurons and their dendrites in the dorsal cochlear nucleus of the rat. J. Submicrosc. Cytol. Pathol. 34, 433–446. PMID: - PubMed
    1. Andersen R. A., Roth G. L., Aitkin L. M., Merzenich M. M. (1980). The efferent projections of the central nucleus and the pericentral nucleus of the inferior colliculus in the cat. J. Comp. Neurol. 194, 649–662. doi: 10.1002/cne.901940311, PMID: - DOI - PubMed

LinkOut - more resources