Comment
. 2023 Dec;131(12):127002.
doi: 10.1289/EHP12597. Epub 2023 Dec 6.

Associations of Prenatal Per- and Polyfluoroalkyl Substance (PFAS) Exposures with Offspring Adiposity and Body Composition at 16-20 Years of Age: Project Viva

Affiliations
Comment

Associations of Prenatal Per- and Polyfluoroalkyl Substance (PFAS) Exposures with Offspring Adiposity and Body Composition at 16-20 Years of Age: Project Viva

Mingyu Zhang et al. Environ Health Perspect. 2023 Dec.

Abstract

Background: Findings on the associations between prenatal PFAS exposures and offspring adiposity are inconsistent. Whether such associations may extend to adolescence is especially understudied.

Objectives: We investigated associations of prenatal PFAS exposures with offspring adiposity and body composition at 16-20 years of age.

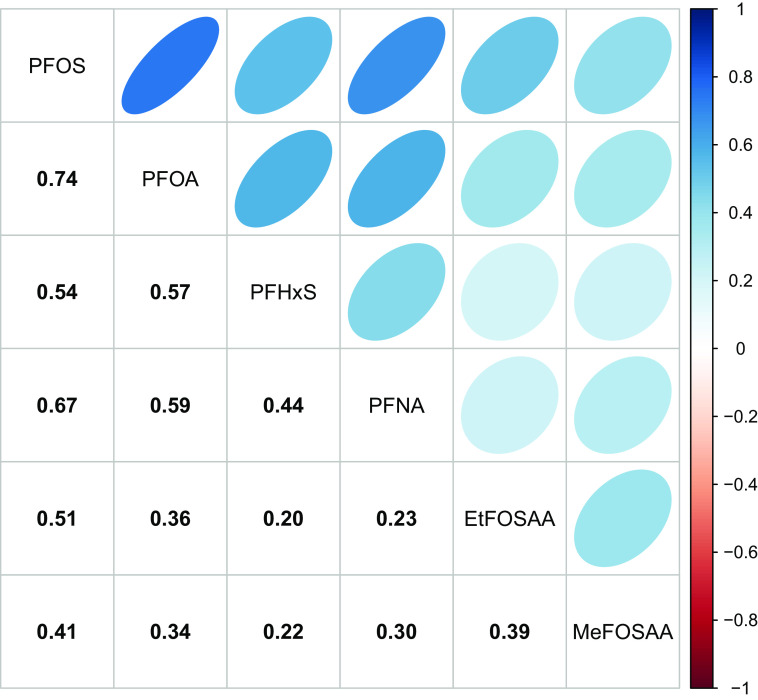
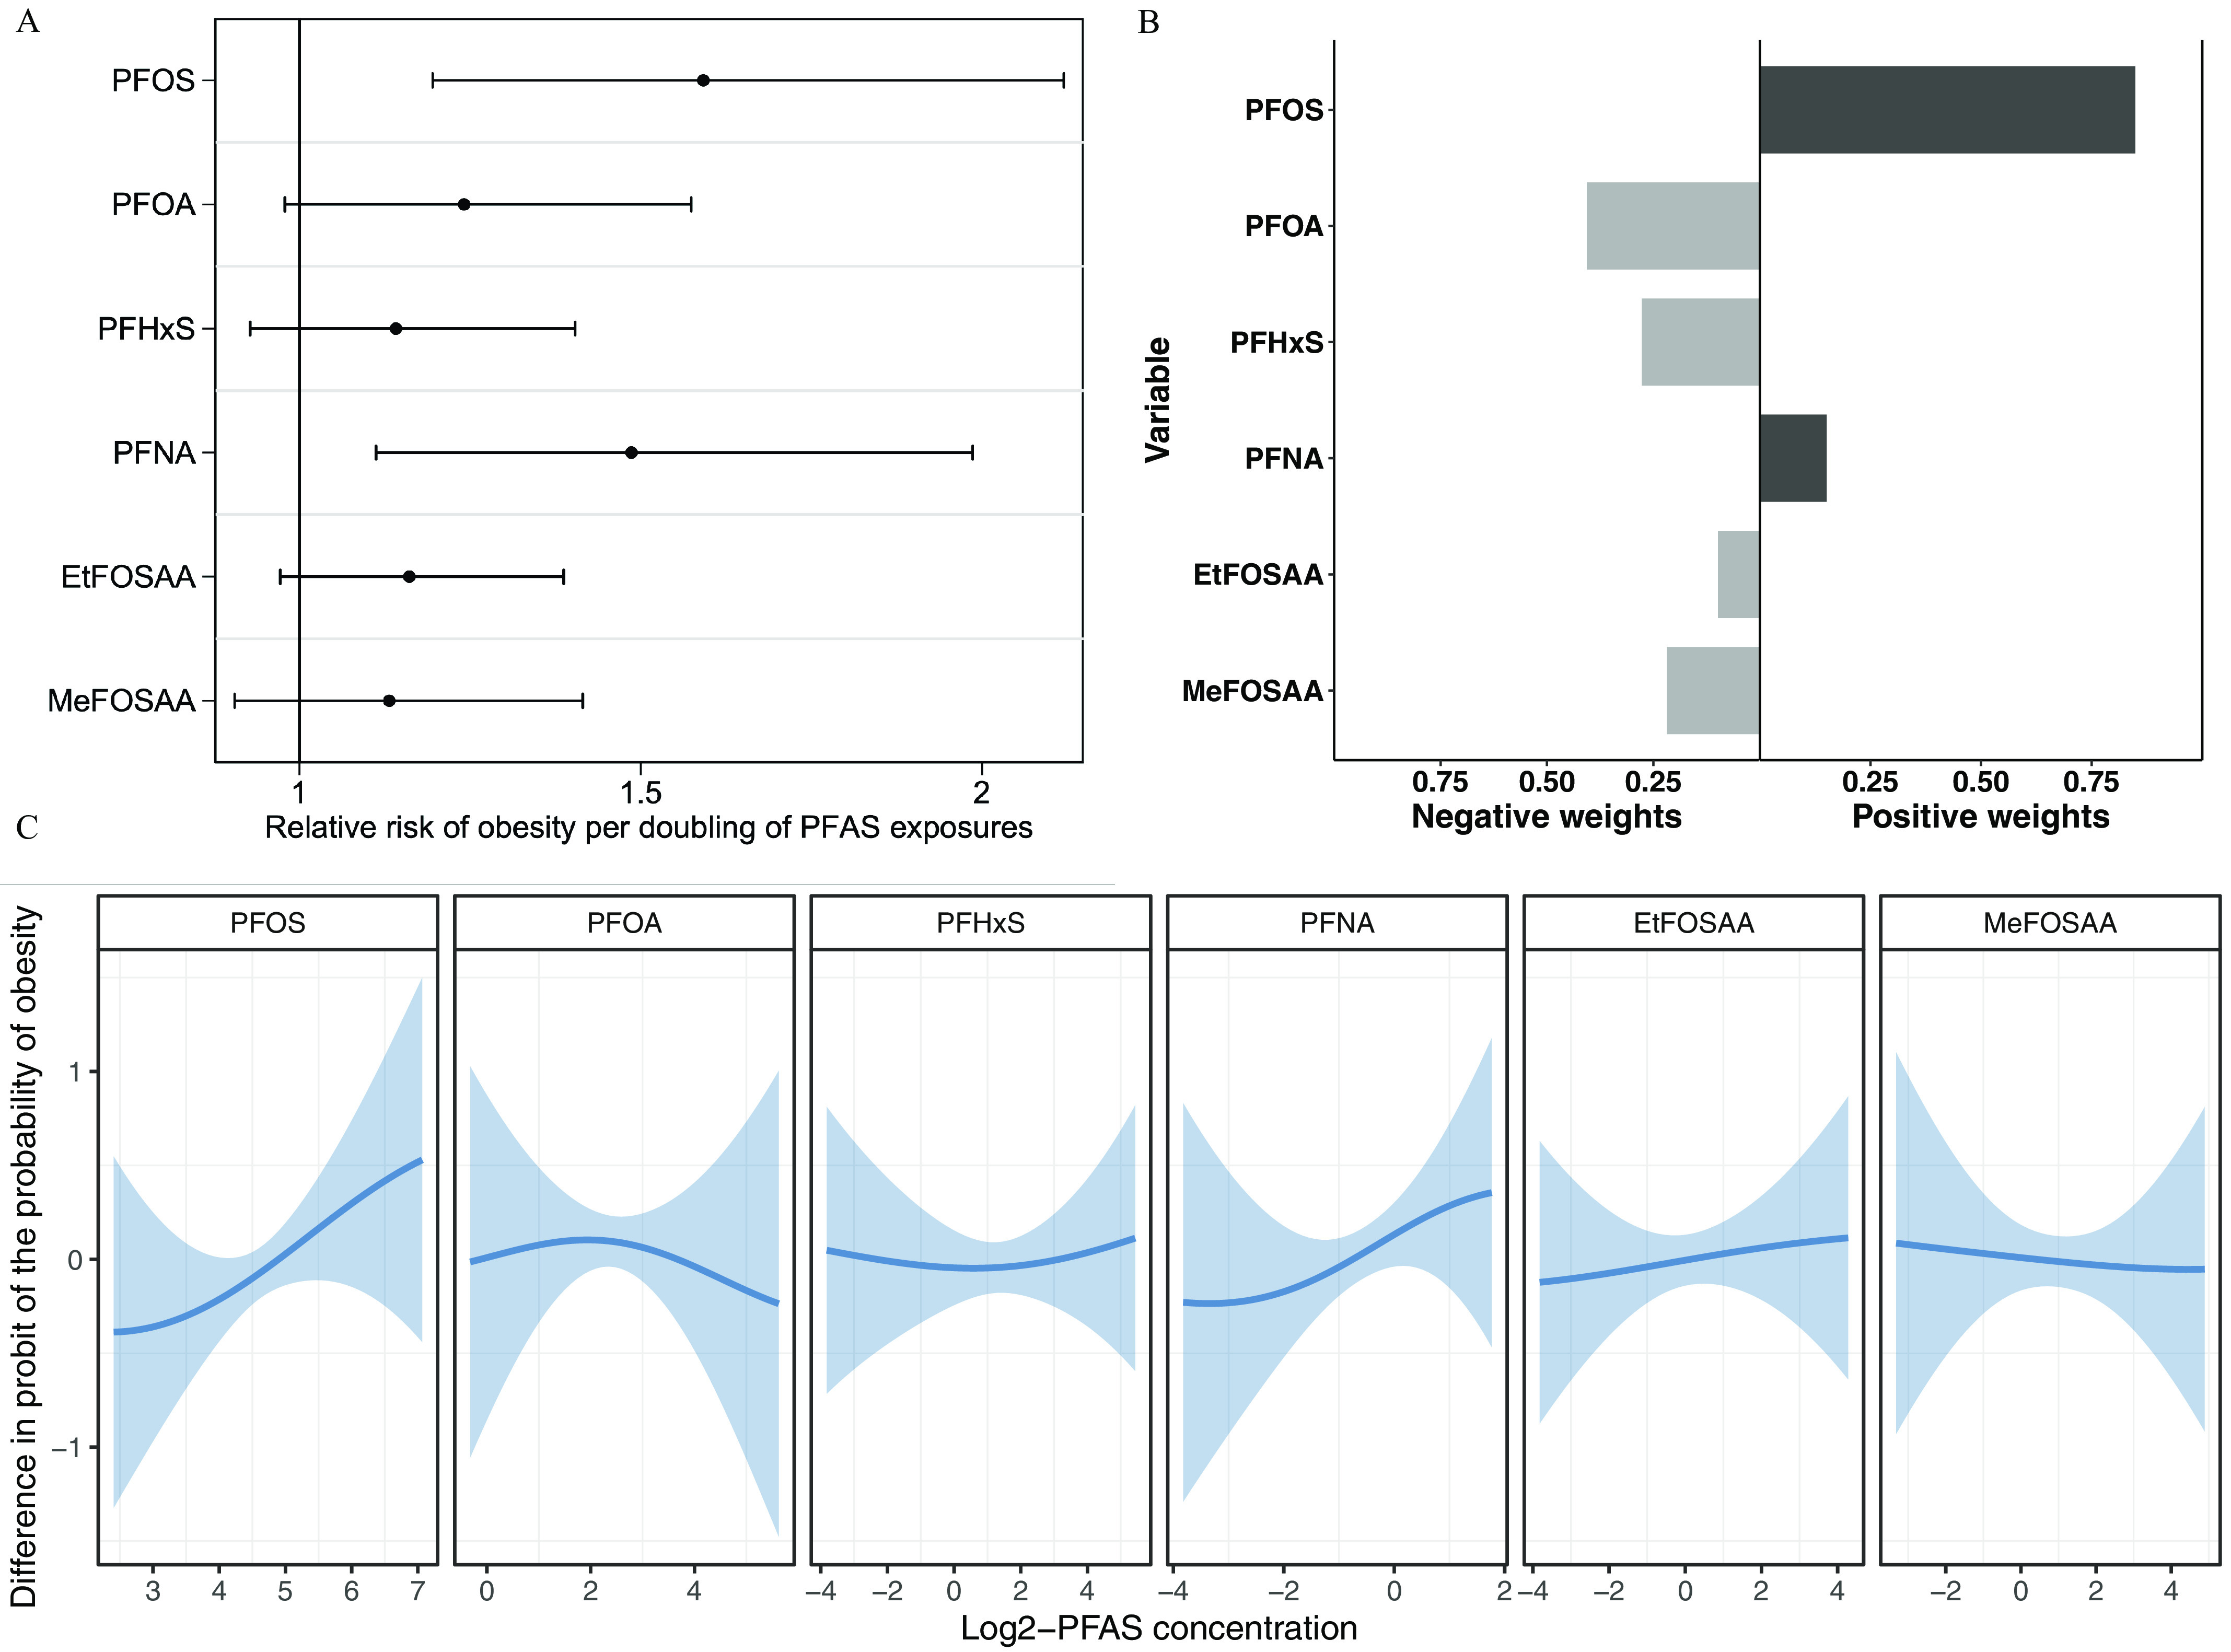
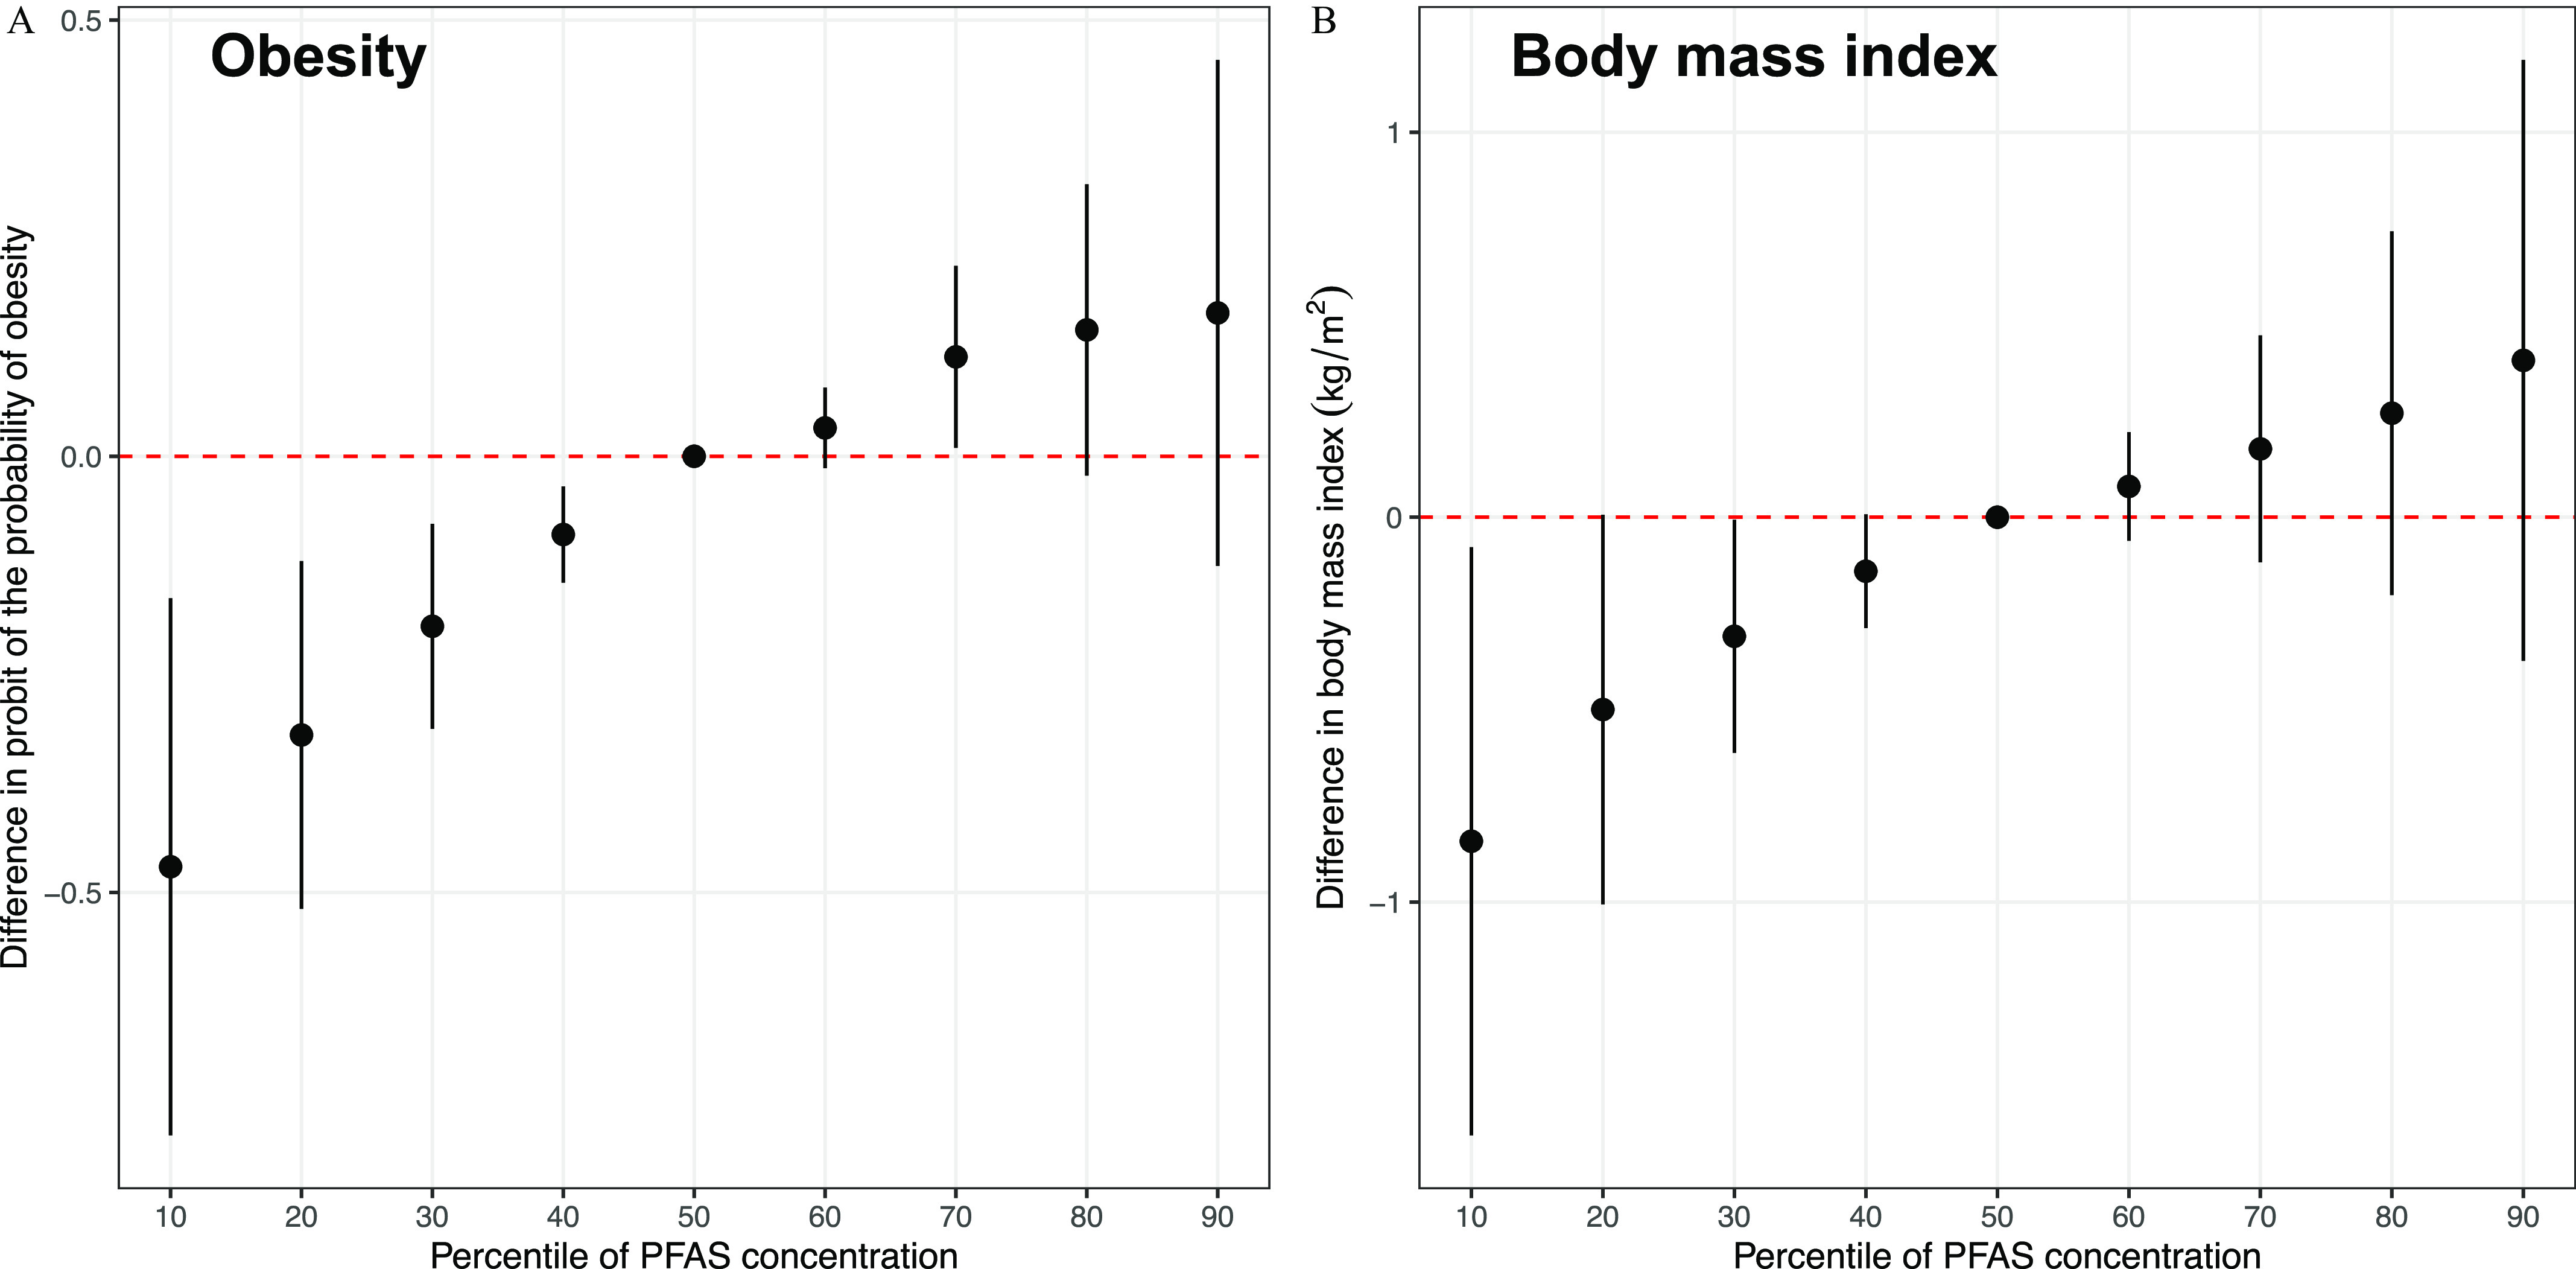
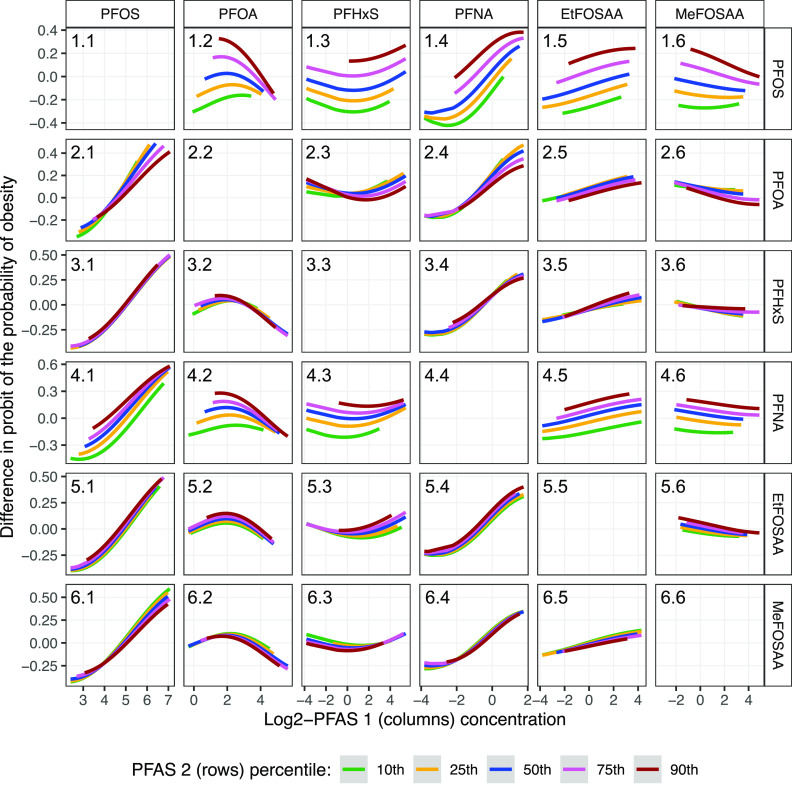
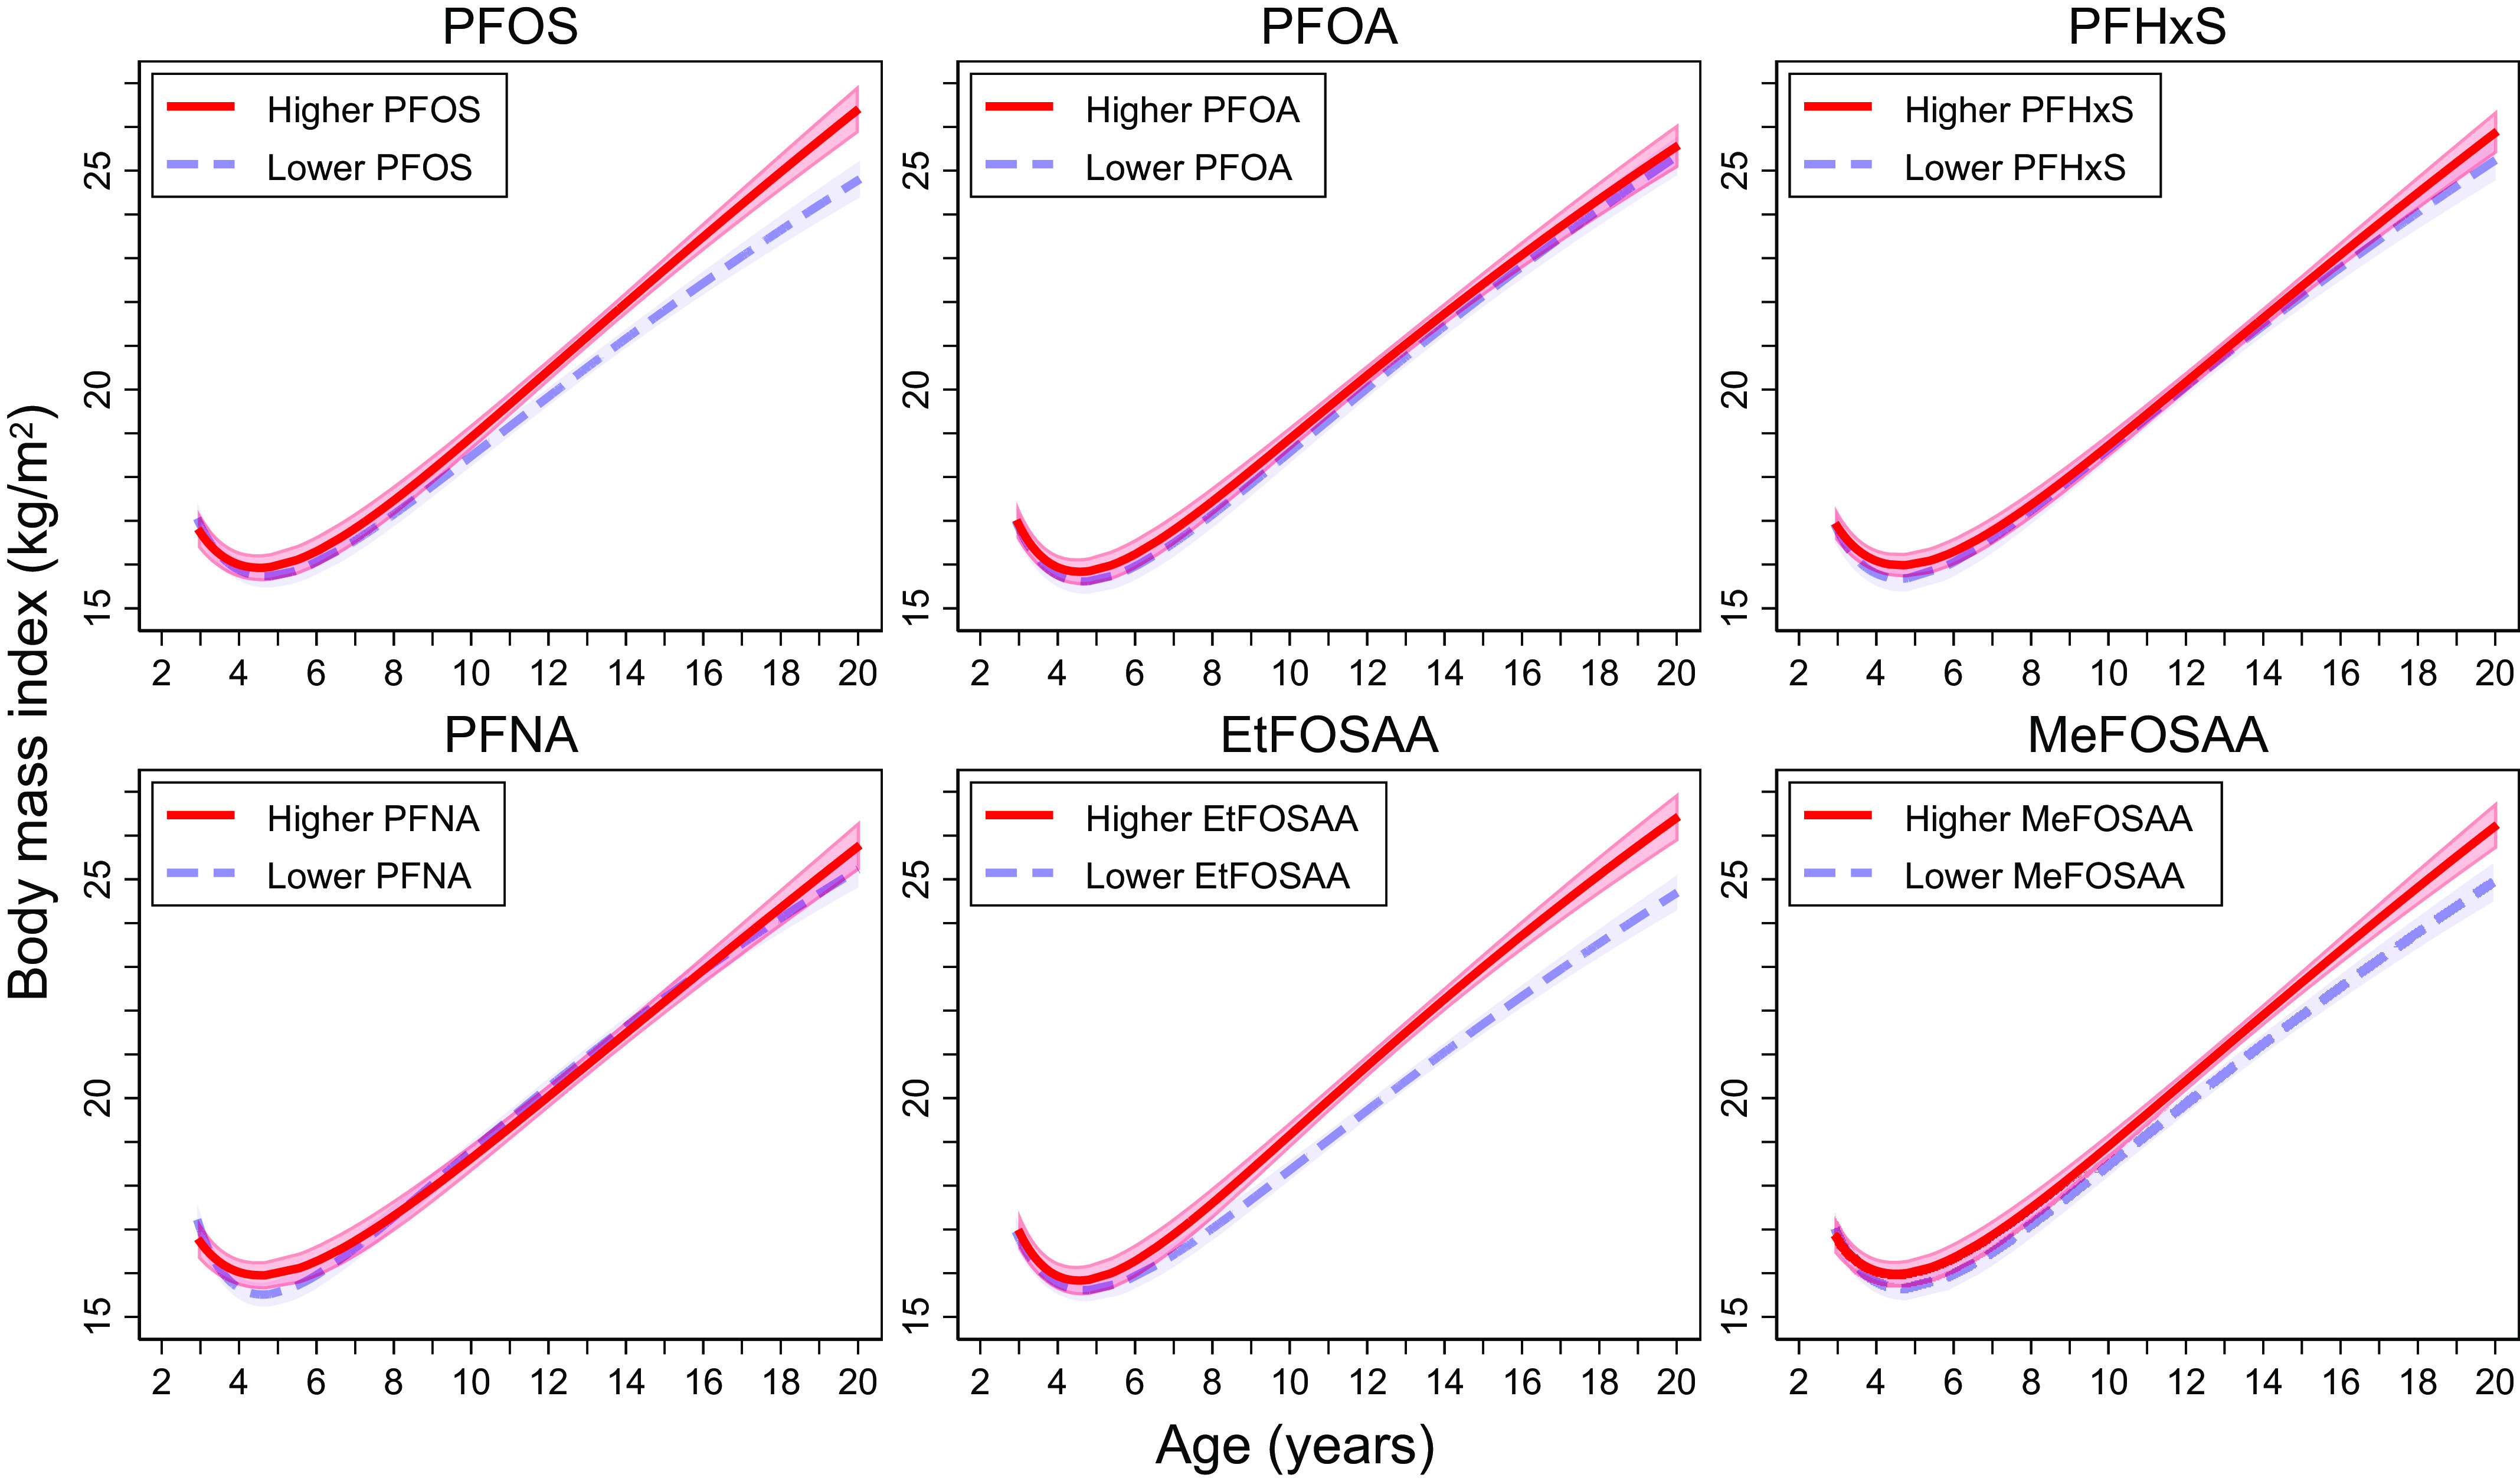
Methods: We studied 545 mother-child pairs in the prospective prebirth cohort Project Viva (Boston, Massachusetts). We measured six PFAS (PFOA, PFOS, PFNA, PFHxS, EtFOSAA, and MeFOSAA) in maternal early pregnancy (median age=9.6wk, range: 5.7-19.6 wk) plasma samples. At the late adolescence visit (median age=17.4 y, range: 15.9-20.0 y), we obtained anthropometric measures and assessed body composition using bioelectrical impedance analysis and dual-energy X-ray absorptiometry. We examined associations of individual PFAS with obesity [i.e., age- and sex-specific body mass index (BMI) 95th percentile] and adiposity and body composition using multivariable Poisson and linear regression models, respectively. We assessed PFAS mixture effects using Bayesian kernel machine regression (BKMR) and quantile g-computation. We used fractional-polynomial models to assess BMI trajectories (at 3-20 years of age) by prenatal PFAS levels.

Results: Thirteen percent (n=73) of the children had obesity in late adolescence. After multivariable adjustment, higher prenatal PFAS concentrations were associated with higher obesity risk [e.g., 1.59 (95% CI: 1.19, 2.12), 1.24 (95% CI: 0.98, 1.57), and 1.49 (95% CI: 1.11, 1.99) times the obesity risk per doubling of PFOS, PFOA, and PFNA, respectively]. BKMR showed an interaction between PFOA and PFOS, where the positive association between PFOS and obesity was stronger when PFOA levels were lower. Each quartile increment of the PFAS mixture was associated with 1.52 (95% CI: 1.03, 2.25) times the obesity risk and 0.52 (95% CI: -0.02, 1.06) kg/m2 higher BMI. Children with higher prenatal PFOS, EtFOSAA, and MeFOSAA concentrations had higher rates of BMI increase starting from 9-11 years of age.

Discussion: Prenatal PFAS exposures may have obesogenic effects into late adolescence. https://doi.org/10.1289/EHP12597.


Figures

Figure 1 is a Spearman correlation matrix, plotting maternal plasma samples, including 2-(N-methyl-perfluorooctane sulfonamido) acetate, 2-(N-ethyl-perfluorooctane sulfonamido) acetate, perfluorononanoate, perfluorohexane sulfonate, perfluorooctanoate, perfluorooctane sulfonate (y-axis) across color intensity, ranging from negative 1 to 1 in increments of 0.2 (x-axis).
Figure 1.
Spearman correlation matrix for PFAS measured in maternal plasma samples collected in early pregnancy (n=545). Color intensity is proportional to the correlation coefficients. Samples were collected between April 1999 and July 2002. PFAS concentrations below the LOD (provided in Table 1) were imputed using the LOD divided by the square root of 2. Note: EtFOSAA, 2-(N-ethyl-perfluorooctane sulfonamido) acetate; LOD, limit of detection; MeFOSAA, 2-(N-methyl-perfluorooctane sulfonamido) acetate; PFAS, per- and polyfluoroalkyl substances; PFHxS, perfluorohexane sulfonate; PFNA, perfluorononanoate; PFOA, perfluorooctanoate; PFOS, perfluorooctane sulfonate.
Figure 2A is a dot and whisker plot, plotting 2-(N-methyl-perfluorooctane sulfonamido) acetate, 2-(N-ethyl-perfluorooctane sulfonamido) acetate, perfluorononanoate, perfluorohexane sulfonate, perfluorooctanoate, perfluorooctane sulfonate (y-axis) across relative risk of obesity per doubling of per- and polyfluoroalkyl substances exposures, ranging from 1 to 1.5 in increments of 1.5 and 1.5 to 2 in increments of 0.5 (x-axis). Figure 2B is a horizontal bar graph, plotting 2-(N-methyl-perfluorooctane sulfonamido) acetate, 2-(N-ethyl-perfluorooctane sulfonamido) acetate, perfluorononanoate, perfluorohexane sulfonate, perfluorooctanoate, perfluorooctane sulfonate (y-axis) across negative weights, ranging from 0.75 to 0.25 in decrements of 0.25 and positive weights, ranging from 0.25 to 0.75 in increments of 0.25 (x-axis). Figure 2C is a set of six ribbon plus line graphs titled perfluorooctane sulfonate, perfluorooctanoate, perfluorohexane sulfonate, perfluorononanoate, 2-(N-ethyl-perfluorooctane sulfonamido) acetate, and 2-(N-methyl-perfluorooctane sulfonamido) acetate, plotting Difference in probit of the probability of obesity, ranging from negative 1 to 1 in unit increment (y-axis) across Log 2− per- and polyfluoroalkyl substances concentration, ranging from 3 to 7 in unit increments, 0 to 4 in increments of 2, negative 4 to 4 in increments of 2, negative 4 to 2 in increments of 2, and negative 4 to 4 in increments of 2, and negative 2 to 4 in increments of 2 (x-axis), respectively.
Figure 2.
Multivariable-adjusted associations between individual prenatal PFAS and obesity in late adolescence estimated using (A) Poisson regression with robust variance estimates, (B) quantile g-computation, and (C) Bayesian kernel machine regression (n=545). (A) shows the relative risks and 95% confidence intervals of obesity per doubling of individual PFAS levels [estimates are provided in Table 3 (adjusted)]. (B) shows the weights for each PFAS that correspond to the proportion of the overall effect of all PFAS on obesity in the positive or negative direction (positive and negative weights, respectively, add up to 1, representing the proportion of the overall effect and the relative importance of each mixture component within each direction; the shading of bars represents the overall effect size within each direction, with darker shades indicating a larger effect compared with lighter shades; estimates are provided in Table S8). (C) shows the estimates and 95% credible intervals of PFAS with obesity risk when all other PFAS are fixed at their 50th percentile (percentile values for log2-transformed PFAS levels are provided in Table S2). Obesity was defined as BMI95th percentile for age and sex based on the Centers for Disease Control and Prevention Growth Charts (reference is BMI<95th percentile). Participants were from the Project Viva prebirth cohort. Pregnant women were enrolled between April 1999 and July 2002, and the late adolescence visit was conducted between July 2017 and September 2021. Models were adjusted for maternal age at enrollment, race and ethnicity, prepregnancy BMI, educational level, marital status, parity, and pregnancy smoking status. Note: BMI, body mass index; EtFOSAA, 2-(N-ethyl-perfluorooctane sulfonamido) acetate; MeFOSAA, 2-(N-methyl-perfluorooctane sulfonamido) acetate; PFAS, per- and polyfluoroalkyl substances; PFHxS, perfluorohexane sulfonate; PFNA, perfluorononanoate; PFOA, perfluorooctanoate; PFOS, perfluorooctane sulfonate.
Figures 3A and 3B are dot and whisker plots titled Obesity and Body mass index, plotting Difference in probit of the probability of obesity, ranging from negative 0.5 to 0.5 in increments of 0.5 and Difference in body mass index (kilograms per meter squared), ranging negative 1 to 1 in unit increments (y-axis) across Percentile of per- and polyfluoroalkyl substances concentration, 10 to 90 in increments of 10 (x-axis), respectively.
Figure 3.
Overall effects (estimates and 95% credible intervals) of prenatal PFAS mixtures estimated by the differences in (A) probit of the probability of obesity and (B) BMI (kg/m2) in late adolescence when all PFAS are in their 10th to 90th percentile (with an interval of 10 percentile) as compared with when they are in their 50th percentile estimated using Bayesian kernel machine regression (n=545). Percentile values for log2-transformed PFAS levels are provided in Table S2. Estimates are provided in Table S6. Obesity was defined as BMI95th percentile for age and sex based on the Centers for Disease Control and Prevention Growth Charts (reference is BMI<95th percentile). Participants were from the Project Viva prebirth cohort. Pregnant women were enrolled between April 1999 and July 2002, and the late adolescence visit was conducted between July 2017 and September 2021. Models were adjusted for maternal age at enrollment, race/ethnicity, prepregnancy BMI, educational level, marital status, parity, and pregnancy smoking status. Note: BMI, body mass index; PFAS, per- and polyfluoroalkyl substances.
Figure 4 is a set of thirty-six line graphs. On the first row, the six graphs are titled perfluorooctane sulfonate, perfluorooctanoate, perfluorohexane sulfonate, perfluorononanoate, 2-(N-ethyl-perfluorooctane sulfonamido) acetate, and 2-(N-methyl-perfluorooctane sulfonamido) acetate, plotting Difference in probit of the probability of obesity, ranging from negative 0.4 to 0.4 in increments of 0.2 (left y-axis) and perfluorooctane sulfonate (right y-axis) across log 2-2− per- and polyfluoroalkyl substances 1 (columns) concentration, ranging from 3 to 7 in unit increments, 0 to 4 in increments of 2, negative 4 to 4 in increments of 2, negative 4 to 2 in increments of 2, negative 4 to 4 in increments of 2, and negative 2 to 4 in increments of 2 (x-axis) for 2− per- and polyfluoroalkyl substances 2 (rows) percentile, ranging as tenth, twenty-fifth, fiftieth, seventy-fifth, and ninetieth, respectively. On the second row, the six graphs are titled perfluorooctane sulfonate, perfluorooctanoate, perfluorohexane sulfonate, perfluorononanoate, 2-(N-ethyl-perfluorooctane sulfonamido) acetate, and 2-(N-methyl-perfluorooctane sulfonamido) acetate, plotting Difference in probit of the probability of obesity, ranging from negative 0.2 to 0.4 in increments of 0.2 (left y-axis) and perfluorooctanoate (right y-axis) across log 2-2− per- and polyfluoroalkyl substances 1 (columns) concentration, ranging from 3 to 7 in unit increments, 0 to 4 in increments of 2, negative 4 to 4 in increments of 2, negative 4 to 2 in increments of 2, negative 4 to 4 in increments of 2, and negative 2 to 4 in increments of 2 (x-axis) for 2− per- and polyfluoroalkyl substances 2 (rows) percentile, ranging as tenth, twenty-fifth, fiftieth, seventy-fifth, and ninetieth, respectively. On the third row, the six graphs are titled perfluorooctane sulfonate, perfluorooctanoate, perfluorohexane sulfonate, perfluorononanoate, 2-(N-ethyl-perfluorooctane sulfonamido) acetate, and 2-(N-methyl-perfluorooctane sulfonamido) acetate, plotting Difference in probit of the probability of obesity, ranging from negative 0.25 to 0.50 in increments of 0.25 (left y-axis) and perfluorohexane sulfonate (right y-axis) across log 2-2− per- and polyfluoroalkyl substances 1 (columns) concentration, ranging from 3 to 7 in unit increments, 0 to 4 in increments of 2, negative 4 to 4 in increments of 2, negative 4 to 2 in increments of 2, negative 4 to 4 in increments of 2, and negative 2 to 4 in increments of 2 (x-axis) for 2− per- and polyfluoroalkyl substances 2 (rows) percentile, ranging as tenth, twenty-fifth, fiftieth, seventy-fifth, and ninetieth, respectively. On the forth row, the six graphs are titled perfluorooctane sulfonate, perfluorooctanoate, perfluorohexane sulfonate, perfluorononanoate, 2-(N-ethyl-perfluorooctane sulfonamido) acetate, and 2-(N-methyl-perfluorooctane sulfonamido) acetate, plotting Difference in probit of the probability of obesity, ranging from negative 0.3 to 0.6 in increments of 0.3 (left y-axis) and perfluorononanoate (right y-axis) across log 2-2− per- and polyfluoroalkyl substances 1 (columns) concentration, ranging from 3 to 7 in unit increments, 0 to 4 in increments of 2, negative 4 to 4 in increments of 2, negative 4 to 2 in increments of 2, negative 4 to 4 in increments of 2, and negative 2 to 4 in increments of 2 (x-axis) for 2− per- and polyfluoroalkyl substances 2 (rows) percentile, ranging as tenth, twenty-fifth, fiftieth, seventy-fifth, and ninetieth, respectively. On the fifth row, the six graphs are titled perfluorooctane sulfonate, perfluorooctanoate, perfluorohexane sulfonate, perfluorononanoate, 2-(N-ethyl-perfluorooctane sulfonamido) acetate, and 2-(N-methyl-perfluorooctane sulfonamido) acetate, plotting Difference in probit of the probability of obesity, ranging from negative 0.25 to 0.50 in increments of 0.25 (left y-axis) and 2-(N-ethyl-perfluorooctane sulfonamido) acetate (right y-axis) across log 2-2− per- and polyfluoroalkyl substances 1 (columns) concentration, ranging from 3 to 7 in unit increments, 0 to 4 in increments of 2, negative 4 to 4 in increments of 2, negative 4 to 2 in increments of 2, negative 4 to 4 in increments of 2, and negative 2 to 4 in increments of 2 (x-axis) for 2− per- and polyfluoroalkyl substances 2 (rows) percentile, ranging as tenth, twenty-fifth, fiftieth, seventy-fifth, and ninetieth, respectively. On the sixth row, the six graphs are titled perfluorooctane sulfonate, perfluorooctanoate, perfluorohexane sulfonate, perfluorononanoate, 2-(N-ethyl-perfluorooctane sulfonamido) acetate, and 2-(N-methyl-perfluorooctane sulfonamido) acetate, plotting Difference in probit of the probability of obesity, ranging from negative 0.25 to 0.50 in increments of 0.25 (left y-axis) and 2-(N-methyl-perfluorooctane sulfonamido) acetate (right y-axis) across log 2-2− per- and polyfluoroalkyl substances 1 (columns) concentration, ranging from 3 to 7 in unit increments, 0 to 4 in increments of 2, negative 4 to 4 in increments of 2, negative 4 to 2 in increments of 2, negative 4 to 4 in increments of 2, and negative 2 to 4 in increments of 2 (x-axis) for 2− per- and polyfluoroalkyl substances 2 (rows) percentile, ranging as tenth, twenty-fifth, fiftieth, seventy-fifth, and ninetieth, respectively.
Figure 4.
Associations (estimates) between prenatal PFAS 1 concentrations (columns) and obesity risk (defined as BMI95th percentile for age and sex; reference is BMI<95th percentile) in late adolescence by levels (10th, 25th, 50th, 75th, and 90th percentiles) of prenatal PFAS 2 concentration (rows) when all other PFAS are fixed at their 50th percentile estimated using Bayesian kernel machine regression (n=545). Percentile values for log2-transformed PFAS levels are provided in Table S2. Estimates are provided in Excel Table S1. Participants were from the Project Viva prebirth cohort. Pregnant women were enrolled between April 1999 and July 2002, and the late adolescence visit was conducted between July 2017 and September 2021. Models were adjusted for maternal age at enrollment, race and ethnicity, prepregnancy BMI, educational level, marital status, parity, pregnancy smoking status. Note: BMI, body mass index; EtFOSAA, 2-(N-ethyl-perfluorooctane sulfonamido) acetate; MeFOSAA, 2-(N-methyl-perfluorooctane sulfonamido) acetate; PFAS, per- and polyfluoroalkyl substances; PFHxS, perfluorohexane sulfonate; PFNA, perfluorononanoate; PFOA, perfluorooctanoate; PFOS, perfluorooctane sulfonate.
Figure 5 is a set of six line graphs titled perfluorooctane sulfonate, perfluorooctanoate, perfluorohexane sulfonate, perfluorononanoate, 2-(N-ethyl-perfluorooctane sulfonamido) acetate, and 2-(N-methyl-perfluorooctane sulfonamido) acetate, plotting body mass index (kilogram per meter squared), ranging from 15 to 25 in increments of 5 (y-axis) across age (years), ranging from 2 to 20 in increments of 2 (x-axis) for higher (perfluorooctane sulfonate, perfluorooctanoate, perfluorohexane sulfonate, perfluorononanoate, 2-(N-ethyl-perfluorooctane sulfonamido) acetate, and 2-(N-methyl-perfluorooctane sulfonamido) acetate) and lower (perfluorooctane sulfonate, perfluorooctanoate, perfluorohexane sulfonate, perfluorononanoate, 2-(N-ethyl-perfluorooctane sulfonamido) acetate, and 2-(N-methyl-perfluorooctane sulfonamido) acetate), respectively.
Figure 5.
Fractional-polynomial prediction plots (estimates and 95% confidence intervals) showing the associations of age and BMI across childhood and adolescence by maternal PFAS levels (n=1,156). “Higher” was defined as PFAS levels above the population median, and “lower” was defined as PFAS levels below the population median. Median levels were 25.70 ng/mL for PFOS, 5.80 ng/mL for PFOA, 2.40 ng/mL for PFHxS, 0.70 ng/mL for PFNA, 1.20 ng/mL for EtFOSAA, and 1.90 ng/mL for MeFOSAA. These levels are slightly different from the ones in Table 1 due to the different analytic sample for the main analysis (n=545) vs. this post hoc analysis (n=1,156). Participants were from the Project Viva prebirth cohort. Pregnant women were enrolled between April 1999 and July 2002, and the late adolescence visit was conducted between July 2017 and September 2021. Note: BMI, body mass index; EtFOSAA, 2-(N-ethyl-perfluorooctane sulfonamido) acetate; MeFOSAA, 2-(N-methyl-perfluorooctane sulfonamido) acetate; PFAS, per- and polyfluoroalkyl substances; PFHxS, perfluorohexane sulfonate; PFNA, perfluorononanoate; PFOA, perfluorooctanoate; PFOS, perfluorooctane sulfonate.

Comment on

References

    1. Buck RC, Franklin J, Berger U, Conder JM, Cousins IT, de Voogt P, et al. . 2011. Perfluoroalkyl and polyfluoroalkyl substances in the environment: terminology, classification, and origins. Integr Environ Assess Manag 7(4):513–541, PMID: , 10.1002/ieam.258. - DOI - PMC - PubMed
    1. Kato K, Wong LY, Jia LT, Kuklenyik Z, Calafat AM. 2011. Trends in exposure to polyfluoroalkyl chemicals in the U.S. population: 1999–2008. Environ Sci Technol 45(19):8037–8045, PMID: , 10.1021/es1043613. - DOI - PubMed
    1. Braun JM. 2017. Early-life exposure to EDCs: role in childhood obesity and neurodevelopment. Nat Rev Endocrinol 13(3):161–173, PMID: , 10.1038/nrendo.2016.186. - DOI - PMC - PubMed
    1. Qi W, Clark JM, Timme-Laragy AR, Park Y. 2020. Per- and polyfluoroalkyl substances and obesity, type 2 diabetes and non-alcoholic fatty liver disease: a review of epidemiologic findings. Toxicol Environ Chem 102(1–4):1–36, PMID: , 10.1080/02772248.2020.1763997. - DOI - PMC - PubMed
    1. Fryar CD, Carroll MD, Afful J. 2020. Prevalence of overweight, obesity, and severe obesity among children and adolescents aged 2–19 years: United States, 1963–1965 through 2017–2018. NCHS Health E-Stats. https://www.cdc.gov/nchs/data/hestat/obesity-child-17-18/obesity-child.htm [accessed 4 November 2022].

Publication types