. 2023 Dec 6;15(725):eadg7020.
doi: 10.1126/scitranslmed.adg7020. Epub 2023 Dec 6.

Intervertebral disc human nucleus pulposus cells associated with back pain trigger neurite outgrowth in vitro and pain behaviors in rats

Affiliations

Intervertebral disc human nucleus pulposus cells associated with back pain trigger neurite outgrowth in vitro and pain behaviors in rats

Wensen Jiang et al. Sci Transl Med. .

Abstract

Low back pain (LBP) is often associated with the degeneration of human intervertebral discs (IVDs). However, the pain-inducing mechanism in degenerating discs remains to be elucidated. Here, we identified a subtype of locally residing human nucleus pulposus cells (NPCs), generated by certain conditions in degenerating discs, that was associated with the onset of discogenic back pain. Single-cell transcriptomic analysis of human tissues showed a strong correlation between a specific cell subtype and the pain condition associated with the human degenerated disc, suggesting that they are pain-triggering. The application of IVD degeneration-associated exogenous stimuli to healthy NPCs in vitro recreated a pain-associated phenotype. These stimulated NPCs activated functional human iPSC-derived sensory neuron responses in an in vitro organ-chip model. Injection of stimulated NPCs into the healthy rat IVD induced local inflammatory responses and increased cold sensitivity and mechanical hypersensitivity. Our findings reveal a previously uncharacterized pain-inducing mechanism mediated by NPCs in degenerating IVDs. These findings could aid in the development of NPC-targeted therapeutic strategies for the clinically unmet need to attenuate discogenic LBP.


Figures
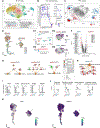
Fig. 1.
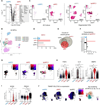
Fig. 1.. The heterogeneity of NPC populations and their transcriptomes in human IVDs is associated with LBP symptoms.
(A) Shown is the integrated single-cell atlas (UMAP) of IVDs from seven donors. (B) Dot plots of gene expression are shown for classical IVD markers labeling major cell types in IVDs (FC, fibro-chondrocyte; IC, immune cell; RBC, red blood cell) and NPC subtype markers labeling NPC1 to NPC7 subtypes. (C) Shown is the same UMAP as in (A) with the cells for clusters NPC1, NPC6, and NPC7 color-coded on the basis of IVD origin (bpNPCs in red and aNPCs in blue). The pie charts illustrate the percent contribution of bpNPCs (red) and aNPCs (blue) to the respective NPC subtype. (D) NPCs were ordered on a pseudo-time developmental trajectory. (E) Shown is the transcriptomic characterization of the NPC1 subcluster in aNPCs and bpNPCs. (E1) UMAP within NPC1; (E2) average expression of NPC1 marker MMP3; and the feature plots showing the MMP3 expression on the UMAP of NPC populations derived from (E3) back pain IVDs or (E4) asymptomatic IVDs. (F) Volcano plot shows the differentially expressed genes in cluster NPC1 of cells derived from back pain IVDs (bpNPC1) versus from asymptomatic IVDs (aNPC1). (G and H) Enriched networks of interest found in (G) bpNPC1 and (H) aNPC7. (I) Bar graphs show the gene expression levels of key regulators. Comparison between cell groups for single-cell data is considered statistically significant when *P < 10−36 for (J). Bar graphs show z scores for the enriched functions of relevant NPC subtypes. (K) Shown is the pseudo-time trajectory for NGF and PRDX1 expression. SPP1, secreted phosphoprotein 1; S100A2, S100 calcium binding protein A2 gene; CILP, cartilage intermediate layer protein gene.
Fig. 2.
Fig. 2.. NPCs exposed to external stressors in vitro expressed inflammatory and degenerative markers.
(A) Shown is the timeline of the in vitro experiments to screen for external stressors. (B) Shown is an illustration of the external stressors used. (C) Bar graphs show the cell viability after exposure to single external stressors, including inflammatory cytokines (IL-1β), low pH, low glucose concentration, and mechanical compression (n = 4) (*P < 0.05, **P < 0.01, ***P < 0.001, and ****P < 0.0001). (D) Heatmap shows the gene expression of inflammatory and degenerative markers after exposure to external stressors (n = 4). The gene expression at different conditions was normalized, with 0 (white) being the lowest expression for this gene and 100 (red) being the highest expression for this gene, such that the expression of one specific gene at all conditions falls into 0 to 100 [*P < 0.05, **P < 0.01, ***P < 0.001, and ****P < 0.0001 compared with control groups; the control groups were 0 ng/ml for IL-1β stressor, pH 6.75 for pH stressor, 3.1 g/ml (glucose) for glucose stressor, and 0% for mechanical compression stressor]. (E) Illustration shows the implementation of combinatory stimuli applied to NPCs. (F) Shown is the relative quantification (RQ) of inflammatory and degenerative markers under combinatory stimuli (n = 6). The nonstimulated NPC (nsNPC) control group was cultured in unmodified medium [pH = 7.80 to 7.84, glucose (3.1 g/ml)], no mechanical compression, or IL-1β addition [*P < 0.05, **P < 0.01, ***P < 0.001, and ****P < 0.0001; not significant (ns) or not labeled, P > 0.05].
Fig. 3.
Fig. 3.. Similarities between the transcriptome of sNPCs and a subtype of NPCs isolated from patients with back pain (bpNPC1).
(A) Shown is a volcano plot of differentially expressed genes in sNPCs as compared with nsNPCs. Fold change plotted against adjusted P value (P adj < 10−36 considered nominally significant). (B) Shown is UMAP combining aNPCs, bpNPCs, sNPCs, and nsNPCs. (C) Shown is expression of NPC1 marker MMP3 projected on UMAP for single cells in nsNPC, sNPC, aNPC, and bpNPC1 groups. (D) Shows cell percent of NPC1 subtype. (E) Shows numbers of shared genes between samples. (F) Shows similarity scores of transcriptomes of samples or subtypes when compared with the bpNPC1. (G) Coexpression of two secondary NPC1 markers, fibroblast growth factor 2 (FGF2) (red) and IL-8 (blue), on UMAP. (H) Shows average expression of FGF2, IL-8, and MMP3 markers and (I) NOS2 and PRDX1 markers in nsNPCs, sNPCs, bpNPC1, and bpNPCs. Comparison between cell groups for single-cell data was considered statistically significant when *P < 10−36 for (H) and (I). (J) Coexpression of surface marker TM4SF1 (blue) and SLA7A2 (red) is projected on UMAP and was used for labeling the pain-associated NPC1 cells experimentally, and the UMAP combining all NPCs (aNPCs, bpNPCs, sNPCs, and nsNPCs) is colored by subtype markers.
Fig. 4.
Fig. 4.. sNPCs but not nsNPCs induced sensory neuron axon ingrowth in a microfluidic device.
(A) Scheme for iPSC differentiation into nociceptor-like sensory neurons (iNOCs) in a two-stage procedure. (B) Immunofluorescence staining of neuronal markers in iNOCs including TUBB3 (green), ISL-1 (white), and 40,6-diamidino-2-phenylindole (DAPI) for cell nuclei (blue). (C) Gene expression of neuronal markers PRPH, ISL-1, TUBB3, and Pou4fa (n = 4 for iPSC and n = 3 for iNOC; *P < 0.05, **P < 0.01). (D) Illustration showing the coculture of iNOCs and nsNPCs or sNPCs in a microfluidic NPC-nociception chip. Optical images of the coculture between iNOCs and (E) nsNPCs or (F) sNPCs, with black arrows denoting visible axon-like structures traversing the channel. (G and H) Immunofluorescence images of TUBB3 (green), Brn3a (red), and DAPI (blue) of iNOCs cocultured with (G) nsNPCs or (H) sNPCs. (I and J) Immunofluorescence images of CCN2 (green), CD24 (red), and DAPI (blue) of iNOCs cocultured with (I) nsNPCs or (J) sNPCs. (K) Quantitative results of the number of channels with axon ingrowth in microfluidic devices for sNPC and nsNPC groups. The counting of axons was based on the fluorescence images (Tubb3 and CD24, n = 4 for both cell types, *P < 0.05).
Fig. 5.
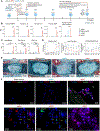
Fig. 5.. Stimulated NPCs induced stress and pain responses after intradiscal injection in healthy rats.
(A) Shown is the scheme for group design and timeline for animal experiments in a healthy rat. Gene expression of (B) MMP3, IL-8, IL-6, NGF, and ACAN with human primers and (C) MMP3, TNF-α, and IL-6 detected with rat primers are shown in RQ (n = 6) on day 7 after injection for rats injected with saline, nsNPCs, or sNPCs (*P < 0.05; **P < 0.01; and ns or not labeled, P > 0.05). (D) Shown are the biobehavioral test pain-related outcomes in acetone test, von Frey test, and Randall-Selitto tests at 2 days before injections and weeks 1, 2, 4, 6, and 8 after injections (n = 9; *P < 0.05, **P < 0.01, ***P < 0.001, and ****P < 0.0001 compared with saline control; ##P < 0.01 and ###P < 0.001 compared with nsNPC group). (E) Shown is the histological staining of L4/L5 and L5/L6 levels 8 weeks after injections for saline-injected, nsNPC-injected, and sNPC-injected rat IVDs (scale bars, 200 μm) stained with Alcian Blue and Picrosirius Red. (F) Shown are immunofluorescence images of IVDs harvested at week 8 after injections [DAPI (blue), TRPV1 (red), Gap43 (green), and CGRP (magenta); scale bars, 20 and 10 μm]. Yellow arrows and magnification panels indicate axon-like structures that were detected only in sNPC-injected IVDs.

References

    1. Andersson GB, Epidemiological features of chronic low-back pain. Lancet 354, 581–585 (1999). - PubMed
    1. Frank JW, Kerr MS, Brooker AS, DeMaio SE, Maetzel A, Shannon HS, Sullivan TJ, Norman RW, Wells RP, Disability resulting from occupational low back Pain. Spine (Phila Pa 1996) 21, 2908–2917 (1996). - PubMed
    1. Schwarzer AC, Aprill CN, Derby R, Fortin J, Kine G, Bogduk N, The relative contributions of the disc and zygapophyseal joint in chronic low back pain. Spine (Phila Pa 1976) 19, 801–806 (1994). - PubMed
    1. de Schepper EI, Damen J, van Meurs JB, Ginai AZ, Popham M, Hofman A, Koes BW, Bierma-Zeinstra SM, The association between lumbar disc degeneration and low back pain: The influence of age, gender, and individual radiographic features. Spine (Phila Pa 1976) 35, 531–536 (2010). - PubMed
    1. Kadow T, Sowa G, Vo N, Kang JD, Molecular basis of intervertebral disc degeneration and herniations: What are the important translational questions? Clin. Orthop. Rel. Res 473, 1903–1912 (2015). - PMC - PubMed

LinkOut - more resources