. 2023 Dec 8;9(49):eadj0390.
doi: 10.1126/sciadv.adj0390. Epub 2023 Dec 6.

Seabirds boost coral reef resilience

Affiliations

Seabirds boost coral reef resilience

Cassandra E Benkwitt et al. Sci Adv. .

Abstract

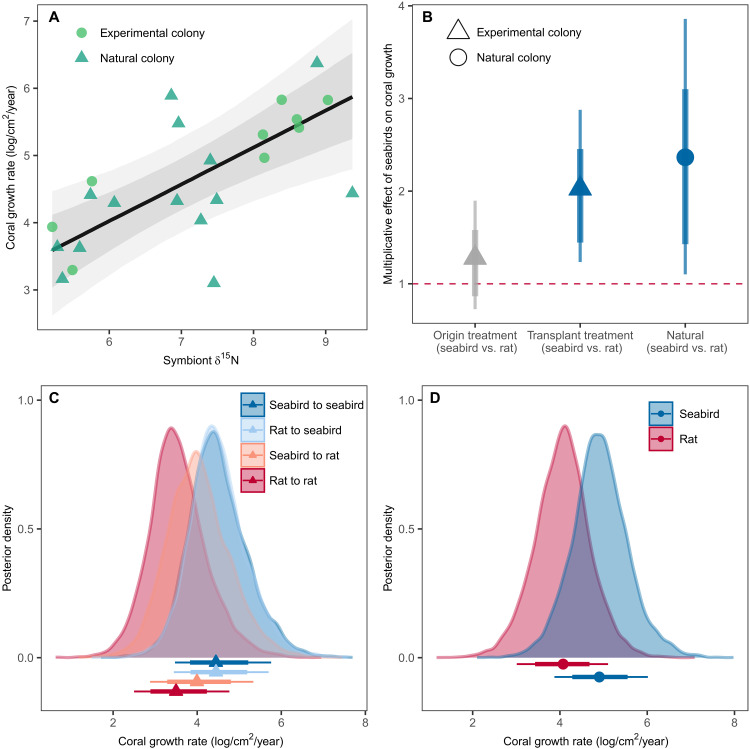
Global climate change threatens tropical coral reefs, yet local management can influence resilience. While increasing anthropogenic nutrients reduce coral resistance and recovery, it is unknown how the loss, or restoration, of natural nutrient flows affects reef recovery. Here, we test how natural seabird-derived nutrient subsidies, which are threatened by invasive rats, influence the mechanisms and patterns of reef recovery following an extreme marine heatwave using multiyear field experiments, repeated surveys, and Bayesian modeling. Corals transplanted from rat to seabird islands quickly assimilated seabird-derived nutrients, fully acclimating to new nutrient conditions within 3 years. Increased seabird-derived nutrients, in turn, caused a doubling of coral growth rates both within individuals and across entire reefs. Seabirds were also associated with faster recovery time of Acropora coral cover (<4 years) and more dynamic recovery trajectories of entire benthic communities. We conclude that restoring seabird populations and associated nutrient pathways may foster greater coral reef resilience through enhanced growth and recovery rates of corals.


Figures

Fig. 1.
Fig. 1.. Effect of seabird versus rat presence on seabird-derived nutrients in coral symbionts, measured as δ15N.
Posterior predictive distributions for natural Acropora colonies from (A) seabird (rat-free) islands, rat-infested islands, and control reefs with no nearby islands and (B) for Acropora colonies reciprocally transplanted between pairs of seabird and rat islands. Points represent median estimates, and lines represent 90 and 70% highest posterior density intervals (HPDIs).
Fig. 2.
Fig. 2.. Effect of seabird-derived nutrients and seabird versus rat presence on coral growth rates.
Posterior predictions presented for both experimental colonies (corals used in a reciprocal transplant experiment between pairs of seabird and rat islands) and natural colonies (unmanipulated corals from either seabird or rat island). (A) The effect of δ15N (a proxy for seabird-derived nutrients) in individual Acropora colonies on individual growth rates. Points are raw data, line represents conditional effect after controlling for colony size, and gray shading indicates 90 and 70% highest posterior density intervals (HPDIs). (B) Conditional effect of seabird presence on coral growth at an island level, with points above the dashed line indicating a positive effect of seabirds on growth. For experimental corals, “origin treatment” indicates whether corals started on a seabird or rat island, and “transplant treatment” indicates whether they were moved to a seabird or rat island for the duration of the experiment. Points represent median estimates, and lines represent 90 and 70% HPDIs. (C and D) Posterior predictive distributions for coral growth rates by treatment for (C) experimental colonies and (D) natural colonies. Points represent median estimates, and lines represent 90 and 70% HPDIs. All predictions are for a colony of average size.
Fig. 3.
Fig. 3.. Reef-scale recruitment and coral cover around rat-free islands with abundant seabirds (seabird islands) versus rat-infested islands with few seabirds (rat islands).
Posterior predictions for (A and B) Acropora corals only and (C and D) all genera combined. Recruitment was quantified in 2018 (3 years after bleaching), while coral cover was quantified in 2015 (before bleaching), 2018 (3 years after bleaching), and 2021 (6 years after bleaching). Points represent median estimates and lines represent 90 and 70% highest posterior density intervals (HPDIs).
Fig. 4.
Fig. 4.. Reconstructed recovery trajectories of Acropora coral cover around rat-free islands with abundant seabirds (seabird islands) versus rat-infested islands with few seabirds (rat islands).
Recovery of Acropora cover shown between April 2018 (3 years after bleaching) and May 2021 (6 years after bleaching). Lines represent median estimates, and shaded areas represent 70 and 90% confidence intervals.
Fig. 5.
Fig. 5.. Recovery of all benthic groups, based on repeated surveys around rat-free islands with abundant seabirds (seabird islands) versus rat-infested islands with few seabirds (rat islands) in 2015 (before bleaching), 2018 (3 years after bleaching), and 2021 (6 years after bleaching).
(A) Posterior predictions for reef-scale benthic recovery, measured as Bray-Curtis dissimilarity to prebleaching baseline of the whole benthic community. Small points and connecting lines represent individual islands through time. Large points and lines represent median estimates and 90 and 70% highest posterior density intervals (HPDIs). (B to E) Posterior predictions for proportional cover of broad benthic groups, except hard coral cover (see Fig. 3D). Points represent median estimates, and lines represent 90 and 70% HPDIs.

References

    1. Intergovernmental Panel on Climate Change (IPCC), "Climate Change 2022: Impacts, Adaptation and Vulnerability. Contribution of Working Group II to the Sixth Assessment Report of the Intergovernmental Panel on Climate Change," H.-O. Pörtner, D.C. Roberts, M. Tignor, E.S. Poloczanska, K. Mintenbeck, A. Alegría, M. Craig, S. Langsdorf, S. Löschke, V. Möller, A. Okem, B. Rama, Eds. (Cambridge University Press) pp. 3056, doi: 10.1017/9781009325844. - DOI
    1. J. W. Moore, D. E. Schindler, Getting ahead of climate change for ecological adaptation and resilience. Science 376, 1421–1426 (2022). - PubMed
    1. T. P. Hughes, K. D. Anderson, S. R. Connolly, S. F. Heron, J. T. Kerry, J. M. Lough, A. H. Baird, J. K. Baum, M. L. Berumen, T. C. Bridge, D. C. Claar, C. M. Eakin, J. P. Gilmour, N. A. J. Graham, H. Harrison, J.-P. A. Hobbs, A. S. Hoey, M. Hoogenboom, R. J. Lowe, M. T. McCulloch, J. M. Pandolfi, M. Pratchett, V. Schoepf, G. Torda, S. K. Wilson, Spatial and temporal patterns of mass bleaching of corals in the Anthropocene. Science 359, 80–83 (2018). - PubMed
    1. C. G. Jones, J. H. Lawton, M. Shachak, Organisms as ecosystem engineers. Oikos 69, 373–386 (1994).
    1. A. C. Baker, P. W. Glynn, B. Riegl, Climate change and coral reef bleaching: An ecological assessment of long-term impacts, recovery trends and future outlook. Estuar. Coast. Shelf Sci. 80, 435–471 (2008).