. 2023 Dec 8;9(49):eadi9566.
doi: 10.1126/sciadv.adi9566. Epub 2023 Dec 6.

DECTIN-1: A modifier protein in CTLA-4 haploinsufficiency

Affiliations

DECTIN-1: A modifier protein in CTLA-4 haploinsufficiency

Cynthia Turnbull et al. Sci Adv. .

Abstract

Autosomal dominant loss-of-function (LoF) variants in cytotoxic T-lymphocyte associated protein 4 (CTLA4) cause immune dysregulation with autoimmunity, immunodeficiency and lymphoproliferation (IDAIL). Incomplete penetrance and variable expressivity are characteristic of IDAIL caused by CTLA-4 haploinsufficiency (CTLA-4h), pointing to a role for genetic modifiers. Here, we describe an IDAIL proband carrying a maternally inherited pathogenic CTLA4 variant and a paternally inherited rare LoF missense variant in CLEC7A, which encodes for the β-glucan pattern recognition receptor DECTIN-1. The CLEC7A variant led to a loss of DECTIN-1 dimerization and surface expression. Notably, DECTIN-1 stimulation promoted human and mouse regulatory T cell (Treg) differentiation from naïve αβ and γδ T cells, even in the absence of transforming growth factor-β. Consistent with DECTIN-1's Treg-boosting ability, partial DECTIN-1 deficiency exacerbated the Treg defect conferred by CTL4-4h. DECTIN-1/CLEC7A emerges as a modifier gene in CTLA-4h, increasing expressivity of CTLA4 variants and acting in functional epistasis with CTLA-4 to maintain immune homeostasis and tolerance.


Figures

Fig. 1.
Fig. 1.. Identification of CTLA4 and CLEC7A/DECTIN-1 variants.
(A) Heatmap showing variant scores calculated by a variant prioritization algorithm from WGS in the proband. (B) Family pedigree depicting the maternally inherited CTLA-4 and paternally inherited DECTIN-1 variants. (C) IGV viewer snapshots showing WGS read depth of the kindred in CTLA4 and CLEC7A regions. The heterozygous paternally inherited CLEC7A variant is shown in green while the maternally inherited CTLA4 variant is in blue. (D) Chromatograms showing the CTLA4 (C>G: forward strand, Chr 2) and CLEC7A (G>A: reverse strand, Chr 12) variants in the patient through Sanger sequencing. (E) Protein domain schematic of DECTIN-1 with the L183F mutation (red line). (F) Sequence alignment analysis showing conservation of DECTIN-1. Residues associated with the dimer interface responsible for β-glucan binding are highlighted in blue while the variant position (L183F) is bolded in red. (G) A visual representation of murine DECTIN-1 dimer crystal structure [PDB ID: 2cl8 (19)] (silver and cyan) with bound β-glucan (licorice), between the dimer interface (yellow). L183 is depicted in its hydrophobic pocket (red). (H) Interaction between L/F183 (red) and nearby F200 (purple) residues, showing the displaced F200 residue and loop in the mutant state. (I) RMSD plot for human DECTIN-1, with L/F183 (red) and the F200-containing loop (purple) highlighted. (J) WT and L183F monomer snapshots (gray) superimposed against a reference binding partner (cyan), with attention drawn to the F200 loop region (purple, residues 196 to 202). Structural images displayed are generated with VMD and PyMOL software.
Fig. 2.
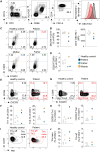
Fig. 2.. Functional effects of the L183F mutation on DECTIN-1.
(A) Representative histograms of intracellular DECTIN-1 expression within Myc-tag+ (“transfected”) HEK293 cells, transfected with WT (L183:L183), mutant (F183:F183), and a combination of WT and mutant CLEC7A DNA (L183:F183). (B) Quantification of the frequency of DECTIN-1+ cells and DECTIN-1 MFI within Myc-flag+ cells (n = 5, each dot is a separate transfection). (C) Representative immunofluorescence images depicting localization of DECTIN-1 protein in NIH3T3 cells transfected with WT or mutant CLEC7A, in the absence or presence of depleted zymosan (100 μg/ml). (D) Flow cytometric plots and (E) quantification of zymosan uptake through DECTIN-1–mediated phagocytosis in HEK293 cells transfected as in (A) and incubated with pHrodo zymosan particles for 2 hours. Data are pooled from two independent experiments (n = 8, each dot is a separate transfection). Statistical significance in (B) and (E) was calculated by one-way analysis of variance (ANOVA), ***P < 0.001 and ****P < 0.0001.
Fig. 3.
Fig. 3.. DECTIN-1 expression and immunophenotyping of the kindred.
(A) Flow cytometric plots showing gating strategy for detecting DECTIN-1 expression on monocytes (CD14+) from PBMCs. (B) Quantification of the frequency of DECTIN-1+ cells among CD14+ monocytes and DECTIN-1 MFI in CD14+ monocytes from PBMCs in the proband (red), a healthy control (dark gray), and an FMO (light gray). (C) Flow cytometric plots, and (D) quantification of Tregs (CD25+FOXP3+) from the patient and healthy controls. (E to H) Representative flow cytometric profiles and quantified frequencies of CXCR5/CXCR5+ TH1 (CXCR3+CCR6) and TH2 (CXCR3CCR6) CD4+ cells and CXCR5+ (TFH) effector (CCR7+) and memory (PD1+) cells from PBMCs of the kindred and healthy blood donors. Each dot is representative of a separate PBMC donor. In (F to J), the colors are the same as those in the legend for (B) and (D).
Fig. 4.
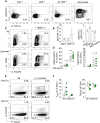
Fig. 4.. DECTIN-1 induces Treg differentiation.
(A) Flow cytometric plots and (B) quantification of DECTIN-1 expression in monocytes and the indicated T cell subsets following α-CD3/α-CD28 stimulation. (C) Flow cytometric plots and (D) quantification of induced Tregs (CD25+FOXP3+CD4+), from MACS-sorted human naïve T cells cultured with rTGF-β (5 ng/ml) and rIL-2 (1 mg/ml) in the presence or absence of zymosan (100 μg/ml) for 7 days. Each dot represents the mean value of cultures set up in triplicate from a single healthy blood donor. (E) Flow cytometric plots and (F) quantification of the proportion of murine iTregs induced from FACS-sorted WT or Dectin-1 haploinsufficient (Clec7a+/−) naïve T cells, following plate bound α-CD3 (3 μg/ml), soluble α-CD28 (2 μg/ml), and rIL-2 (5 ng/ml) stimulation, activation in the absence or presence of zymosan (100 μg/ml) for 3 days. Data are representative of two independent experiments (n = 6). Statistical significance in (D) and (F) was calculated by nonparametric paired t tests, *P < 0.05, **P < 0.01, and ***P < 0.001.
Fig. 5.
Fig. 5.. DECTIN-1 signaling acts on γδ T cells to limit IL-5 release.
(A) Flow cytometric plots and (B) quantification of induced γδ Tregs (FOXP3+CD25+) from MACS-sorted naïve γδ T cells activated with α-CD3/α-CD28 beads (1:1) together with rIL-2 with or without zymosan (100 μg/ml) for 10 days. (C) Quantification of IL-5 in culture supernatants of γδ T cells activated in TH2 [rIL-2/rIL-4 (50 ng/ml)]– or Treg [rIL-2/rIL-15(50 ng/ml)/rTGF-β]–inducing conditions. MFI values are normalized to the TH2-inducing conditions. Human in vitro T cell differentiation data are representative of three independent experiments (n > 8), where each dot represents the mean value of cultures set up in triplicate from a single healthy blood donor. Statistical significance in (B) and (C) was calculated by paired t tests, **P < 0.01 and ***P < 0.001.
Fig. 6.
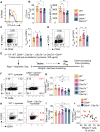
Fig. 6.. Decreased Treg differentiation and function in combined DECTIN-1/CTLA-4 deficiency.
(A) Flow cytometric histograms and (B) quantification of CTLA-4 expression in splenic CD4+ Tregs from WT, Ctla4+/−, and Ctla4+/-Clec7a+/− mice. (C and D) Flow cytometric plots and quantification showing frequencies of peripheral Treg (FOXP3+CD44+) from mice before (C) and 7 days after (D) zymosan (100 μg/ml, i.p.) injections. Bars represent medians and each dot denotes a single mouse. Data are representative of two independent experiments (n = 10). (E) Schematic of the Rag1−/− adoptive transfer model of zymosan-mediated Treg expansion. (F to I) Representative flow cytometric plots and quantified frequencies of activated Treg cells (CD86+FOXP3+) (F and G) and T effector (FOXP3CD44+) (H and I) in Rag1−/− recipient mice (with zymosan) as in (E). (J) Pearson correlation analyses between T effector and activated Tregs in WT (r = 0.4), Ctla4+/− (r = 0.3), and Ctla4+/−Clec7a+/− (r = −0.757) recipients (n = 5 to 10 per genotype). Statistical significance in (B) to (D) and (G) to (I) was calculated with nonparametric Mann-Whitney tests, *P < 0.05, **P < 0.01 and ***P < 0.001.

References

    1. D. Schubert, C. Bode, R. Kenefeck, T. Z. Hou, J. B. Wing, A. Kennedy, A. Bulashevska, B. S. Petersen, A. A. Schäffer, B. A. Grüning, S. Unger, N. Frede, U. Baumann, T. Witte, R. E. Schmidt, G. Dueckers, T. Niehues, S. Seneviratne, M. Kanariou, C. Speckmann, S. Ehl, A. Rensing-Ehl, K. Warnatz, M. Rakhmanov, R. Thimme, P. Hasselblatt, F. Emmerich, T. Cathomen, R. Backofen, P. Fisch, M. Seidl, A. May, A. Schmitt-Graeff, S. Ikemizu, U. Salzer, A. Franke, S. Sakaguchi, L. S. K. Walker, D. M. Sansom, B. Grimbacher, Autosomal dominant immune dysregulation syndrome in humans with CTLA4 mutations. Nat. Med. 20, 1410–1416 (2014). - PMC - PubMed
    1. H. S. Kuehn, W. Ouyang, B. Lo, E. K. Deenick, J. E. Niemela, D. T. Avery, J. N. Schickel, D. Q. Tran, J. Stoddard, Y. Zhang, D. M. Frucht, B. Dumitriu, P. Scheinberg, L. R. Folio, C. A. Frein, S. Price, C. Koh, T. Heller, C. M. Seroogy, A. Huttenlocher, V. K. Rao, H. C. Su, D. Kleiner, L. D. Notarangelo, Y. Rampertaap, K. N. Olivier, J. McElwee, J. Hughes, S. Pittaluga, J. B. Oliveira, E. Meffre, T. A. Fleisher, S. M. Holland, M. J. Lenardo, S. G. Tangye, G. Uzel, Immune dysregulation in human subjects with heterozygous germline mutations in CTLA4. Science 345, 1623–1627 (2014). - PMC - PubMed
    1. Z. Y. Kucuk, L. M. Charbonnier, R. L. McMasters, T. Chatila, J. J. Bleesing, CTLA-4 haploinsufficiency in a patient with an autoimmune lymphoproliferative disorder. J. Allergy Clin. Immunol. 140, 862–864.e4 (2017). - PMC - PubMed
    1. L. S. K. Walker, D. M. Sansom, The emerging role of CTLA4 as a cell-extrinsic regulator of T cell responses. Nat. Rev. Immunol. 11, 852–863 (2011). - PubMed
    1. V. Ovcinnikovs, E. M. Ross, L. Petersone, N. M. Edner, F. Heuts, E. Ntavli, A. Kogimtzis, A. Kennedy, C. J. Wang, C. L. Bennett, D. M. Sansom, L. S. K. Walker, CTLA-4-mediated transendocytosis of costimulatory molecules primarily targets migratory dendritic cells. Sci Immunol 4, (2019). - PMC - PubMed