. 2023 Dec 8;9(49):eadh8152.
doi: 10.1126/sciadv.adh8152. Epub 2023 Dec 6.

A mechanochemical model recapitulates distinct vertebrate gastrulation modes

Affiliations

A mechanochemical model recapitulates distinct vertebrate gastrulation modes

Mattia Serra et al. Sci Adv. .

Abstract

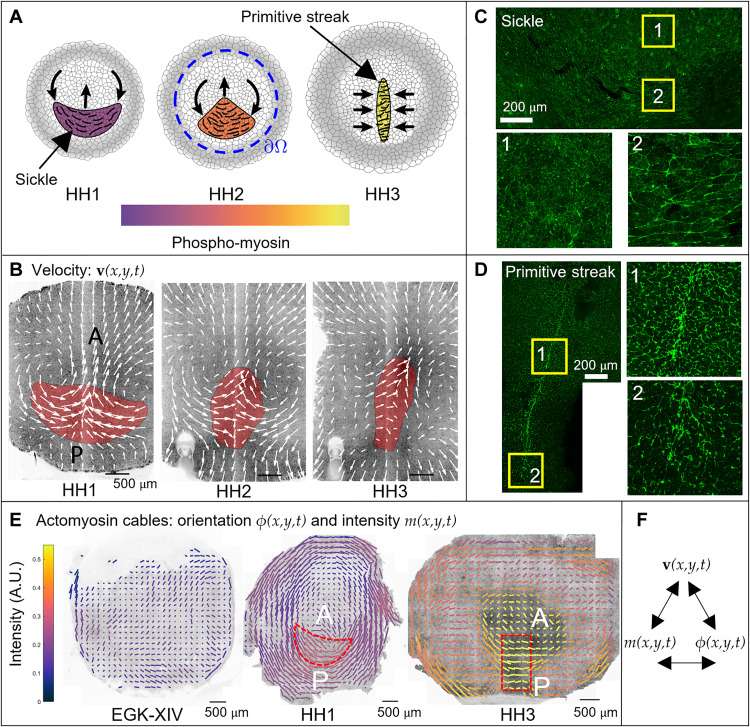
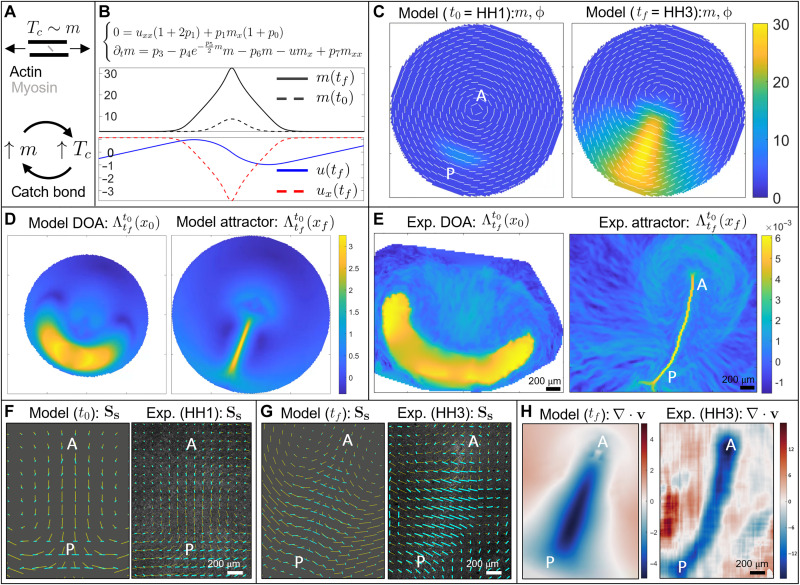
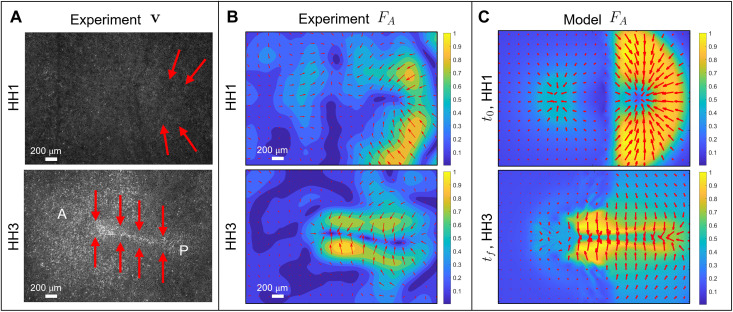
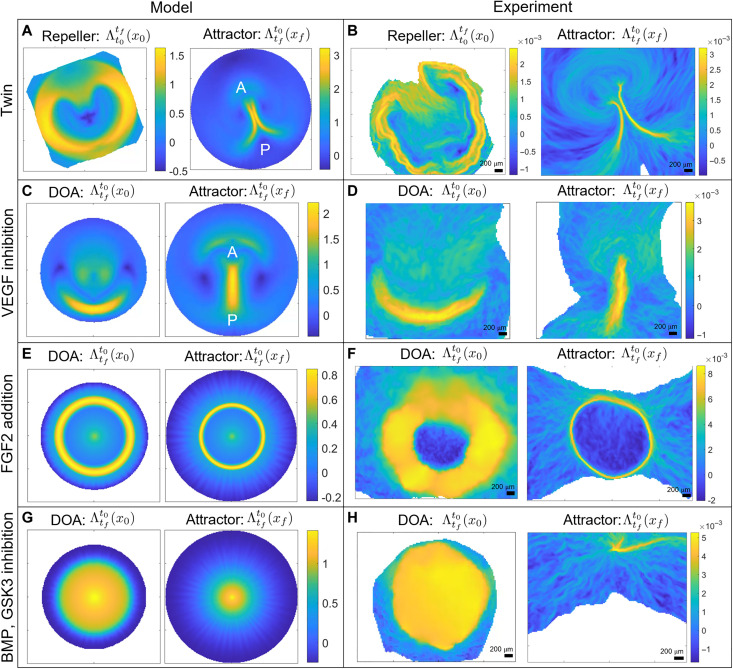
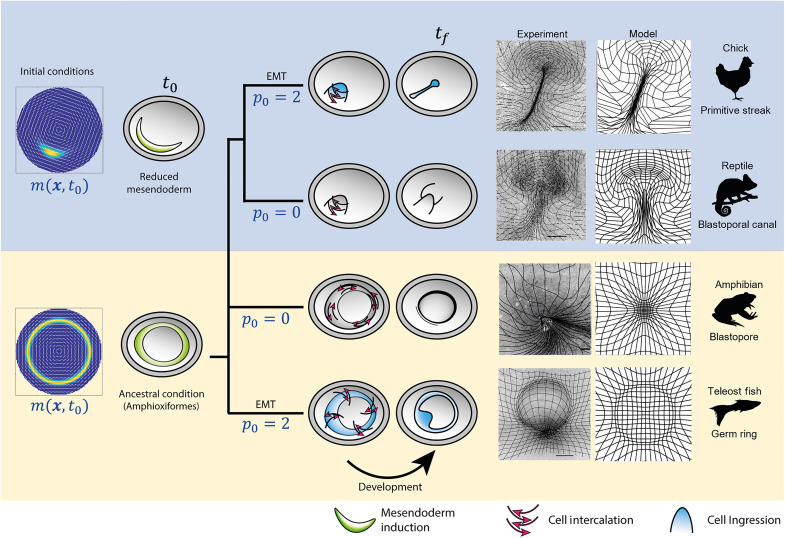
During vertebrate gastrulation, an embryo transforms from a layer of epithelial cells into a multilayered gastrula. This process requires the coordinated movements of hundreds to tens of thousands of cells, depending on the organism. In the chick embryo, patterns of actomyosin cables spanning several cells drive coordinated tissue flows. Here, we derive a minimal theoretical framework that couples actomyosin activity to global tissue flows. Our model predicts the onset and development of gastrulation flows in normal and experimentally perturbed chick embryos, mimicking different gastrulation modes as an active stress instability. Varying initial conditions and a parameter associated with active cell ingression, our model recapitulates distinct vertebrate gastrulation morphologies, consistent with recently published experiments in the chick embryo. Altogether, our results show how changes in the patterning of critical cell behaviors associated with different force-generating mechanisms contribute to distinct vertebrate gastrulation modes via a self-organizing mechanochemical process.


Figures

Fig. 1.
Fig. 1.. Actomyosin cables drive the tissue flows in gastrulation.
(A) PS formation diagram. (B) Velocity in the chick gastrula. The convergent extension of the mesendoderm (red) generates macroscopic tissue flows on the surface of the embryo. (C) At HH1, the mesendoderm sickle territory is characterized by supracellular cables with active myosin (phosphorylated myosin light chain; pMLC) perpendicular to the anterior-posterior (AP) direction (see fig. S9 for details). (D) At HH3—12 hours after HH1—the PS is characterized by supracellular cables with high active myosin (pMLC) perpendicular to the midline. (E) The pattern of actomyosin cables evolves from EGK-XIV to HH3. Bar lengths represent the pMLC anisotropy and bar colors represent the measured absolute concentration. The red dashed sickle and rectangle indicate the mesendoderm precursors region and a stripe of tissue containing the PS. At HH3, the PS region has maximal pMLC intensity and maximal anisotropy perpendicular to the PS, resulting in the highest active stress along cables perpendicular to the PS. Figure S10 shows the same measured pMLC signal intensity as a scalar field over the embryo, demonstrating an overall increase in myosin activity. For experimental details, see (4). (F) Here, we construct a theoretical framework coupling velocity, actomyosin orientation, and intensity that explains observed gastrulation flows in recent experiments.
Fig. 2.
Fig. 2.. Dynamics of wild-type gastrulation in the chick embryo.
(A) In the gastrulation timescale, the tension in the actomyosin cables is maintained by their active stress intensity Tc ≈ 〈e, σAe〉 = m/2 (section S1.3). High Tc induces a further increase of m via the catch-bond mechanism, which in turn increases Tc. This positive feedback process causes the instability of Eq. 1. (B) One-dimensional model recapitulates a focusing-type instability of active myosin, which induces a colocated velocity sink describing cell ingression at the PS. Movie S1 shows the time evolution of m, u, ux. (C) Initial (t0) and final (tf) distributions of m, ϕ for the 2D model. The instability of m drives cable reorientation and active myosin evolution. These, in turn, drive the tissue flows underlying the extension of the streak from posterior (P) to anterior (A). (D) Model-based domain of attraction (DOA) at t0 (HH1) and the attractor at tf (HH3). Movie S2 shows the time evolution of the relevant model-based v, m, ϕ, Lagrangian grid, repellers, DOAs, and attractors. (E) Same as (D) for the experimental velocity. Movie S3 shows the time evolution of the Lagrangian metrics for the experimental v. Panel (E) adapted with permission from (44). (F and G) Line segments indicate the velocity (yellow) and contracting eigenvector of the deviatoric rate of strain tensor (cyan) with length proportional to the contraction strength. (F) Model-based and experimental velocity deviatoric rate of strain at HH1 (t0). (G) Same as (F) at HH3 (tf). The experimental panels’ background consists of fluorescence images. (H) Model-based and experimental velocity divergence at HH3 (tf). Color bars in (C), (D), and (H) (left) are in nondimensional units. Color bars in (E) and (H) (right) are in 1/minutes. See section S4.6 for parameters, boundaries, and initial conditions used in Eq. 1.
Fig. 3.
Fig. 3.. Active forces in the chick embryo.
(A) Experimental fluorescence images at HH1 and HH3. A and P mark the anterior-posterior direction, and red arrows illustrate the dominant active force FA distribution from (B). At HH1, FA is dominant in the posterior embryonic region perpendicular to the AP axis. At HH3, FA is perpendicular to the PS throughout the AP axis. These FA configurations are consistent with the corresponding distribution of supracellular actomyosin cables in Fig. 1E. Dimensions are 1300 μm × 1900 μm. (B) and (C) Magnitude and direction of forces at HH1 (top) and HH3 (bottom). Magnitudes are normalized by the maximal spatial force. (B) We compute FA from the general force balance for highly viscous active flows FA + FV = 0 (cf. Eq. 1a), which gives FA = −([ · v] + 2p1Δv), where the right-hand side can be computed using experimental velocities. We use an averaging filter in space (window size ≈25 μm) and time (window size ≈15 min) on the PIV velocities and compute velocity derivatives using finite differencing. (C) FA is from Eq. 1a. We note that the model FA at HH3 arises from the dynamical variables evolved by Eq. 1 over the entire gastrulation period. They closely predict the corresponding inferred experimental forces [(B) bottom], further validating our model.
Fig. 4.
Fig. 4.. Developmental perturbations of gastrulation.
Movies show the time evolution of the relevant Eulerian and Lagrangian metrics. (A and B) Spontaneous twin perturbation. Repeller and attractor for model velocities [(A), movie S4] and experimental velocities [(B), movie S5]. (C and D) VEGF (vascular epithelial growth factor) inhibition prevents cell ingression at the PS. DOA and attractor for model velocities [(C), movie S6] and experimental velocities [(D), movie S7]. (E and F) FGF2 (fibroblast growth factor 2) addition provokes a circular PS. DOA and attractor for model velocities [(E), movie S8] and experimental velocities [(F), movie S9]. (G and H) BMP (bone morphogenetic protein) and GSK3 (glycogen synthase kinase 3) inhibition induce a ring-shaped mesoderm territory at the EE-EP interface while blocking apical contraction and cell ingression. DOA and attractor for model velocities [(G), movie S11) and experimental velocities [(H), movie S12]. Color bars in experimental panels show attraction rates in 1/minutes. See section S4.6 for parameters values, boundaries, and initial conditions used in simulating Eq. 1.
Fig. 5.
Fig. 5.. Evolutionary transitions in gastrulation patterns.
A critical morphogenetic parameter p0 models the amount of EMT or active cell ingression caused by the cell’s propensity to ingress given apical myosin-induced isotropic contraction. The initial condition m(x, t0) models the extent of the mesendoderm precursor territory. Changing cell behaviors p0 and initial cell types m(x, t0) (left column), our model recapitulates the flow patterns in the phylogeny of vertebrate gastrulation from a self-organizing dynamical structure. Our model-based predicted flow patterns mimic those naturally observed in reptiles, amphibians, and fish, and are reproduced experimentally, in vivo, in the chick embryo [see also the recently published paper (4) for details on the experiments]. The right columns show deformed Lagrangian grids overlaying the light-sheet microscope images from perturbed chick-experiment velocities (4) and deformed Lagrangian grids from the predicted model velocity for each gastrulation mode. Scale bars, 500 μm.

Similar articles

Cited by

References

    1. C. D. Stern, Gastrulation: From Cells to Embryo (CSHL Press, 2004).
    1. E. Rozbicki, M. Chuai, A. I. Karjalainen, F. Song, H. M. Sang, R. Martin, H. J. Knölker, M. P. MacDonald, C. J. Weijer, Myosin-II-mediated cell shape changes and cell intercalation contribute to primitive streak formation. Nat. Cell Biol. 17, 397–408 (2015). - PMC - PubMed
    1. M. Saadaoui, D. Rocancourt, J. Roussel, F. Corson, J. Gros, A tensile ring drives tissue flows to shape the gastrulating amniote embryo. Science 367, 453–458 (2020). - PubMed
    1. M. Chuai, G. S. Nájera, M. Serra, L. Mahadevan, C. J. Weijer, Reconstruction of distinct vertebrate gastrulation modes via modulation of key cell behaviors in the chick embryo. Sci. Adv. 9, eabn5429 (2023). - PMC - PubMed
    1. G. Serrano Nájera, C. J. Weijer, Cellular processes driving gastrulation in the avian embryo. Mech. Dev. 163, 103624 (2020). - PMC - PubMed