. 2023 Dec 8;9(49):eadj6174.
doi: 10.1126/sciadv.adj6174. Epub 2023 Dec 6.

Innate TCRβ-chain engagement drives human T cells toward distinct memory-like effector phenotypes with immunotherapeutic potentials

Affiliations

Innate TCRβ-chain engagement drives human T cells toward distinct memory-like effector phenotypes with immunotherapeutic potentials

Pierre Vantourout et al. Sci Adv. .

Abstract

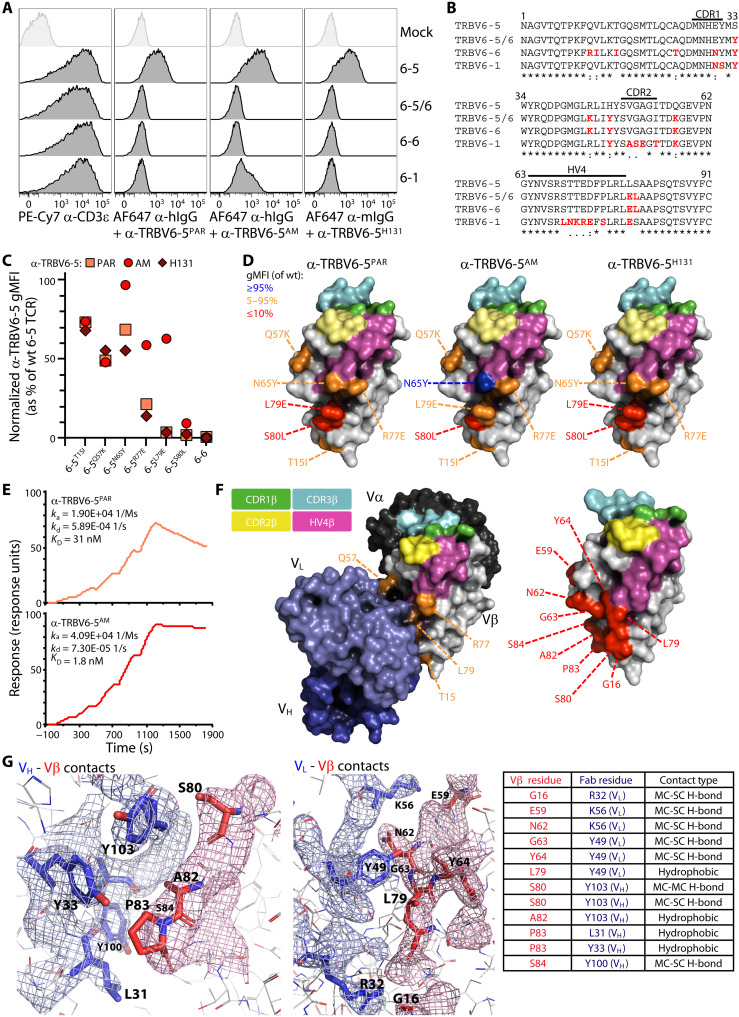
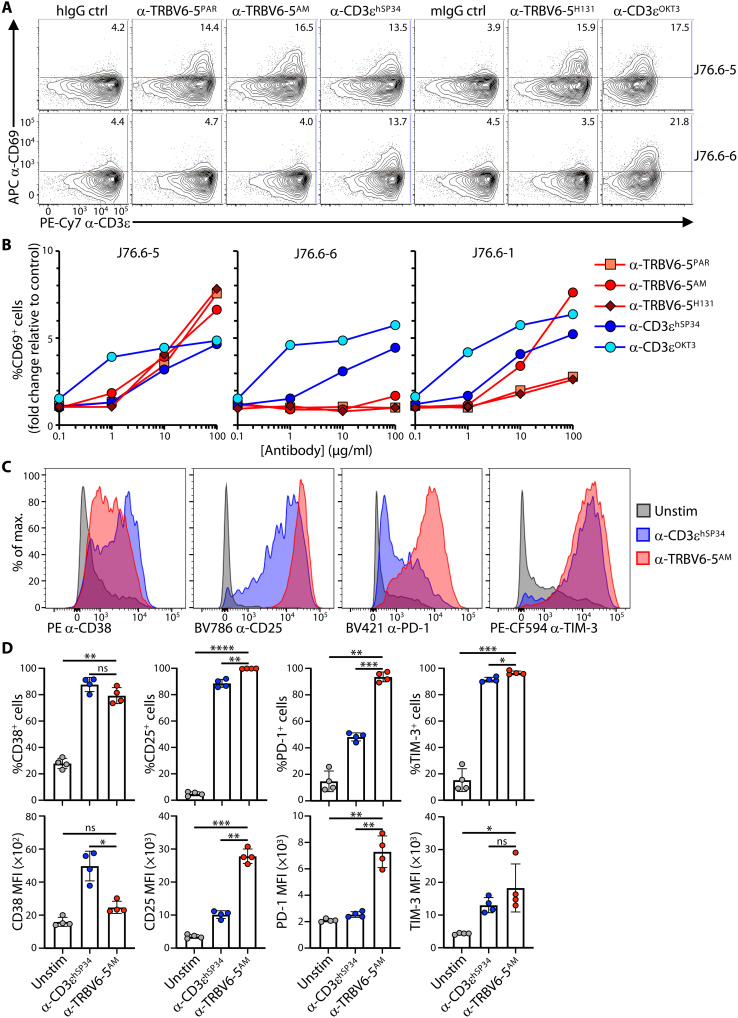
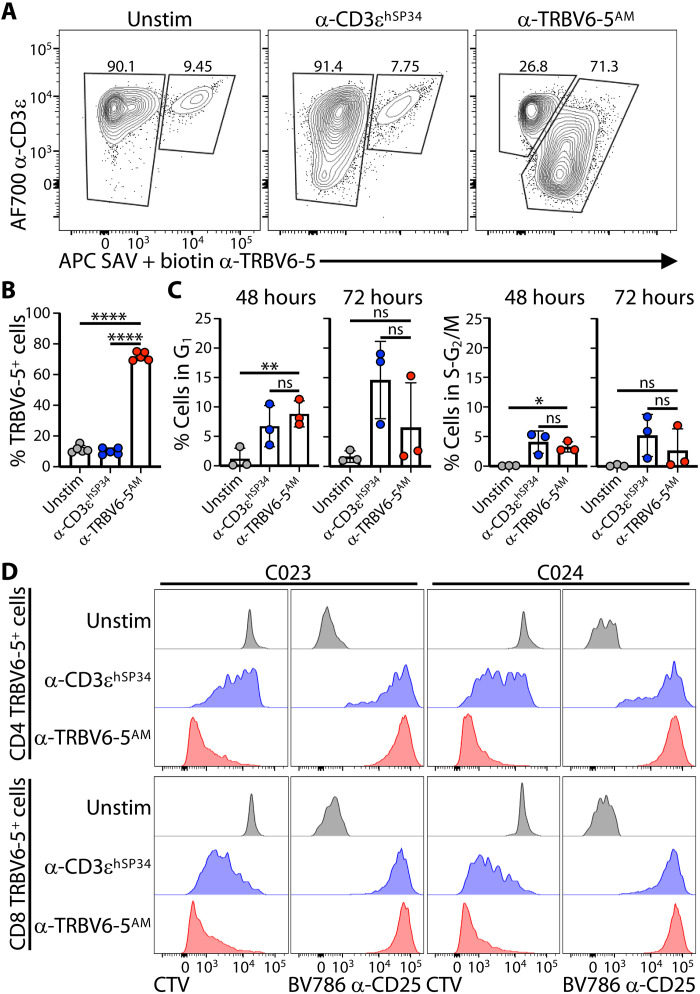
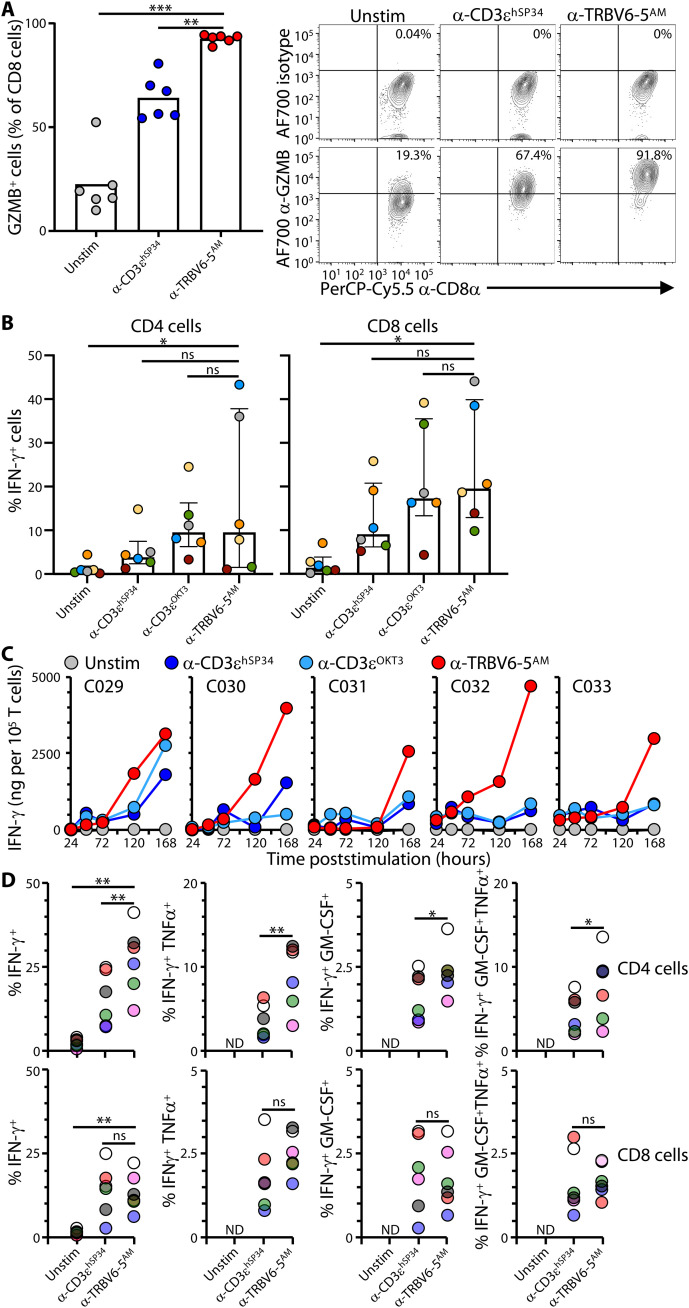
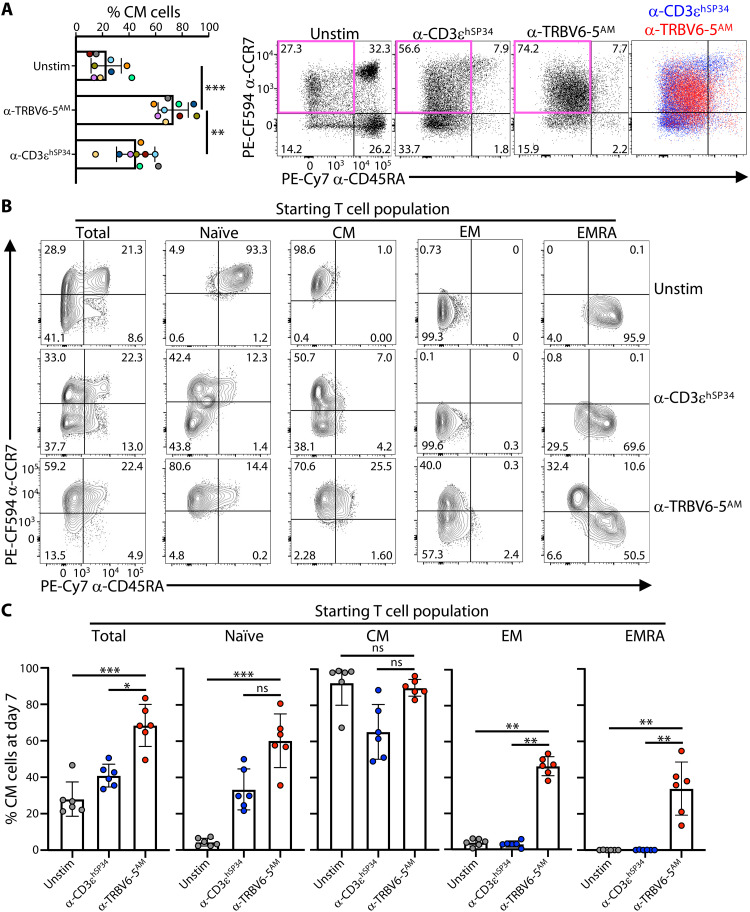
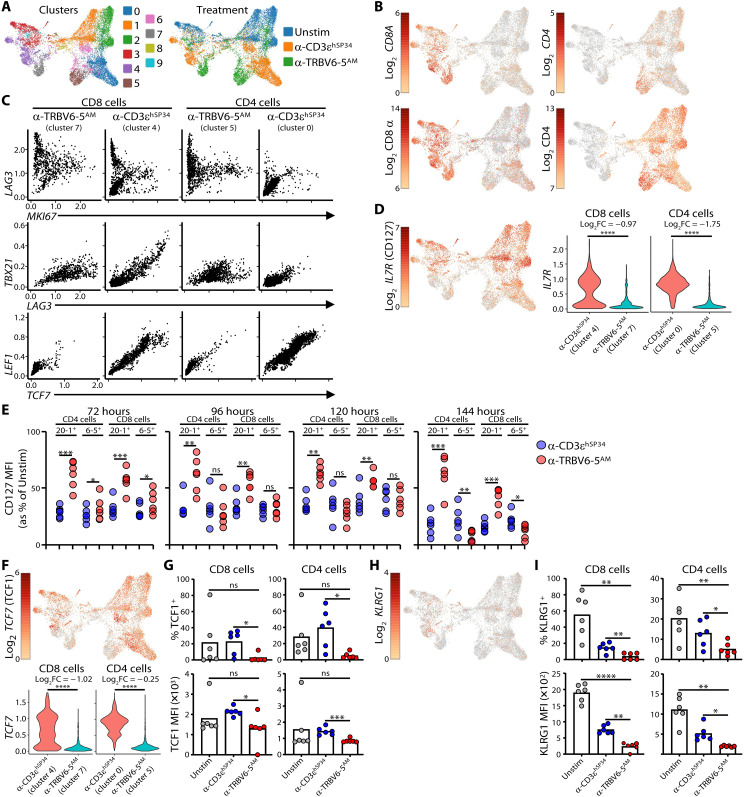
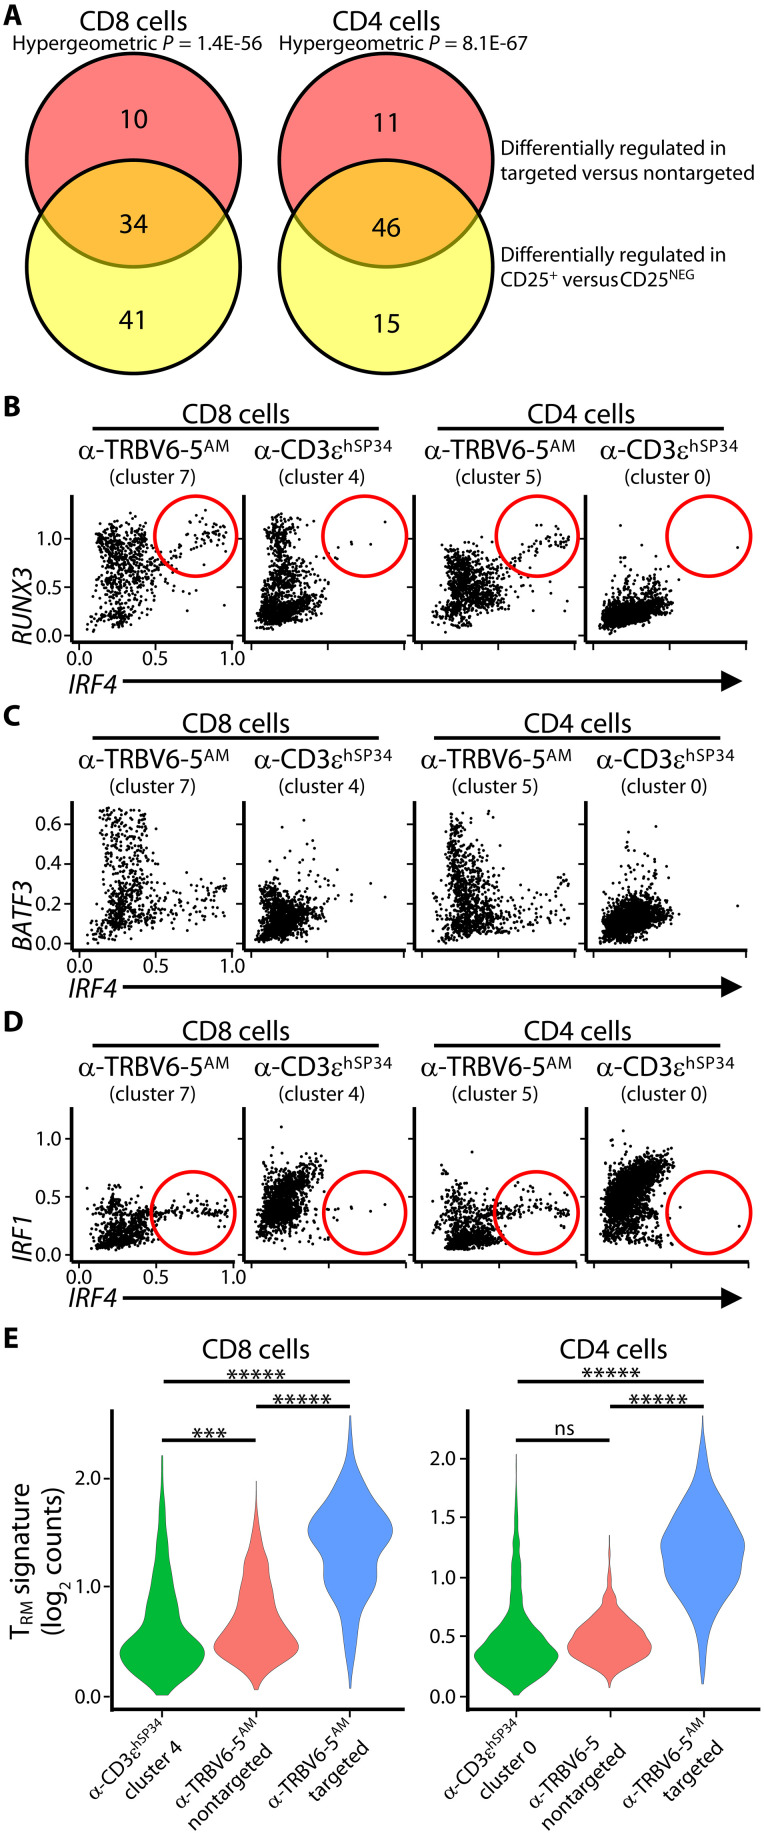
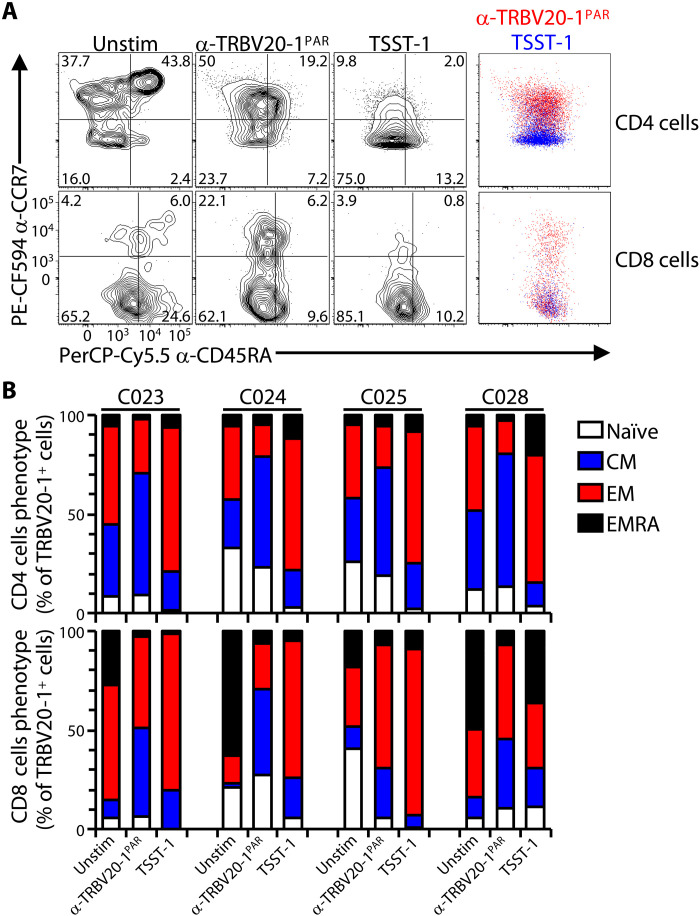
Clonotypic αβ T cell responses to cargoes presented by major histocompatibility complex (MHC), MR1, or CD1 proteins underpin adaptive immunity. Those responses are mostly mediated by complementarity-determining region 3 motifs created by quasi-random T cell receptor (TCR) gene rearrangements, with diversity being highest for TCRγδ. Nonetheless, TCRγδ also displays nonclonotypic innate responsiveness following engagement of germline-encoded Vγ-specific residues by butyrophilin (BTN) or BTN-like (BTNL) proteins that uniquely mediate γδ T cell subset selection. We now report that nonclonotypic TCR engagement likewise induces distinct phenotypes in TCRαβ+ cells. Specifically, antibodies to germline-encoded human TCRVβ motifs consistently activated naïve or memory T cells toward core states distinct from those induced by anti-CD3 or superantigens and from others commonly reported. Those states combined selective proliferation and effector function with activation-induced inhibitory receptors and memory differentiation. Thus, nonclonotypic TCRVβ targeting broadens our perspectives on human T cell response modes and might offer ways to induce clinically beneficial phenotypes in defined T cell subsets.


Figures

Fig. 1.
Fig. 1.. Mapping of amino acids involved in the binding of α-TRBV antibodies.
(A) Flow cytometry analysis of TCR staining on J76 cells coexpressing a fixed TCRα chain (TRAV24) and TCRβ chains bearing the indicated TRBV segments. Cells were stained separately with the indicated antibodies 72 hours posttransduction. TRBV6-5/6 is a chimeric construct derived from TRBV6-5 and TRBV6-6. Representative of three independent transductions. (B) Alignment of V regions (leader and CDR3 excluded) of the TCRβ constructs stained in (A). Amino acids in red indicate differences from TRBV6-5. (C) Summary flow cytometry analysis of the staining of the indicated TRBV6-5 mutants and TRBV6-6 negative control. MFI normalized to α-CD3ɛ and expressed as % of the wild-type (wt) TRBV6-5 staining. Representative of three independent transductions. (D) Mapping of the amino acids mutated in (C). The Vβ domain structure was derived from Protein Data Bank (PDB) 6JXR. The CDR1, CDR2, CDR3, and HV4 regions are highlighted in green, yellow, cyan and magenta, respectively. (E) Single-cycle kinetics analysis of the binding of the α-TRBV6-5PAR (top) and α-TRBV6-5AM (bottom) antibodies to a TRAV12-3/TRBV6-5 αβ TCR [sequence derived from PDB 4WWK (68)] by surface plasmon resonance. (F) Left: Crystal structure of the α-TRBV6-5AM antibody bound to a TRAV12-3/TRBV6-5 αβ TCR [sequence derived from PDB 4WWK (68)]. Color key for the Vβ annotation as previously, including mutations shown to affect the staining of a TRBV6-5 TCR expressed by J76 cells [see (D)] by the α-TRBV6-5PAR antibody. Light blue, VL; dark blue, VH. Right: Vβ domain amino acids determined to contact the antibody are highlighted in red (see below). (G) Detailed view of the contacts between the α-TRBV6-5AM antibody VH (left) and VL (middle) domains and the Vβ domain amino acids. Mesh structures represent electron densities at interfaces. Pairings are listed as a table (right).
Fig. 2.
Fig. 2.. Stimulatory activity of α-TRBV antibodies.
(A) J76 cells coexpressing a TRAV24+ TCRα chain and a TRBV6-5+ (J76.6-5) or TRBV6-6+ (J76.6-6) TCRβ chain were seeded on the indicated plate-bound antibodies (10 μg/ml), incubated for 4 hours at 37°C, and then stained for analysis of CD69 up-regulation by flow cytometry. Representative of two independent experiments. (B) J76 cells coexpressing a TRAV24+ TCRα chain and a TRBV6-5+ (J76.6-5), TRBV6-6+ (J76.6-6), or TRBV6-1+ TCRβ chain were incubated for 4 hours at 37°C with increasing concentrations of the indicated plate-bound antibodies and then stained for analysis of CD69 up-regulation by flow cytometry. Representative of two independent experiments. (C and D) Purified T cells were cultured for 7 days without (Unstim) or with the indicated plate-bound antibodies in complete media supplemented with IL-2 and IL-15 and then stained for the indicated activation markers for analysis by flow cytometry after gating on TRBV6-5+ cells. Representative histograms and summary data of the percentage of positive cells and MFI for n = 4 donors are shown in (C) and (D), respectively. In (D), data are shown as mean ± SD. ns, not significant; *P < 0.05; **P < 0.01; ***P < 0.001; ****P < 0.0001 [paired analysis of variance (ANOVA) with Dunnett’s method, comparing α-TRBV6-5AM to every other condition individually].
Fig. 3.
Fig. 3.. α-TRBV–induced T cell proliferation.
(A and B) Purified T cells were cultured as in Fig. 1 (C and D) without (Unstim) or with the indicated plate-bound antibodies and then analyzed by flow cytometry to evaluate the specific enrichment for TRBV6-5+ cells by the corresponding affinity-matured (AM) antibody. Representative contour plots and summary data of the percentage of TRBV6-5+ cells for n = 5 donors are shown in (A) and (B), respectively. In (B), data are shown as mean ± SD. ****P < 0.0001 (paired ANOVA with Dunnett’s method, comparing α-TRBV6-5AM to every other condition individually). (C) Purified T cells were cultured without (Unstim) or with the indicated antibodies in the presence of IL-2 and IL-15 and then stained intracellularly for Ki67 and DNA content (Hoescht 33342) at 48 and 72 hours poststimulation to determine the percentage of cells in G1 (left) and S/G2M (right). Data are shown as the mean ± SD of n = 3 donors. *P < 0.05; **P < 0.01 (paired ANOVA with Dunnett’s method, comparing α-TRBV6-5AM to every other condition individually). Representative contour plots for one donor are shown in fig. S3B. (D) Purified T cells were labeled with cell trace violet (CTV), then cultured for 5 days in the presence of IL-2 + IL-15 without (Unstim) or with the indicated plate-bound antibodies, and then stained for CD25 for analysis of activation and proliferation (CTV dilution) of CD4 and CD8 cells by flow cytometry. Representative of 10 different donors.
Fig. 4.
Fig. 4.. α-TRBV–induced effector responses.
(A) Purified T cells were cultured as in Fig. 2 (C and D) without (Unstim) or with the indicated plate-bound antibodies for 7 days then stained intracellularly for GZMB or a matching isotype control for analysis by flow cytometry. Data are shown as mean ± SD of n = 6 donors. **P < 0.01; ***P < 0.001 (paired ANOVA with Dunnett’s method, comparing α-TRBV6-5AM to every other condition individually). Representative contour plots for one donor are shown on the right. (B) Purified T cells were cultured as in Fig. 2 (C and D) without (Unstim) or with the indicated plate-bound antibodies for 3, 5, and 7 days and then stained intracellularly for IFN-γ or a matching isotype control for analysis by flow cytometry in CD4 (top row) and CD8 (bottom row) cells. Data are shown as mean ± SD of n = 6 donors. *P < 0.05 (paired ANOVA with Dunnett’s method, comparing α-TRBV6-5AM to every other condition individually). Summary data for all time points are shown in fig. S4A. (C) Purified T cells from n = 5 donors were cultured as in Fig. 2 (C and D) without (Unstim) or with the indicated plate-bound antibodies, and supernatants were collected at the indicated time points to evaluate the cumulative secretion of IFN-γ by flow cytometry using the TH response and antiviral response LEGENDplex assays. (D) Purified T cells were cultured as in Fig. 2 (C and D) without (Unstim) or with the indicated plate-bound antibodies for 7 days and then stained intracellularly for IFN-γ, GM-CSF, and TNFα for analysis by flow cytometry in CD4 (top row) and CD8 (bottom row) cells. Each color represents a different donor (n = 6). ND, not determined; *P < 0.05; **P < 0.01 (paired ANOVA with Dunnett’s method, comparing α-TRBV6-5AM to every other condition individually for IFN-γ+ cells; paired t test for cells producing multiple cytokines).
Fig. 5.
Fig. 5.. α-TRBV antibodies promote a “CM-like” phenotype.
(A) Purified T cells were cultured for 7 days without (Unstim) or with the indicated plate-bound antibodies as in Fig. 2 (C and D) and then stained for CD45RA and CCR7 to determine the proportion of naïve and memory phenotypes by flow cytometry. Summary data are shown for the resulting percentages of CD45RANEGCCR7+ central memory (CM) cells for n = 9 donors, as mean ± SD. **P < 0.01; ***P < 0.001 (paired ANOVA with Dunnett’s method, comparing α-TRBV6-5AM to every other condition individually). Example contour plots for one donor are provided (right-hand) with TCM gate delineated in pink. (B and C) Purified T cells or the indicated presorted subsets were cultured for 7 days without (Unstim) or with the indicated plate-bound antibodies as in Fig. 2 (C and D) and then stained for CD45RA and CCR7 to determine the proportion of naïve and memory phenotypes by flow cytometry. Representative contour plots for one donor and summary data of the resulting proportion of CM cells for n = 6 donors are shown in (B) and (C), respectively. In (C), data are shown as mean ± SD. *P < 0.05; **P < 0.01; ***P < 0.001 (paired ANOVA with Dunnett’s method, comparing α-TRBV6-5AM to every other condition individually).
Fig. 6.
Fig. 6.. Single-cell transcriptome analysis α-TRBV–stimulated cells.
(A and B) Purified T cells were cultured for 7 days with the indicated plate-bound antibodies or rested overnight without cytokines (Unstim) and then processed for single-cell RNA sequencing analysis. UMAP representation of clusters and treatment groups are shown in (A); CD4 and CD8 cells are identified in (B) using gene expression (top row) and barcoded antibodies (bottom row). (C) Imputed counts of the indicated genes were used in scatterplots to visualize coexpression patterns across clusters and cell types. (D) UMAP representation of IL7R expression (left) and violin plots (imputed expression, right). Log2FC, log2 fold change; ****P < 0.0001 [Wilcoxon rank sum test with Bonferroni correction, from the differentially expressed gene (DEG) analysis]. (E) Purified T cells were cultured without (Unstim) or with the indicated plate-bound antibodies and cell-surface expression of CD127 on the indicated subsets was monitored by flow cytometry at the indicated time points (n = 6 donors). *P < 0.05; **P < 0.01; ***P < 0.001 (paired t test). (F) UMAP representation of TCF7 expression (top row) and violin plots (imputed expression, bottom row). ****P < 0.0001 (Wilcoxon rank sum test with Bonferroni correction, from the DEG analysis). (G) Purified T cells were cultured for 7 days without (Unstim) or with the indicated plate-bound antibodies and intracellular TCF1 expression was measured in CD4 or CD8 cells. (H) UMAP representation of KLRG1 expression. (I) Purified T cells were cultured for 7 days without (Unstim) or with the indicated plate-bound antibodies and cell surface KLRG1 expression was measured on CD4 or CD8 cells. Data in (G) and (I) are the mean (bars) of percentage positive cells (top row) and MFI of positive cells (bottom row) for n = 6 donors. *P < 0.05; **P < 0.01; ***P < 0.001; ****P < 0.0001 (paired ANOVA with Dunnett’s method, comparing α-TRBV6-5AM to every other condition individually).
Fig. 7.
Fig. 7.. Transcription factor profile and validation of α-TRBV stimulated cells.
(A) Venn diagrams showing the number of transcription factors (TFs) that are uniquely and commonly up/down-regulated across groups. Only TFs that were significantly differentially expressed were included. Significance calculated using hypergeometric test. (B to D) Scatterplots with the imputed expression of genes highlighted, divided by cell type and treatment groups. (E) Violin plots representing the overall expression of genes in the TRM gene signature. The y axis indicates the log2 of the raw counts. ***P < 0.001; *****P < 2.22 × 10⁻¹⁶.
Fig. 8.
Fig. 8.. Distinct responses to α-TRBV antibodies versus SAgs.
(A) Purified PBMC were cultured for 7 days without (Unstim) or with plate-bound α-TRBV20-1PAR antibody or TSST-1 as in Fig. 2 (C and D) and then stained for CD45RA and CCR7 to analyze the resulting memory phenotypes by flow cytometry after gating on TRBV20-1+ cells, for both CD4 (top row) and CD8 (bottom row) cells. Representative data for one donor (C025) for each subset and condition (contour plots) and overlays of the α-TRBV20-1PAR versus TSST-1 conditions (colored dot plots, right) are shown. (B) Summary data of the proportion of each naïve and memory subsets in the indicated conditions for n = 4 donors.

References

    1. Mangani D., Yang D., Anderson A. C., Learning from the nexus of autoimmunity and cancer. Immunity 56, 256–271 (2023). - PMC - PubMed
    1. Sette A., Sidney J., Crotty S., T Cell Responses to SARS-CoV-2. Annu. Rev. Immunol. 41, 343–373 (2023). - PubMed
    1. Mahnke Y. D., Brodie T. M., Sallusto F., Roederer M., Lugli E., The who's who of T-cell differentiation: Human memory T-cell subsets. Eur. J. Immunol. 43, 2797–2809 (2013). - PubMed
    1. Osman M., Park S. L., Mackay L. K., Tissue-resident memory T (TRM) cells: Front-line workers of the immune system. Eur. J. Immunol. 53, e2250060 (2023). - PubMed
    1. Alfei F., Kanev K., Hofmann M., Wu M., Ghoneim H. E., Roelli P., Utzschneider D. T., von Hoesslin M., Cullen J. G., Fan Y., Eisenberg V., Wohlleber D., Steiger K., Merkler D., Delorenzi M., Knolle P. A., Cohen C. J., Thimme R., Youngblood B., Zehn D., TOX reinforces the phenotype and longevity of exhausted T cells in chronic viral infection. Nature 571, 265–269 (2019). - PubMed

Substances