. 2023 Dec 8;9(49):eadf9522.
doi: 10.1126/sciadv.adf9522. Epub 2023 Dec 6.

Mitochondrial metabolic flexibility is critical for CD8+ T cell antitumor immunity

Affiliations

Mitochondrial metabolic flexibility is critical for CD8+ T cell antitumor immunity

Chao Chen et al. Sci Adv. .

Abstract

Mitochondria use different substrates for energy production and intermediatory metabolism according to the availability of nutrients and oxygen levels. The role of mitochondrial metabolic flexibility for CD8+ T cell immune response is poorly understood. Here, we report that the deletion or pharmacological inhibition of protein tyrosine phosphatase, mitochondrial 1 (PTPMT1) significantly decreased CD8+ effector T cell development and clonal expansion. In addition, PTPMT1 deletion impaired stem-like CD8+ T cell maintenance and accelerated CD8+ T cell exhaustion/dysfunction, leading to aggravated tumor growth. Mechanistically, the loss of PTPMT1 critically altered mitochondrial fuel selection-the utilization of pyruvate, a major mitochondrial substrate derived from glucose-was inhibited, whereas fatty acid utilization was enhanced. Persistent mitochondrial substrate shift and metabolic inflexibility induced oxidative stress, DNA damage, and apoptosis in PTPMT1 knockout cells. Collectively, this study reveals an important role of PTPMT1 in facilitating mitochondrial utilization of carbohydrates and that mitochondrial flexibility in energy source selection is critical for CD8+ T cell antitumor immunity.


Figures
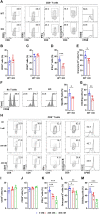
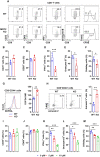
Fig. 1.
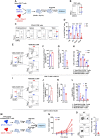
Fig. 1.. Genetic deletion or pharmacological inhibition of PTPMT1 decreases CD8+ effector cell development.
(A to F) CD8+ T cells isolated from PTPMT1 KO and WT control mice were activated by CD3/CD28 antibody–coupled Dynabeads. The cells were analyzed by fluorescence-activated cell sorting (FACS) for the early activation markers CD25 and CD69 24 hours later [(A) to (C)]. Expression of IFN-γ and granzyme B was examined by FACS analyses at day 3 [(A), (D), and (E)]. (F) B16–ovalbumin (OVA) cells were used as target cells and stained in CFSE-low working solution (0.1 μM). Splenocytes were used as control cells and stained in CFSE-high working solution (1 μM). Cells were washed three times with phosphate-buffered saline (PBS). Target cells (CFSE-low) and control cells (CFSE-high) were mixed at the ratio of 1:1 and incubated with OVA peptide (SIINFEKL)–activated OT-I CD8+ T cells for 4 to 5 hours. The cells were then analyzed by FACS. Specific lysis (%) = 100 − 100 × (% CFSE-low/% CFSE-high cells). (A) and (G) Cell division of CD3/CD28 antibody–activated CD8+ T cells was determined by the CFSE dilution assay at day 3. (H to M) CD8+ T cells isolated from WT C57BL/6 mice were activated in the presence of the PTPMT1 inhibitor AD at the indicated concentrations. The cells were examined for early activation markers CD25 and CD69, IFN-γ, granzyme B, and cell division as described above. Data are presented as means ± SD of biological replicates. *P < 0.05, **P < 0.01, and ***P < 0.001.
Fig. 2.
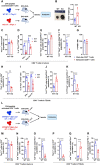
Fig. 2.. PTPMT1 deletion impairs CD8+ T cell antitumor immunity.
(A and B) CD8+ T cells (5 × 10⁵) isolated from WT OT-I mice (CD45.2+) were mixed with CD8+ T cells collected from PTPMT1 KO OT-1/Thy1.1+ mice (CD45.2+) at the 1:1 ratio and adoptively transferred into congenic BoyJ mice (CD45.1+). The recipient mice were subcutaneously injected 5 × 10⁵ B16-OVA melanoma cells 24 hours later. The mice were euthanized 3 weeks later, and CD8+ T cells in the peripheral blood (PB), spleen (SP), tumors, and TDLNs were examined. (C and D) Frequencies of WT and PTPMT1 KO OT-I CD8+ T cells in the donor-derived CD8+ T cell population (CD45.2+) in the peripheral blood, spleen, tumors, and TDLNs were determined. (E to H) Tumor-infiltrating lymphocytes (TILs) were isolated from tumors. Exhausted CD8+ T cells (Tcf1Tim3+CD44+PD-1+) [(E) and (F)] and stem-like CD8+ T cells (Tcf1+Tim3CD44+PD-1+) [(E) and (G)] in the donor-derived CD8+ T cell population were analyzed by FACS analyses. Total cell numbers of donor-derived CD8+ T cells, exhausted CD8+ T cells, and stem-like CD8+ T cells per gram of tumor tissue were determined (E and H). (I to L) Lymphocytes were isolated from TDLNs. Exhausted CD8+ T cells [(I) and (J)] and stem-like CD8+ T cells [(I) and (K)] in the donor-derived CD8+ T cell population were analyzed as above. Total cell numbers of donor-derived CD8+ T cells, exhausted CD8+ T cells, and stem-like CD8+ T cells in TDLNs were determined [(I) and (L)]. (M to O) OVA peptide–activated WT OT-I/Thy1.1+ CD8+ T cells or PTPMT1 KO OT-I/Thy1.1+ CD8+ T cells (10 × 106) were adoptively transferred into BoyJ mice. The recipient mice were subcutaneously injected 5 × 10⁵ B16-OVA melanoma cells 30 days later (M). Tumor growth was monitored at the indicated time points (N). Mice were euthanized, and frequencies of Thy1.1+ CD8+ T cells in TDLNs were examined by FACS analyses (O). Data are presented as means ± SD of biological replicates. **P < 0.01 and ***P < 0.001.
Fig. 3.
Fig. 3.. PTPMT1 loss accelerates CD8+ T exhaustion and impairs stem-like CD8+ T cell maintenance in tumors and TDLNs.
(A to F) B16-OVA melanoma cells (5 × 10⁵) were subcutaneously injected into Boy J mice to allow tumor development for 10 days. OVA peptide–activated WT OT-I/Thy1.1+ CD8+ T cells or PTPMT1 KO OT-I/Thy1.1+ CD8+ T cells (10 × 106) were adoptively transferred into the tumor-bearing mice (A). Mice were euthanized 14 days after T cell transfusion, and tumor weights were assessed (B). Tumor-infiltrating lymphocytes (TILs) were isolated from tumors and frequencies of total donor-derived CD8+ T cells (Thy1.1+) (C), effector CD8+ T cells (Thy1.1+IFN-γ+ or Thy1.1+granzyme B+) (D), exhausted CD8+ T cells (Tcf1Tim3+CD44+PD-1+) (E), and stem-like CD8+ T cells (Tcf1+Tim3CD44+PD-1+) (F) in the donor-derived CD8+ T cell population were determined by FACS analyses. (G) WT donor-derived exhausted CD8+ T cells and stem-like CD8+ T cells were analyzed for PTPMT1 levels by intracellular immunostaining, followed by FACS analyses. MFI, mean fluorescence intensity. (H to K) Lymphocytes isolated from TDLNs were analyzed for donor-derived CD8+ T cells (H), and effector CD8+ T cells (I), exhausted CD8+ T cells (J), and stem-like CD8+ T cells (K) in the donor-derived CD8+ T cell population as above. (L) CD8+ T cells isolated from PTPMT1fl/fl/Mx1-Cre+/OT-I/Thy1.1+ (KO) and PTPMT1+/+/Mx1-Cre+/OT-I/Thy1.1+ (WT) control mice were activated with OVA peptide. Activated CD8+ T cells were adoptively transferred to BoyJ mice with established B16-OVA melanomas as above. Recipient mice were administered by intraperitoneal injection of three doses of pI-pC (1.0 μg/g of body weight) every other day over 5 days to induce Cre expression and PTPMT1 deletion from PTPMT1fl/fl/Mx1-Cre+ OT-I/Thy1.1+ donor-derived T cells. CD8+ T cells from tumors (M to O) and TDLNs (P to R) were examined as above. Data are presented as means ± SD of biological replicates. **P < 0.01 and ***P < 0.001.
Fig. 4.
Fig. 4.. Adaptive transcriptomic responses to PTPMT1 depletion in activated CD8+ T cells.
CD8+ T cells isolated from PTPMT1 KO and WT control mice were activated by CD3/CD28 antibodies. The cells were harvested and processed for RNA-seq analyses. (A) A volcano plot of differentially expressed genes. Three hundred eighty significantly up-regulated genes (red) and 314 significantly down-regulated genes (green) in PTPMT1 KO cells (P < 0.05, fold changes > 2) were identified. (B) Heatmap showing representative differentially expressed genes. The color bar indicates the Z score. (C and D) Enriched Kyoto Encyclopedia of Genes and Genomes (KEGG) pathways for up-regulated genes (C) and down-regulated genes (D) in PTPMT1 KO CD8+ T cells.
Fig. 5.
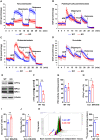
Fig. 5.. PTPMT1 ablation induces mitochondrial metabolism inhibition and bioenergetic stress.
CD8+ T cells isolated from PTPMT1 KO and WT control mice were activated by CD3/CD28 antibodies. (A) Total DNA was extracted. Mitochondrial content was estimated by comparing mitochondrial DNA (mtDNA; cytochrome B) levels to genomic DNA (18S ribosomal gene) levels by quantitative polymerase chain reaction. (B) Cells were stained with MitoTracker Green (100 nM) followed by FACS analyses for MFI in the activated CD8+CD44+ population. (C) Cells were incubated with 2-(N-(7-nitrobenz-2-oxa-1,3-diazol-4-yl)amino)-2-deoxyglucose (2-NBDG) (200 μM) (Thermo Fisher Scientific) at 37°C for 30 min and washed with PBS, followed by FACS analyses for MFI in the CD8+CD44+ population. (D) Total cellular ATP levels were assessed using a CellTiter-Glo 2.0 cell viability assay kit (Promega), which is a homogeneous method to quantify cellular ATP. (E and F) OCR (E) and ECAR (F) of the activated CD8+ T cells (n = 3 mice per group) in the medium containing all metabolic substrates were measured by a Seahorse metabolic flux analyzer in the presence of the mitochondrial inhibitor (oligomycin), the uncoupling agent (FCCP), and the respiratory chain inhibitor (rotenone). Data are presented as means ± SD of biological replicates. *P < 0.05 and **P < 0.01. (G) Activated CD8+ T cells were lysed, and whole-cell lysates were examined by immunoblotting with the indicated antibodies. Representative results from three mice per group are shown.
Fig. 6.
Fig. 6.. PTPMT1 deficiency limits mitochondrial utilization of pyruvate.
(A to D) Mitochondria were isolated from livers dissected from PTPMT1fl/fl/Mx1-Cre+ mice and PTPMT1+/+/Mx1-Cre+ littermates (n = 3 mice per group) 2 weeks following pI-pC administration and PTPMT1 deletion. Oxygen consumption of the mitochondria was measured in the presence of pyruvate/malate (A), palmitoyl-CoA/carnitine/malate (B), glutamate/malate (C), or succinate (D), following the addition of adenosine 5′-diphosphate (ADP), oligomycin, FCCP, and rotenone. (E) CD8+ T cells isolated from PTPMT1fl/fl/Lck-Cre+ mice and PTPMT1+/+/Lck-Cre+ littermates were activated by CD3/CD28 antibodies. Whole-cell lysates were prepared and examined by immunoblotting with the indicated antibodies. Representative results from three mice per group are shown. α-KG levels (F) and PDH activities (G) in the lysates were measured using an α-KG assay kit and a PDH activity colorimetric assay kit (BioVision) following the manufacturer’s instructions. (H to J) CD8+ T cells isolated from PTPMT1 KO mice were activated with CD3/CD28 antibodies in the presence of cell permeable α-KG [dimethyl-ketoglutarate, DM-2OG (4 mM)] or vehicle control. Cells were harvested and analyzed for IFN-γ (H), granzyme B (I), and cell division (J) by FACS analyses. (K) Mitochondria were isolated as described in (A). They were assessed by the pyruvate uptake assay. 13C-pyruvate levels in the mitochondrial lysates were measured by mass spectrometry. Data are presented as means ± SD of biological replicates. *P < 0.05, **P < 0.01, and ***P < 0.001.
Fig. 7.
Fig. 7.. Reprogrammed cellular metabolism in PTPMT1 deleted CD8+ effector T cells.
CD8+ T cells isolated from PTPMT1 KO and WT control mice (n = 3 mice per group) were activated with CD3/CD28 antibodies. The cells were harvested and processed for metabolomic profiling using capillary electrophoresis time-of-flight mass spectrometry and capillary electrophoresis-triple quadrupole mass spectrometry. (A) Results of hierarchical clustering analyses of metabolite levels. (B) Changes in major metabolic pathways, including glycolysis, the TCA cycle, the pentose phosphate pathway, etc. N.D. indicates that the metabolites were not detected. (C) A volcano plot of significantly up-regulated (red) and down-regulated (green) metabolites.
Fig. 8.
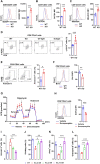
Fig. 8.. Defective CD8+ effector T cell development induced by PTPMT1 depletion is attributable to oxidative stress and apoptosis.
WT and PTPMT1 KO CD8+ T cells were activated by CD3/CD28 antibodies and then stained with BODIPY 493/503 (A), DCFDA (B), and MitoSOX (C). MFI of the dyes in CD8+CD44+ T cells was measured by FACS analyses. (D) WT and PTPMT1 KO CD8+ T cells activated with CD3/CD28 antibodies were processed for γ-H2AX immunostaining followed by FACS analyses in the gated CD8+CD44+ effector T cells. Ultraviolet (UV) light–treated cells were used as the positive control, and isotype staining was used as the negative control. (E) Activated CD8+ T cells were processed for apoptosis analyses. Annexin V+ apoptotic cells in the CD8+CD44+ population were quantified by FACS analyses. 7-AAD, 7-aminoactinomycin D. (F) Bcl-2 levels in CD8+CD44+ effector T cell population were determined by FACS analyses. (G and H) PTPMT1 KO CD8+ T cells were activated with CD3/CD28 antibodies in the presence of the AMPK inhibitor dorsomorphin (300 nM) or vehicle control. Cells were then washed with XF base medium and resuspended in XF base medium without metabolic substrates. OCRs were measured following the injections of sodium pyruvate (5 mM), oligomycin (1.5 μM), FCCP (1.2 μM), and rotenone (1.0 μM) (G). Cells were also analyzed for ROS levels as described above (H). (I to L) CD8+ T cells isolated from PTPMT1 KO mice were activated with CD3/CD28 antibodies in the presence of NAC at the indicated concentrations. The cells were harvested and analyzed for apoptosis, cell division, IFN-γ, and granzyme B by FACS analyses. Data are presented as means ± SD of biological replicates. *P < 0.05, **P < 0.01, and ***P < 0.001.
Fig. 9.
Fig. 9.. Mitochondrial oxidation of pyruvate is essential for CD8+ effector T cell development.
(A to F) MPC2fl/fl/Lck-Cre+ (MPC2 KO) mice were generated, and CD8+ T cells isolated from MPC2 KO and WT (MPC2+/+/Lck-Cre+) control mice were activated by CD3/CD28 antibodies. Early activation markers CD25 and CD69 were examined at day 1 [(A) to (C)]. IFN-γ–expressing and granzyme B+ effector cells were determined by FACS analyses at day 3 (A to E). Cell division was examined by the CFSE dilution assay on day 3 [(A) to (F)]. (G and H) Activated CD8+ T cells were processed for ROS and apoptosis analyses. MFI of DCFDA (G) and annexin V+ apoptotic cells (H) in the CD8+CD44+ effector cell population were quantified by FACS analyses. (I to M) CD8+ T cells isolated from WT C57BL/6 mice were activated by CD3/CD28 antibodies in the presence of UK5099 at the indicated concentrations. Cells were examined for early activation markers CD25 and CD69 at day 1 [(I) and (J)]. IFN-γ–expressing and granzyme B+ effector cells were determined by FACS at day 3 [(K) and (L)]. Cell division was examined by the CFSE dilution assay on day 3 (M). Data are presented as means ± SD of biological replicates. *P < 0.05, **P < 0.01, and ***P < 0.001.

References

    1. B. H. Goodpaster, L. M. Sparks, Metabolic flexibility in health and disease. Cell Metab. 25, 1027–1036 (2017). - PMC - PubMed
    1. M. Hashimoto, A. O. Kamphorst, S. J. Im, H. T. Kissick, R. N. Pillai, S. S. Ramalingam, K. Araki, R. Ahmed, CD8 T cell exhaustion in chronic infection and cancer: Opportunities for interventions. Annu. Rev. Med. 69, 301–318 (2018). - PubMed
    1. S. J. Im, M. Hashimoto, M. Y. Gerner, J. Lee, H. T. Kissick, M. C. Burger, Q. Shan, J. S. Hale, J. Lee, T. H. Nasti, A. H. Sharpe, G. J. Freeman, R. N. Germain, H. I. Nakaya, H. H. Xue, R. Ahmed, Defining CD8+ T cells that provide the proliferative burst after PD-1 therapy. Nature 537, 417–421 (2016). - PMC - PubMed
    1. C. S. Eberhardt, H. T. Kissick, M. R. Patel, M. A. Cardenas, N. Prokhnevska, R. C. Obeng, T. H. Nasti, C. C. Griffith, S. J. Im, X. Wang, D. M. Shin, M. Carrington, Z. G. Chen, J. Sidney, A. Sette, N. F. Saba, A. Wieland, R. Ahmed, Functional HPV-specific PD-1+ stem-like CD8 T cells in head and neck cancer. Nature 597, 279–284 (2021). - PMC - PubMed
    1. D. T. Utzschneider, M. Charmoy, V. Chennupati, L. Pousse, D. P. Ferreira, S. Calderon-Copete, M. Danilo, F. Alfei, M. Hofmann, D. Wieland, S. Pradervand, R. Thimme, D. Zehn, W. Held, T cell factor 1-expressing memory-like CD8+ T cells sustain the immune response to chronic viral infections. Immunity 45, 415–427 (2016). - PubMed

MeSH terms

Substances