. 2023 Dec 27;23(24):11940-11948.
doi: 10.1021/acs.nanolett.3c04150. Epub 2023 Dec 6.

Structural Dynamics of E6AP E3 Ligase HECT Domain and Involvement of a Flexible Hinge Loop in the Ubiquitin Chain Synthesis Mechanism

Affiliations

Structural Dynamics of E6AP E3 Ligase HECT Domain and Involvement of a Flexible Hinge Loop in the Ubiquitin Chain Synthesis Mechanism

Kazusa Takeda et al. Nano Lett. .

Abstract

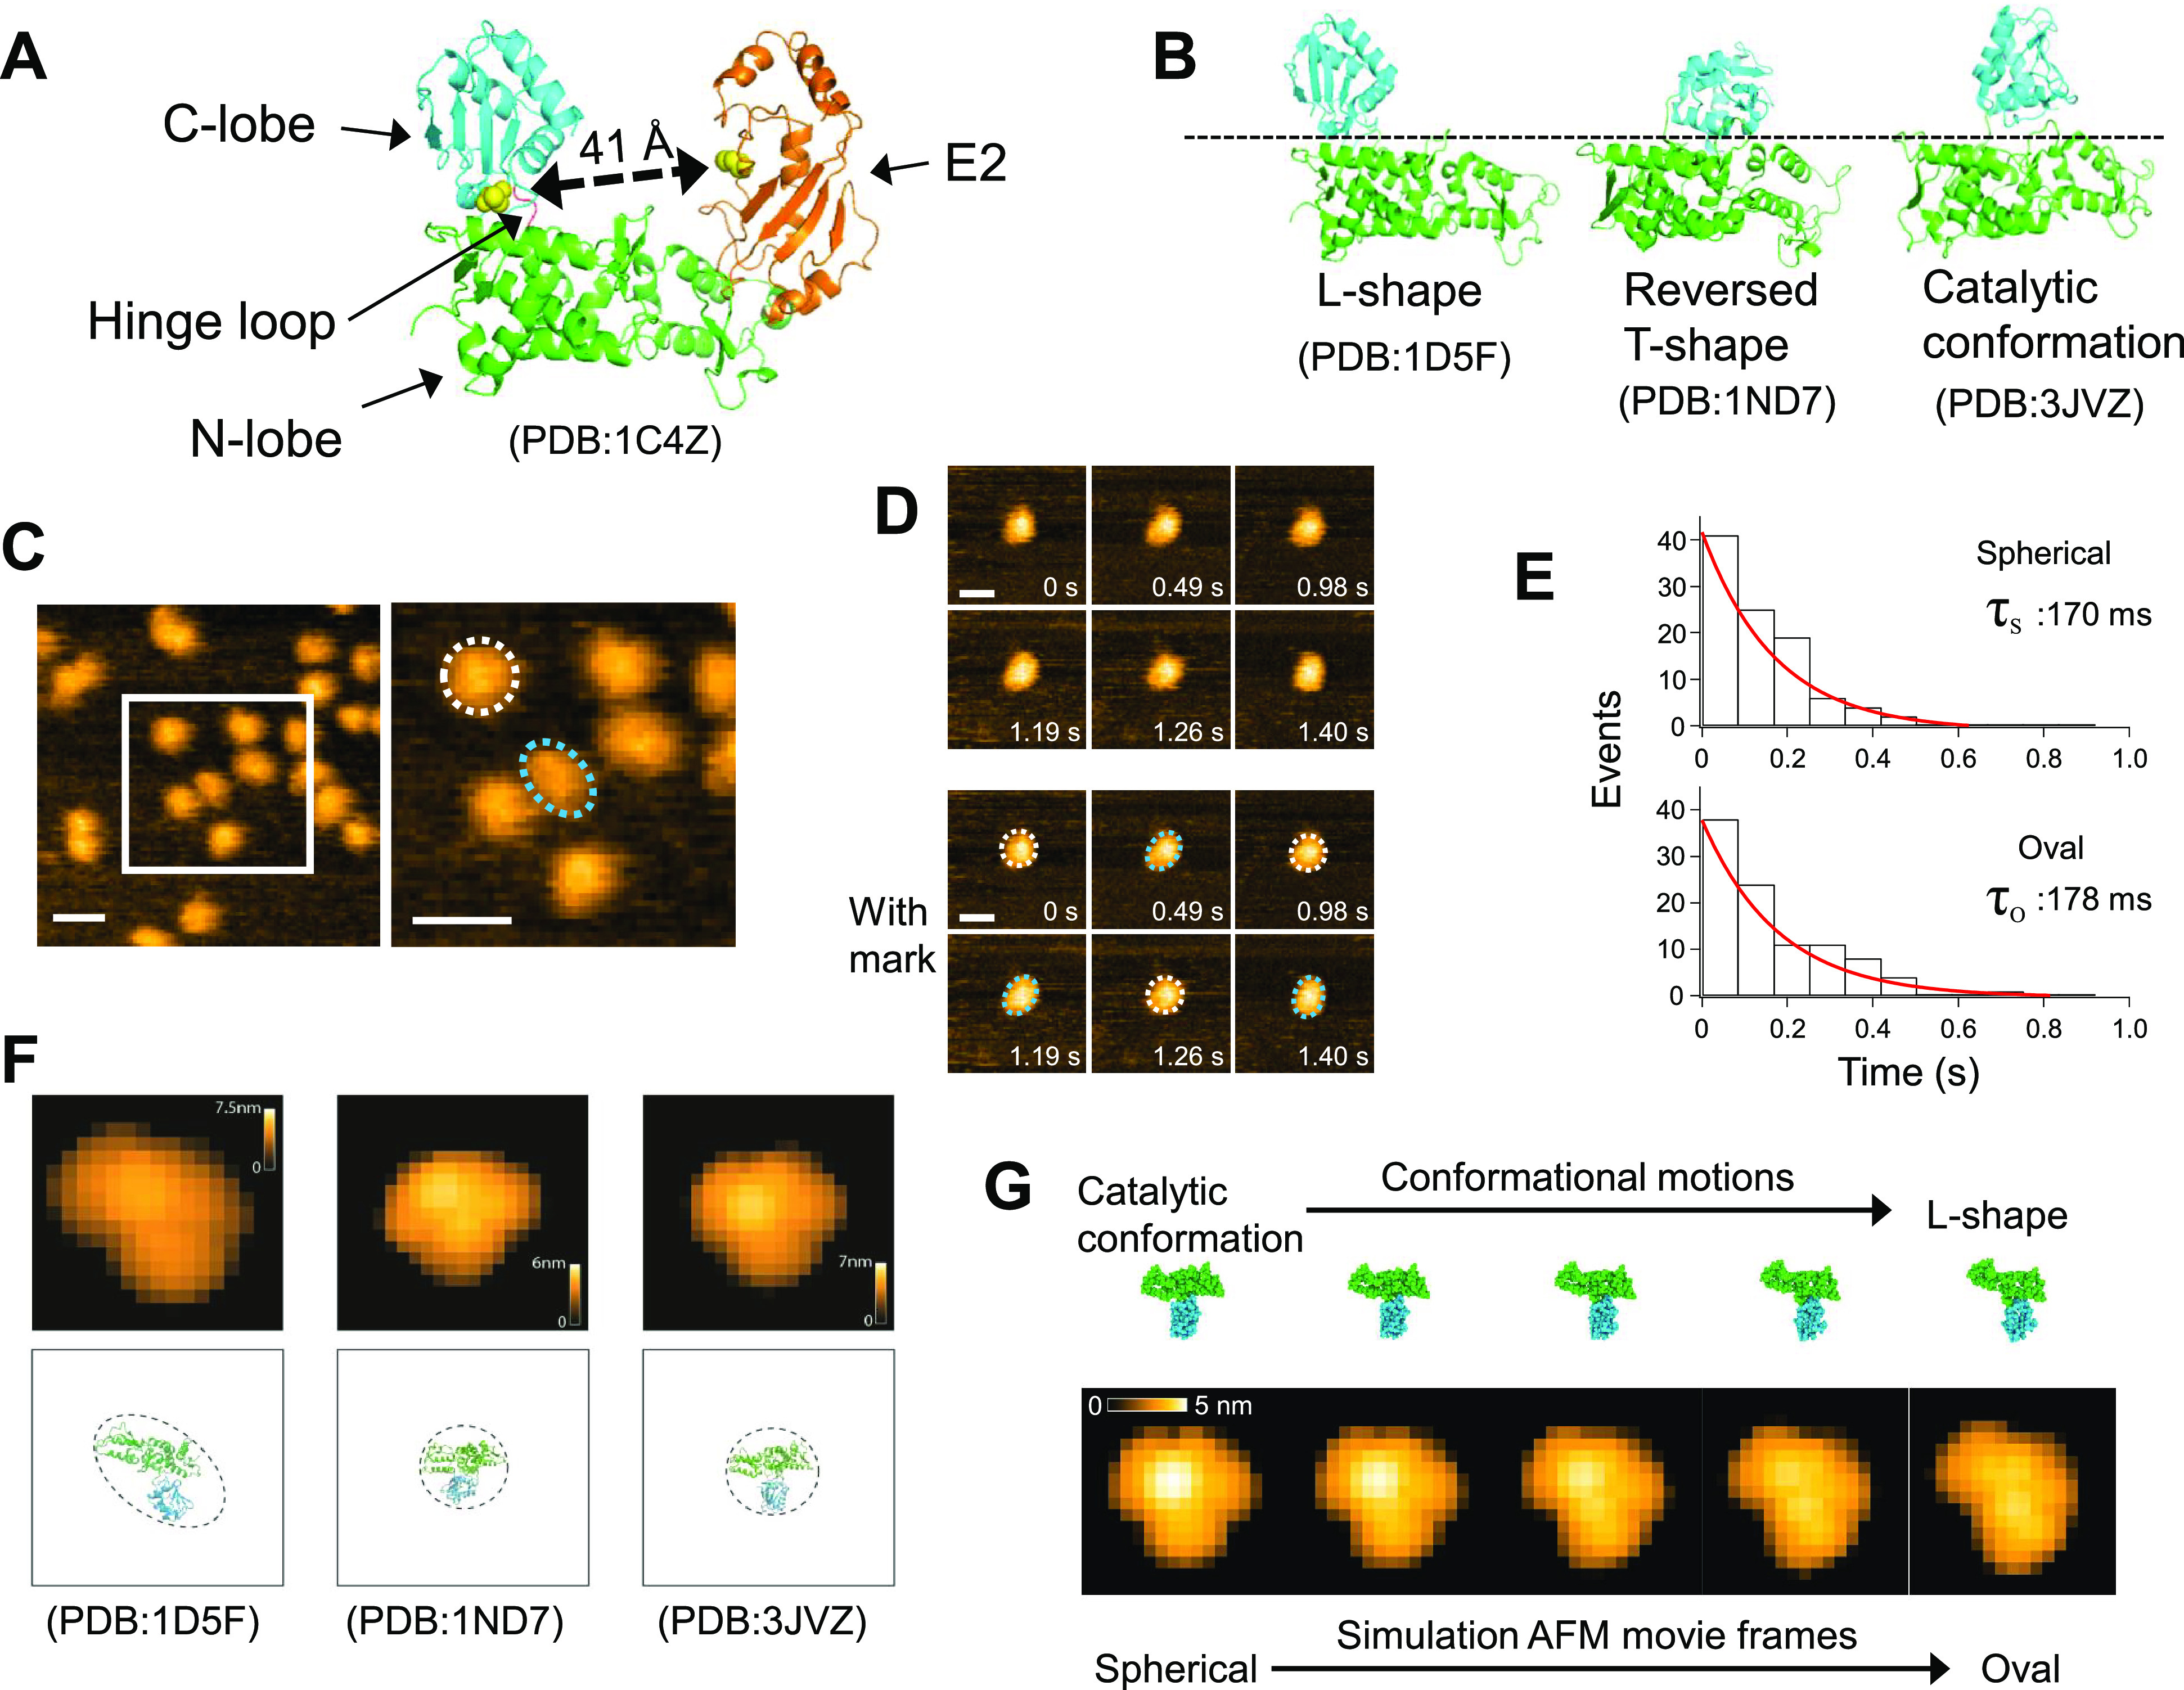
Ubiquitin (Ub) ligases E3 are important factors in selecting target proteins for ubiquitination and determining the type of polyubiquitin chains on the target proteins. In the HECT (homologous to E6AP C-terminus)-type E3 ligases, the HECT domain is composed of an N-lobe and a C-lobe that are connected by a flexible hinge loop. The large conformational rearrangement of the HECT domain via the flexible hinge loop is essential for the HECT-type E3-mediated Ub transfer from E2 to a target protein. However, detailed insights into the structural dynamics of the HECT domain remain unclear. Here, we provide the first direct demonstration of the structural dynamics of the HECT domain using high-speed atomic force microscopy at the nanoscale. We also found that the flexibility of the hinge loop has a great impact not only on its structural dynamics but also on the formation mechanism of free Ub chains.

Keywords: E6AP E3 ligase; HECT domain; high-speed atomic force microscope (HS-AFM); molecular modeling; structural dynamics; ubiquitin.


Conflict of interest statement

The authors declare no competing financial interest.

Figures

Figure 1
Figure 1
Three different structural states of HECT domain and HS-AFM imaging of E6APHECT_WT. (A) Structure of an E6AP HECT domain-E2 complex. The HECT domain is composed of N-lobe (green) and C-lobe (cyan), which are connected by a hinge loop (red). The ubiquitin-conjugating enzyme (E2) is shown in orange. The Cys residues on the HECT domain and E2 that form thioester bonds with Ub are shown as yellow spheres. The distance between these Cys residues is about 41 Å. Therefore, a large conformational change of the C-lobe is required for Ub transfer. (B) Left, the structure of E6AP HECT domain separated from the catalytic Cys residue of E2 by 41 Å as described in A (L-shape), which is too far for Ub transfer. Middle, the Cys residue of WWP1 HECT domain (reversed T-shape) is located within 16 Å from the Cys residue of E2, but the distance is still far for Ub transfer., Right, the distance is significantly shortened (∼8 Å) in the structure of NEDD4L HECT domain (catalytic conformation state), which enables Ub transfer from E2 to C-lobe. (C) Left, AFM images of E6APHECT_WT. Scan range, 100 × 100 nm; number of pixels, 100 × 100; imaging rate, 6.67 fps; scale bar, 15 nm; z-scale, 4 nm. Right, magnified image of the region surrounded by the white line in the left panel. Scale bar, 15 nm. The typical particles with spherical (white dotted line) and oval (blue dotted line) shapes are indicated. (D) HS-AFM image sequence of E6APHECT_WT. In the lower panel, the spherical and oval particles appearing along time are marked with white dotted line or blue dotted line, respectively. Interconversion between the two shapes was observed. Scan range, 40 × 40 nm; number of pixels, 60 × 60; imaging rate, 14.3 fps; scale bar, 10 nm; z-scale, 4 nm. (E) Dwell time distributions of the oval and spherical shape states of E6APHECT_WT, which were fitted to single exponential functions to estimate the time constants (τO and τS). (F) Automatized fitting of PDB structures into experimental AFM images (see also Figures S1 and S2). The upper panel shows simulation AFM images of molecular orientations identified by fitting corresponding PDB structures displayed in the lower panel to HS-AFM images (molecular structures are displayed in scale). The image correlation coefficient of oval shape with L-shape (PDB: 1D5F) was 0.96. The image correlation coefficient of spherical shape with reversed T-shape (PDB: 1ND7) and catalytic conformation (PDB: 3JVZ) were 0.95 and 0.94, respectively. The maximum heights were 5.4 nm for L-shape, 4.9 nm for reversed T-shape and 5.9 nm for catalytic conformation. (G) Molecular dynamics modeling of the HECT domain transition from catalytic to L-shape state. Upper row, snapshots of atomistic conformations along state transitions. Bottom row, corresponding simulation AFM images showing the transition from spherical to oval topography shape (see also Movie S1).
Figure 2
Figure 2
HS-AFM imaging of E6APHECT_WT containing Ub. (A) Representative HS-AFM image of E6APHECT_WT containing Ub. Scan range, 100 × 100 nm; number of pixels, 100 × 100; imaging rate, 6.67 fps; scale bar, 15 nm; z-scale, 4 nm. (B) HS-AFM image sequence of E6APHECT_WT containing Ub. Scan range, 40 × 40 nm; number of pixels, 60 × 60; imaging rate, 14.3 fps; scale bar, 10 nm; z-scale, 4 nm. The white arrows point to small particles around the HECT domain, which are presumably Ub. (C) Left, the same image as that acquired at 1.54 s in (B). The spherical shape of the HECT domain is encircled by the white dotted line. The white arrow points to a small particle around the HECT domain. Middle, height measurement of the HECT domain. Right, height profile along the red line in the middle panel. (D) Left, the same image as that acquired at 1.61 s in B. The oval shape of the HECT domain is encircled by the light-blue dotted line. The white arrow points to a small particle around the HECT domain. Middle, height measurement of the HECT domain. Right, height profile along the red line in middle panel. (E) Continuous observation of the structural dynamics of HECT domain before and after addition of E2-Ub. Scan range, 50 × 50 nm; number of pixels, 65 × 65 pixels; imaging rate, 20 fps; scale bar 10 nm. E2-Ub was added at the timing indicated by the black arrow. White and light-blue arrows point to the E2-Ub and Ub on HECT domain, respectively. (F) Dwell time distributions of oval and spherical shape states of E6APHECT_WT containing Ub. Distributions were fitted to single exponential functions to estimate the time constants (τO and τS).
Figure 3
Figure 3
HS-AFM imaging and structure prediction of E6APHECT_PPPP. (A) Left, HS-AFM image of E6APHECT_PPPP. Scan range, 100 × 100 nm; number of pixels, 100 × 100; imaging rate, 6.67 fps; scale bar, 15 nm; z-scale, 5 nm. Right, magnified image of the region surrounded by the white line in the left panel. The typical particles with spherical shape are encircled by the white dotted line. scale bar, 15 nm. (B) Height distribution of E6APHECT_PPPP. The solid line shows most probable Gaussian fitting obtained with 3.7 ± 0.5 nm for mean height ± SD. (C) Left, HS-AFM image sequence of E6APHECT_PPPP captured from 0 to 1.40 s. Scan range, 40 × 40 nm; number of pixels, 60 × 60 pixels; imaging rate, 14.3 fps; scale bar, 10 nm; z-scale, 4 nm. Right, the same image sequence as that shown in the left panel. The spherical shape of the HECT domain is unchanged, as indicated by the white dotted lines. (D) Structure prediction of E6APHECT_WT and E6APHECT_PPPP by AlphaFold2. (E) Pseudo AFM image (right) simulated from the E6APHECT_PPPP structure predicted by AlphaFold2 (left).
Figure 4
Figure 4
Free Ub2 formation by E6APHECT_WT or E6APHECT_PPPP. (A) Immunoblot analysis of the formation of free Ub2 by E6APHECT_WT and E6APHECT_PPPP using an anti-Ub antibody. Each lane shows ubiquitinated products corresponding to the indicated reaction time. Arrows indicate the running positions of Ub and Ub thioester complexes. (B) Ub2 formation assay for E6APHECT_WT (left) and E6APHECT_PPPP (right) without recycling of E2-Ub thioester complex. 0.1 μM UBE1 (E1), 6 μM UbcH7 (E2), and 90 μM Ub were preincubated for 1 h at 37 °C in reaction buffer. After preincubation, the reaction mixture was incubated with 100 mM EDTA for 10 min at 25 °C. Then, 3 μM HECT protein (E6APHECT_WT or E6APHECT_PPPP) was added to the reaction solutions and reacted for 0–60 min at 25 °C. (C) Schematics of three proposed Ub2 formation models. In the E3 monomer model (left), a specific Lys residue of a noncovalently bound acceptor Ub reacts with the thioester bond of the E3-linked Ub (donor Ub). In the E2/E3 heterodimer model (middle), the acceptor Ub covalently binds to the Cys residue on the HECT domain and a specific Lys residue of this acceptor Ub reacts to Ub-G76 on the E2–Ub thiol ester. The E2/E3 heterodimer model was suggested by Wong et al. to be the most likely mechanism for free Ub2 formation by E6AP HECT domain. In the E3 homodimer model (right), the acceptor Ub is covalently bound to the Cys residue on the HECT domain, and a specific Lys residue of this acceptor Ub attacks the Ub-G76 bond on the second molecule of the HECT-Ub thiolester. (D) Ub2 formation assay by using Ub (1–74) lacking the C-terminus Gly-Gly dipeptide of the wild type Ub (1–76). To form E2-Ub thioester complexes, 0.1 μM UBE1 (E1), 6 μM UbcH7 (E2), and low concentration (3 μM) of Ub (1–76) were preincubated for 1 h at 37 °C in reaction buffer. After preincubation, 3 μM E6APHECT_WT or E6APHECT_PPPP was further added and incubate for 10 min at 25 °C to charge Ub (1–76) on 3 μM E6APHECT_WT or E6APHECT_PPPP. Then 90 μM Ub (1–74) was added to the mixture and reacted for 0–60 min at 25 °C.
Figure 5
Figure 5
Investigation of free Ub2 formation by E6APHECT_PPPP at different concentrations of E2 or E3, and schematic presentation for free Ub2 formation by E6AP HECT domain. (A) Ub2 formation at different concentrations of E2. The concentrations of UBE1 (E1) and HECT proteins were fixed at 0.1 μM and 3 μM, respectively, while that of UbcH7 (E2) was varied as indicated. Reaction products were analyzed by immunoblot with anti-Ub antibody. Each lane shows the ubiquitinated products formed during the indicated reaction time. (B) Ub2 formation at different concentrations of E3. The concentrations of UBE1 (E1) and UbcH7 (E2) were fixed at 0.1 μM and 6 μM, respectively, while that of HECT proteins was varied as indicated. (C) Schematic model for the efficiency of free Ub2 formation by E6AP HECT domain depending on its structural state. The upper pathway depicts high efficiency of free Ub2 formation. When the HECT domain adopts the reversed T-shape or catalytic conformational state structure after receiving Ub, HECT domain dimers are formed, through which the HECT domain becomes tending to lower its retentivity for the received Ub, thus easily releasing Ub as Ub2. The lower pathway depicts the normal Ub2 formation process. When the HECT domain adopts an L-shaped structure after receiving Ub, the HECT domain becomes tending to retain Ub, thus slowing the release of Ub2.

References

    1. Goldstein G.; Scheid M.; Hammerling U.; Schlesinger D. H.; Niall H. D.; Boyse E. A. Isolation of a polypeptide that has lymphocyte-differentiating properties and is probably represented universally in living cells. Proc. Natl. Acad. Sci. U. S. A. 1975, 72 (1), 11–5. 10.1073/pnas.72.1.11. - DOI - PMC - PubMed
    1. Glickman M. H.; Ciechanover A. The ubiquitin-proteasome proteolytic pathway: destruction for the sake of construction. Physiol Rev. 2002, 82 (2), 373–428. 10.1152/physrev.00027.2001. - DOI - PubMed
    1. Kamadurai H. B.; Souphron J.; Scott D. C.; Duda D. M.; Miller D. J.; Stringer D.; Piper R. C.; Schulman B. A. Insights into ubiquitin transfer cascades from a structure of a UbcH5B approximately ubiquitin-HECT(NEDD4L) complex. Mol. Cell 2009, 36 (6), 1095–102. 10.1016/j.molcel.2009.11.010. - DOI - PMC - PubMed
    1. Huibregtse J. M.; Scheffner M.; Beaudenon S.; Howley P. M. A family of proteins structurally and functionally related to the E6-AP ubiquitin-protein ligase. Proc. Natl. Acad. Sci. U. S. A. 1995, 92 (11), 5249.10.1073/pnas.92.11.5249-a. - DOI - PMC - PubMed
    1. Huang L.; Kinnucan E.; Wang G.; Beaudenon S.; Howley P. M.; Huibregtse J. M.; Pavletich N. P. Structure of an E6AP-UbcH7 complex: insights into ubiquitination by the E2-E3 enzyme cascade. Science 1999, 286 (5443), 1321–6. 10.1126/science.286.5443.1321. - DOI - PubMed

Publication types

MeSH terms