. 2024 Mar 1;73(3):461-473.
doi: 10.2337/db23-0148.

A Translational Regulatory Mechanism Mediated by Hypusinated Eukaryotic Initiation Factor 5A Facilitates β-Cell Identity and Function

Affiliations

A Translational Regulatory Mechanism Mediated by Hypusinated Eukaryotic Initiation Factor 5A Facilitates β-Cell Identity and Function

Craig T Connors et al. Diabetes. .

Abstract

As professional secretory cells, β-cells require adaptable mRNA translation to facilitate a rapid synthesis of proteins, including insulin, in response to changing metabolic cues. Specialized mRNA translation programs are essential drivers of cellular development and differentiation. However, in the pancreatic β-cell, the majority of factors identified to promote growth and development function primarily at the level of transcription. Therefore, despite its importance, the regulatory role of mRNA translation in the formation and maintenance of functional β-cells is not well defined. In this study, we have identified a translational regulatory mechanism mediated by the specialized mRNA translation factor eukaryotic initiation factor 5A (eIF5A), which facilitates the maintenance of β-cell identity and function. The mRNA translation function of eIF5A is only active when it is posttranslationally modified ("hypusinated") by the enzyme deoxyhypusine synthase (DHPS). We have discovered that the absence of β-cell DHPS in mice reduces the synthesis of proteins critical to β-cell identity and function at the stage of β-cell maturation, leading to a rapid and reproducible onset of diabetes. Therefore, our work has revealed a gatekeeper of specialized mRNA translation that permits the β-cell, a metabolically responsive secretory cell, to maintain the integrity of protein synthesis necessary during times of induced or increased demand.


Conflict of interest statement

Duality of Interest. No potential conflicts of interest relevant to this article were reported.

Figures

Figure 1
Figure 1
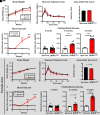
A mouse model of β-cell–specific genetic deletion of Dhps. A: Mouse alleles used to generate the β-cell–specific deletion of Dhps (DHPSΔBETA). Pancreas tissue from control animals (Ins1-cre;R26RTomato) was evaluated by immunofluorescence for expression of insulin (B), Tomato (C), and glucagon (D) to confirm β-cell–specific Cre activity. E: Islets show coexpression of Tomato in the insulin-expressing β-cells. F: Western blot analysis of islets from 4-week-old DHPSΔBETA mutants for expression of DHPS, eIF5AHYP, eIF5ATOTAL, and total protein (as visualized by Revert). Densitometric data for DHPS (G), the ratio of eIF5AHYP-to-eIF5ATOTAL (H), and total eIF5A (n = 3/group) (I). Immunofluorescence to visualize insulin, glucagon, and DAPI was performed on pancreata from 1-week-old Ins1-cre (J) and DHPSΔBETA mice (K). L: Quantification of β-cell area (n = 6–7/group). Body weight (M) and ad libitum fed blood glucose levels (N) at 1 week of age (n = 6–7/group). Plasma insulin (O) and glucagon (P) levels were measured (n = 5–7/group). Quantitative data are represented as mean ± SEM. *P < 0.05. Scale bar: 100 µm.
Figure 2
Figure 2
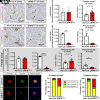
Measurement of metabolic parameters in the DHPSΔBETA mice after weaning. A: Body weight in male mice was measured in Ins1-cre and DHPSΔBETA mice weekly beginning at weaning (3 weeks; n = 4–8/group). B: GTTs were performed on 4-week-old mice (n = 4–8/group). C: Area under the curve was quantified from GTT data. D: Blood glucose was measured weekly beginning at weaning (n = 4–8/group). E: Blood glucose was measured after a 5-h fast in 4-, 4.5-, and 6-week-old mice (n = 3–19/group). FJ: The identical phenotype was observed in female mice for all parameters. Quantitative data are represented as mean ± SEM. *P < 0.05; ***P < 0.001; ****P < 0.0001.
Figure 3
Figure 3
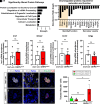
Insulin-expressing cell area in the DHPSΔBETA mice is reduced at 5 and 6 weeks of age. Insulin expression in pancreas from 4-week-old Ins1-cre (A) and DHPSΔBETA (B) mice. Eosin (purple) defines pancreas area. C: β-Cell area normalized to pancreas area. D: Plasma insulin levels in 4-week-old Ins1-cre and DHPSΔBETA mice (n = 6/group). Insulin expression in pancreas from 6-week-old Ins1-cre (E) and DHPSΔBETA (F) mice (n = 3/group). Eosin (purple) defines pancreas area. G: β-Cell area normalized to pancreas area. H: Plasma insulin levels in 6-week-old Ins1-cre and DHPSΔBETA mice (n = 3–4/group). IL: Female mice show the same phenotype as male mice. Pancreas tissue from 6-week-old Ins1-cre (MO) and DHPSΔBETA (PR) mice showing expression of insulin and the β-cell lineage reporter (Tomato) (n = 3/group). Scale bar: 100 µm. S: Tomato+/insulin, Tomato/insulin+, and Tomato+/insulin+ cell populations were quantified and expressed as the percentage of Tomato+ cells (average Tomato+ cell count: Ins1-cre, 7,475; DHPSΔBETA, 5,517). T: Tomato+/insulin, Tomato/insulin+, and Tomato+/insulin+ cell populations were quantified in control and mutant mice at 5 weeks of age and expressed as the percentage of Tomato+ cells (average Tomato+ cell count: Ins1-cre, 10,422; DHPSΔBETA, 12,934). Quantitative data are represented as mean ± SEM. *P < 0.05, **P < 0.01, ****P < 0.0001.
Figure 4
Figure 4
β-Cell death is not observed in islets from DHPSΔBETA mice. TUNEL assay was performed on pancreas tissue from 5-week-old TUNEL-positive control (tissue treated with DNase) (AC), Ins1-cre (DF), and DHPSΔBETA (GI) mice to determine cell death (TUNEL, white). Scale bar: 100 µm. A’, D’, and G’: Higher magnification to visualize location of TUNEL. Scale bar: 10 µm. J: TUNEL+ insulin-deficient lineage-labeled (Tomato+) β-cells were counted (average TUNEL+ cells/insulinTomato+ cells: Ins1-cre males, 0/8,624; DHPSΔBETA males, 0/2,929; Ins1-cre females, 2.6/8,624; DHPSΔBETA females, 2.5/11,120). K: TUNEL+ insulin-expressing lineage-labeled (Tomato+) β-cells were counted (average TUNEL+ cells/insulin+Tomato+ cells: Ins1-cre males, 0/5,945; DHPSΔBETA males 0/9,489; Ins1-cre females, 0.6/3,782; DHPSΔBETA females, 0/7,109) (n = 3/group). Data are represented as mean ± SEM. ns, not significant.
Figure 5
Figure 5
Islets from DHPSΔBETA mice show altered protein synthesis and loss of identity in the β-cells. A: Pathway analysis performed on proteomic data from 4-week-old DHPSΔBETA mutant islets compared with Ins1-cre controls. B: Select proteins from the pathway analysis are shown; these proteins required for β-cell maturation and function were downregulated in the 4-week-old DHPSΔBETA mutant islets. The genes outlined by the shaded box were analyzed for transcript abundance. Real-time PCR was used to quantify gene expression of Ins1 (C), Slc2a2 (D), Ucn3 (E), and Chga (F). Immunofluorescence was performed on pancreas tissue from 6-week-old Ins1-cre (G and H) and DHPSΔBETA (I and J) mice to determine the coexpression of Glut2 (white) and insulin with the R26RTomato β-cell lineage reporter (Tomato). Scale bar: 100 µm. G’ and I’: Localization of Glut2 (white) relative to nuclei marker (Sytox). Scale bar: 10 µm. K: Tomato+/insulin/Glut2 and Tomato+/insulin/Glut2+ cell populations were quantified (n = 3/group). Data are represented as mean ± SEM. ns, not significant; *P < 0.05.
Figure 6
Figure 6
Markers of β-cell identity and function are reduced in DHPSΔBETA islets. Immunofluorescence on pancreas tissue from 6-week-old Ins1-cre (A and B) and DHPSΔBETA (C and D) mice to determine expression of insulin, the R26RTomato β-cell lineage reporter (Tomato), and Pdx1 (white). Scale bar: 100 µm. A’ and C’: Higher magnification to visualize localization of Pdx1. Scale bar: 10 µm. Pancreas tissue from 6-week-old Ins1-cre (E and F) and DHPSΔBETA (G and H) mice stained for insulin, Tomato, and MafA (white). Scale bar: 100 µm. E’ and G’: Higher magnification to visualize localization of MafA. Scale bar: 10 µm. I: Quantification of insulin deficient/lineage-labeled cells with or without Pdx1 expression. J: Quantification of insulin deficient/lineage-labeled cells with or without MafA expression. K: Transcript abundance of Pdx1 normalized to Luciferase spike-in control gene expression. L: Transcript abundance of Mafa normalized to Luciferase spike-in control gene expression. Data are represented as mean ± SEM (n = 3/group). ns, not significant *P < 0.05, **P < 0.01, ****P < 0.0001.

Similar articles

Cited by

References

    1. Fu Z, Gilbert ER, Liu D.. Regulation of insulin synthesis and secretion and pancreatic Beta-cell dysfunction in diabetes. Curr Diabetes Rev 2013;9:25–53 - PMC - PubMed
    1. MacDonald PE, Rorsman P.. The ins and outs of secretion from pancreatic β-cells: control of single-vesicle exo- and endocytosis. Physiology (Bethesda) 2007;22:113–121 - PubMed
    1. Kotzaeridou U, Young-Baird SK, Suckow V, et al. . Novel pathogenic EIF2S3 missense variants causing clinically variable MEHMO syndrome with impaired eIF2γ translational function, and literature review. Clin Genet 2020;98:507–514 - PMC - PubMed
    1. Parreiras-e-Silva LT, Luchessi AD, Reis RI, et al. . Evidences of a role for eukaryotic translation initiation factor 5A (eIF5A) in mouse embryogenesis and cell differentiation. J Cell Physiol 2010;225:500–505 - PubMed
    1. Pan FC, Wright C.. Pancreas organogenesis: from bud to plexus to gland. Dev Dyn 2011;240:530–565 - PubMed

MeSH terms

Substances